
ABSTRACT
Large/abnormal offspring syndrome (LOS/AOS) is a congenital overgrowth syndrome reported in ruminants produced by assisted reproduction (ART-LOS) which exhibit global disruption of the epigenome and transcriptome. LOS/AOS shares phenotypes and epigenotypes with the human congenital overgrowth condition Beckwith-Wiedemann syndrome. We have reported that LOS occurs spontaneously (SLOS); however, to date, no study has been conducted to determine if SLOS has the same methylome epimutations as ART-LOS. In this study, we performed whole-genome bisulphite sequencing to examine global DNA methylation in bovine SLOS and ART-LOS tissues. We observed unique patterns of global distribution of differentially methylated regions (DMRs) over different genomic contexts, such as promoters, CpG Islands, shores and shelves, as well as at repetitive sequences. In addition, we included data from two previous LOS studies to identify shared vulnerable genomic loci in LOS. Overall, we identified 320 genomic loci in LOS that have alterations in DNA methylation when compared to controls. Specifically, there are 25 highly vulnerable loci that could potentially serve as molecular markers for the diagnosis of LOS, including at the promoters of DMRT2 and TBX18, at the imprinted gene bodies of IGF2R, PRDM8, and BLCAP/NNAT, and at multiple CpG Islands. We also observed tissue-specific DNA methylation patterns between muscle and blood, and conservation of ART-induced DNA methylation changes between muscle and blood. We conclude that as ART-LOS, SLOS is an epigenetic condition. In addition, SLOS and ART-LOS share similarities in methylome epimutations.
Introduction
Large/abnormal offspring syndrome (LOS/AOS) is a congenital overgrowth syndrome that has been reported in ruminants [Citation1,Citation2]. Frequently observed features include macrosomia, macroglossia, umbilical hernia, organomegaly, placentomegaly, hydrallantois, increased gestation length, and increased dystocia rate [Citation3–13]. All of the bovine LOS reported in the literature have involved the use of in vitro production procedures (i.e in vitro maturation, fertilization and culture) or nuclear transfer (hereunto referred to as ART for assisted reproductive technologies) [Citation3–13]. ART is known to induce errors in the epigenome including DNA methylation and genomic imprinting to offspring in humans and ruminants [Citation14,Citation15]. We recently reported that LOS can occur spontaneously [Citation2,Citation16], a phenomenon that in some cases may have been incorrectly ascribed to the sire’s genetics [Citation17,Citation18]. Currently, there is a lack of documented incidence for both spontaneous LOS (SLOS) and ART associated LOS (ART-LOS) from the industry, although those experiencing them in their farm or practice incur steep financial losses [Citation2].
We and others have reported that ART-LOS is an epigenetic disorder [Citation19,Citation20] with global alterations of transcriptome and methylome, changes in chromosomal architecture, and loss-of-imprinting at multiple imprinted domains including IGF2R, KCNQ1, IGF2, PLAGL1, PEG3, and DLK1 [Citation3,Citation4,Citation19–25]. Although we recently documented that LOS occurs spontaneously, at least based on phenotypes [Citation2,Citation16], no data exist to demonstrate that the spontaneous overgrowth syndrome shares epigenotype with the ART-induced LOS.
Beckwith-Wiedemann syndrome (BWS, OMIM #130650) is the most common congenital overgrowth syndrome in humans. The incidence of BWS is approximately 1 in 10,340 live births and children conceived with the use of ART have a 10.7 relative risk of suffering from BWS [Citation26,Citation27]. Clinical features frequently observed in BWS include macrosomia, macroglossia, abdominal wall defects (umbilical hernia/exomphalos), lateralized overgrowth, increased tumour incidence, hyperinsulinism, facial naevus simplex, ear malformation, organomegaly, and placentomegaly [Citation28]. Molecular defects found in BWS include global alteration of transcriptome and methylome, changes of chromosomal architectures, loss-of-imprinting at imprinted domains including IGF2, KCNQ1, IGF2R, PLAGL1, PEG3, PEG10, GRB10, MEST, DLK1, IGF1R, and GNAS [Citation24,Citation28–34]. In addition, a subset of BWS are the result of secondary epimutations (genetic defects) which result in loss-of-imprinting [Citation35,Citation36]. We have shown that ART-LOS shares phenotypes and molecular aberrations with BWS [Citation24,Citation28].
Given the phenotypic similarities between the spontaneous and the ART-induced syndromes we hypothesized that SLOS has similar methylome epimutations as ART-LOS. In this study, we performed whole-genome bisulphite sequencing in bovine tissues of control, SLOS and ART-LOS to identify conserved signatures of this syndrome. In addition, we included data from two previous LOS studies to identify shared vulnerable genomic loci in LOS. Overall, we identified 320 genomic loci in LOS that have alterations in DNA methylation when compared to controls. Specifically, there are 25 highly vulnerable loci in LOS, including DMRT2, TBX18, IGF2R, PRDM8, and BLCAP/NNAT. We also observed tissue-specific DNA methylation patterns between muscle and blood, and conservation of ART-induced DNA methylation changes between muscle and blood. We conclude that as ART-LOS, SLOS is an epigenetic condition. In addition, SLOS and ART-LOS share similarities in methylome epimutations.
Results
Animal information and phenotypes
In total, 26 animals were included in this study and were assigned to different groups (). The US_Control group contains three AI conceived Holstein-breed neonate calves of average weight and with no clinical abnormalities and serves as control for other animals from the United States. The US_SLOS group contains eight SLOS calves found in the United States and the observable phenotypic abnormalities include macrosomia, macroglossia, and abdominal wall defects ( and ). The dam, sire, and sibling of US_SLOS_#6 showed no clinical abnormalities and are included for analyses to determine whether there exist inheritable methylation-specific causal effects of LOS or not.
Figure 1. Example of phenotypic abnormalities of SLOS and ART-LOS calves. (a) Abdominal wall defect of US_SLOS_#5 (Angus breed). This spontaneous LOS calf was born alive and had to be euthanized due to the body wall malformation. (b and c) Macrosomia and macroglossia of US_SLOS_#6 (Charolais breed). This stillborn calf was ~77 Kg at birth. The average weight for calves of this breed is ~ 36 Kg. (d and e) Macroglossia of ES_ART_#2 and of stillborn ES_RF_necropsy_#1 (Asturian Valley x Limousin crossbred), respectively.
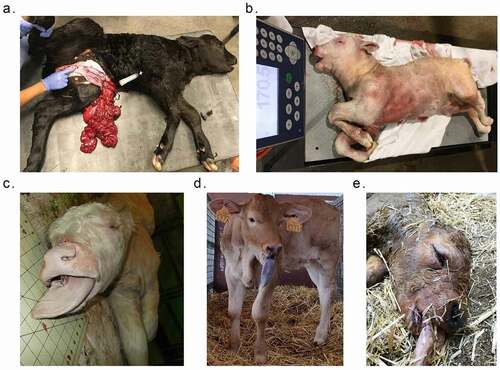
Table 1. Information of calves in this study. Sex with * = predicted sex based on WGBS reads alignment to chromosome Y (lack of sex information from original owners/sample providers). BW = birth weight. Used ID = animal ID used in previous publications.
The ES_Control group contains three AI conceived calves with no clinical abnormalities identified and serves as control for other animals from Spain. The ES_ART group contains four ART conceived calves with no clinical abnormalities except one had macroglossia (). The ES_RF group contains three calves conceived by ART supplemented reproductive fluids with one having some clinical abnormalities. Last, the ES_RF_necropsy group contains two dead calves from the ES_RF group with typical LOS clinical features.
Genomic context of differentially methylated regions in SLOS calves
Whole-genome bisulphite sequencing (WGBS) identified 2,839 differentially methylated regions (DMRs) in US_SLOS muscle samples when compared with US_Control muscle samples, namely US_SLOS_muscle_DMR, and ~ 66% of them were hypomethylated ( and Table S1. A). Hypomethylated DMRs showed significant enrichment for promoters, CpG Islands, CpG shores, and predicted CTCF binding sites than random distribution within the genome, but were depleted from gene bodies ()). Hypermethylated DMRs only showed significant depletion from CpG Islands. Of note, in this study we only included the promoters of protein coding genes and long non-coding RNAs (lncRNAs) since the location of promoters for small ncRNA are not well characterized in bovine [Citation37]. We also compared the DMRs identified here with those previously published for ART-LOS skeletal muscle and skin fibroblast cells [Citation19,Citation25] and identified an overlap of 22 and 134 DMRs, respectively (). Due to the lack of proper control samples for tongue and ear tissues, a separate comparison was conducted by combining US_SLOS muscle, ear, and tongue samples and compared them to US_Control muscle samples. Similar results were observed as the muscle comparison (Figure S1. A-C and Table S1.B).
Figure 2. Distribution of LOS associated differentially methylated regions (DMRs) across various genomic contexts. (a-c) Muscle US_SLOS vs. US_Control DMRs. (d-f) Muscle ES_RF_necropsy vs. ES_Control DMRs. (a-b and d-e) Each figure shows the total number of DMRs in the comparison and the number and percent of the hypermethylated (hyper; a and d) and hypomethylated (hypo; b and e) DMRs over each genomic context. In addition, the figures include the number and percent of DMRs that overlap with two previous studies (Li [Citation25] and Chen [Citation19]) for comparison purposes. (c and f) Percent of the genomic context that overlaps with DMRs. Obs = observed frequencies. Exp = expected frequencies (mean ± standard deviation; obtained from randomly shuffling DMRs across genome 10,000 times). The p values were calculated as p = n(|Exp – mean(Exp)| ≥ |Obs – mean(Exp)|)/10,000.
![Figure 2. Distribution of LOS associated differentially methylated regions (DMRs) across various genomic contexts. (a-c) Muscle US_SLOS vs. US_Control DMRs. (d-f) Muscle ES_RF_necropsy vs. ES_Control DMRs. (a-b and d-e) Each figure shows the total number of DMRs in the comparison and the number and percent of the hypermethylated (hyper; a and d) and hypomethylated (hypo; b and e) DMRs over each genomic context. In addition, the figures include the number and percent of DMRs that overlap with two previous studies (Li [Citation25] and Chen [Citation19]) for comparison purposes. (c and f) Percent of the genomic context that overlaps with DMRs. Obs = observed frequencies. Exp = expected frequencies (mean ± standard deviation; obtained from randomly shuffling DMRs across genome 10,000 times). The p values were calculated as p = n(|Exp – mean(Exp)| ≥ |Obs – mean(Exp)|)/10,000.](/cms/asset/d4299e45-fe8d-488e-93ce-afd412b93cc4/kepi_a_2067938_f0002_oc.jpg)
Genomic context of differentially methylated regions in ART-LOS calves
In total, 1,552 DMRs were identified in ES_RF_necropsy muscle samples when compared with ES_Control muscle, namely ES_RF_necropsy_muscle_DMR, and like US_SLOS_muscle_DMR, ~ 66% of DMRs were hypomethylated () and Table S1. C). These hypomethylated DMRs showed a significant enrichment for gene bodies which was different from US_SLOS results, and also enriched for CpG Islands, shores, and shelves (). Hypermethylated DMRs were significantly enriched for promoters, repetitive sequences, CpG shores, and shelves, and depleted from exons.
DNA methylation changes among different tissue, breeds, and developmental stages
In order to identify molecular markers for LOS, we searched for vulnerable loci regardless of direction of DNA methylation changes (i.e., hypomethylated or hypermethylated) when compared to controls. For this analysis we included four independent experiments, the above mentioned US_SLOS muscle and ES_RF_necropsy muscle, and our two previously published datasets, namely Li_LOS_fibroblast and Chen_LOS_muscle [Citation19,Citation25]. It should be noted that the raw data for the Chen_LOS_muscle experiment were reanalysed with methods described here. The enrichment of genomic context for DMRs identified in these two previously published datasets can be found in Figure S2. In total, four loci were found to be vulnerable in all four experiments, 21 loci were found in three of the four experiments, and 295 loci were found in two of the four experiments ( and Table S2). Overall, the vulnerable loci found in ≥3 experiments were enriched for CpG Islands and CpG shores (). The DNA methylation level and coverage for several of the LOS-associated vulnerable loci are illustrated in and Figures S3-S5.
Figure 3. Example of LOS-associated vulnerable loci. Hypo = hypomethylation. Hyper = hypermethylation. Differentially methylated regions (DMR) identifiers are the positions in the bovine genome assembly ARS-UCD1.2. For complete information please refer to Table S2.
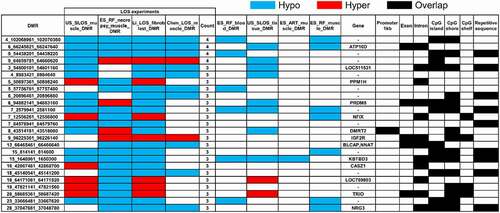
Figure 4. LOS-vulnerable loci around promoter regions. This figure shows DNA methylation level of vulnerable loci 7_2579941_2581100 (a), 8_43514181_43518080 (b), and 9_64659781_64660620 (c) in four LOS experiments. The aforementioned numbers refer to the chromosomes and genomic position in bovine genome assembly ARS-UCD1.2. Met% = group mean CpG methylation level in percent. Cov = group mean CpG read coverage. DMR = differentially methylated regions. Hyper = hypermethylation (red). Hypo = hypomethylation (yellow).
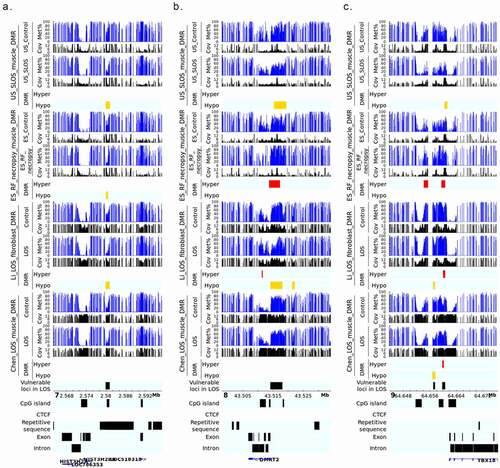
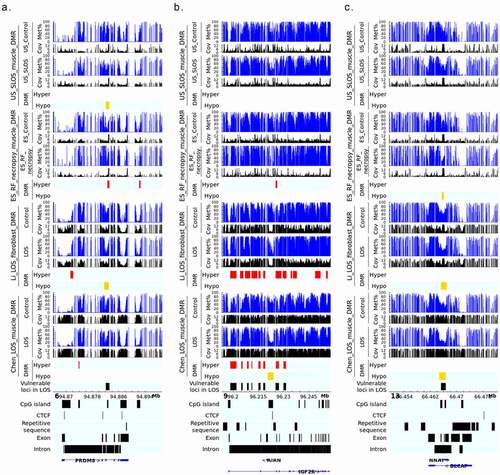
Figure 5. LOS-vulnerable loci overlapping CpG Islands in body of imprinted genes. This figure shows DNA methylation level of vulnerable loci 6_94882141_94883160 (a), 9_96225361_96226140 (b), and 13_66465461_66466640 (c) in four LOS experiments. The aforementioned numbers refer to the chromosomes and genomic position in bovine genome assembly ARS-UCD1.2. Met% = group mean CpG methylation level in percent. Cov = group mean CpG read coverage. DMR = differentially methylated regions. Hyper = hypermethylation (red). Hypo = hypomethylation (yellow).
The disruption of IGF2R imprinted domain has been frequently reported in LOS and BWS and we identified nine vulnerable loci within this domain ( and Table S2). However, although there is ~20% and ~40% reduction in DNA methylation levels in the imprinting control region (ICR) of IGF2R in the US_SLOS muscle and ES_RF_necropsy muscle, respectively (), hypomethylation is not reported for these samples because of the read coverage being lower than the cut-off used in this study. In addition to the imprinted genes shown in , several other imprinted genes known in bovine or other species overlap with vulnerable loci, including SGCE (4_12059801_12060360), PRKN (9_97743481_97744740), GNAS (13_57485061_57485680 and 13_57520861_57521040), KBTBD3 (15_1648961_1650300), TSHZ3 (18_41905361_41906000), HOXB3 (19_37915781_37915960 and 19_37922621_37923120), INPP5F (26_39936921_39938980), and KCNQ1 (29_48957301_48958880; Table S2). These loci mainly located within introns of imprinted genes, except that GNAS and HOXB3 also included their promoters.
A case study for DNA methylation at LOS-associated vulnerable loci in a SLOS calf, its sire, dam, and full-sibling
To determine each parent’s impact on LOS development, we conducted a case study for DNA methylation at LOS-associated vulnerable loci in US_SLOS_#6 and its sire, dam, and full-sibling. When comparing the level of DNA methylation in blood of the 25 highly vulnerable loci between the sire, dam, and full-sibling against the average of US_control blood samples, the dam showed a trend (p = 0.085; mean ± SD = −11.59 ± 19.23) of overall lower DNA methylation level than the sire (−3.09 ± 13.77; ). In addition, for all 320 LOS-vulnerable loci, this trend still exists between dam (−1.79 ± 17.17) and sire (0.47 ± 15.1; Figure S6). Due to the lack of comparable tissue samples and limited sample number, we only draw plots for visual examination of the trend of DNA methylation changes without statistical tests for individual vulnerable loci (). Nine loci showed differences (>10%) of DNA methylation in parental blood samples when compared to the mean of the control group, including one in sire only (), two in both the sire and dam (), and six in dam only (). The higher number of LOS-vulnerable loci with altered DNA methylation level in the dam than in the sire suggests a higher proportion of maternal contribution to the SLOS development in the US_SLOS_#6.
Figure 6. DNA methylation at the 25 highly vulnerable loci of LOS (≥ 3 experiments) in US_SLOS_#6 calf, its sire, dam, and full-sibling. (a) Violin plots with dots showing the difference of DNA methylation between examined individual/group (mean) and mean of US_Control for highly vulnerable loci in LOS (found in ≥3 LOS experiments). Each dot in the violin plot represents a vulnerable locus. P values were from t-test. The baseline for blood samples is US_Control blood and the baseline for muscle samples is US_Control muscle. (b-p) Box plots with dots show DNA methylation level (y-axis) at highly vulnerable loci without obvious differences (>10%) in parental blood samples (b-f), with obvious differences in sire only (g), both sire and dam (h-i), dam only (j-o), and sibling only (p) when compared to the mean of control group. Each dot in the box plot represents a sample.
Reproductive fluid supplementation partially improved methylome outcomes of ART
In total, 857 DMRs were found between ES_ART muscle and ES_Control muscle, namely ES_ART_muscle_DMR, with a bias (~84%) towards hypermethylation ( and Table S3. A). The hypermethylated DMRs showed significant enrichment for promoters, gene bodies, CpG Islands, shores, and shelves, and hypomethylated DMRs were enriched for CpG shores and shelves ().
Figure 7. Distribution of ART associated differentially methylated regions (DMRs) across various genomic contents. (a-c) Muscle ES_ART vs. ES_Control DMRs. (d-f) Muscle ES_RF vs. ES_Control DMRs. (a-b and d-e) Each figure shows the total number of DMRs in the comparison and the number and percent of the hypermethylated (hyper; a and d) and hypomethylated (hypo; b and e) DMRs over each genomic context. In addition, the figures include the number and percent of DMRs that overlap with two previous studies (Li [Citation25] and Chen [Citation19]) for comparison purposes. (c and f) Percent of the genomic context that overlaps with DMRs. Obs = observed frequencies. Exp = expected frequencies (mean ± standard deviation; obtained from randomly shuffling DMRs across genome 10,000 times). The p values were calculated as p = n(|Exp – mean(Exp)| ≥ |Obs – mean(Exp)|)/10,000.
![Figure 7. Distribution of ART associated differentially methylated regions (DMRs) across various genomic contents. (a-c) Muscle ES_ART vs. ES_Control DMRs. (d-f) Muscle ES_RF vs. ES_Control DMRs. (a-b and d-e) Each figure shows the total number of DMRs in the comparison and the number and percent of the hypermethylated (hyper; a and d) and hypomethylated (hypo; b and e) DMRs over each genomic context. In addition, the figures include the number and percent of DMRs that overlap with two previous studies (Li [Citation25] and Chen [Citation19]) for comparison purposes. (c and f) Percent of the genomic context that overlaps with DMRs. Obs = observed frequencies. Exp = expected frequencies (mean ± standard deviation; obtained from randomly shuffling DMRs across genome 10,000 times). The p values were calculated as p = n(|Exp – mean(Exp)| ≥ |Obs – mean(Exp)|)/10,000.](/cms/asset/f9e8b194-76cc-4bae-ae01-8a7c274a2891/kepi_a_2067938_f0007_oc.jpg)
The supplementation of reproductive fluids during ART resulted in 419 DMRs identified between ES_RF muscle and ES_Control muscle, namely ES_RF_muscle_DMR, with an equal ratio for hyper and hypomethylation ( and Table S3. B). Hypermethylated DMRs showed similar patterns of genomic context enrichment as ART groups. However, hypomethylated DMRs showed enrichment for CpG Islands, shores, shelves and gene bodies (). When comparing the DMRs between ES_ART_muscle_DMR and ES_RF_muscle_DMR, 62 were shared and had similar hypo or hypermethylation (Table S3. C).
Tissue specific DNA methylation pattern between muscle and leukocytes
Overall, the genome of muscle is hypomethylated when compared to leukocytes. There were a total of 25,466 and 9,961 DMRs between blood and muscle for US_Control and ES_Control, respectively, and ~90% of them were hypomethylated in muscle (Figure S7. A-F and Table S4. A-B). In addition, 5,169 DMRs were shared by these two different breeds of cattle and had similar direction of change in muscle (Table S4. C).
Conservation of ART induced DNA methylation between muscle and leukocytes
In total, 591 DMRs were identified when comparing ES_RF blood samples to ES_Control blood, namely ES_RF_blood_DMR, and ~88% of these DMRs show hypermethylation (Figure S8. A-C and Table S5. A). This pattern was not similar to ES_RF_muscle_DMR but resembled ES_ART_muscle_DMR (). When comparing the DMRs identified in ES_RF blood and muscle, 38 were found to be shared with 37 having the same direction in methylation change (Table S5. B). In addition, when comparing between ES_RF_blood_DMR and ES_ART_muscle_DMR, 16 DMRs were found to be shared and all had the same direction of DNA methylation (Table S5. C). Several LOS-vulnerable loci that show conserved DNA methylation changes between tissues in ES_RF group are illustrated in . Additionally, similar DNA methylation changes were observed for these DMRs in the blood sample of ES_ART_#2 which has macroglossia ().
Figure 8. Conservation of DNA methylation at LOS-vulnerable loci between muscle and blood in ES_RF group. Y-axis = DNA methylation level. Note: ES_ART_2 is the same animal as ).
Discussion
In this study, we observed typical LOS/AOS/BWS clinical abnormalities from SLOS calves, including macrosomia, macroglossia, and abdominal wall defects, and some atypical features. Spontaneous BWS (SBWS) shows no differences on the frequency of symptoms including macroglossia, hemihyperplasia, abdominal wall defects, hypoglycaemia, but a significantly higher frequency of ear malformation than ART-induced BWS (ART-BWS) [Citation33]. In addition, SBWS patients have significantly longer gestational age and heavier birth weight than ART-BWS [Citation33]. Studies with larger sample size are needed to draw conclusions for these types of frequencies for SLOS.
From the analyses of DMR distribution over various genomic contexts, we observed different preferences between LOS-associated hyper- and hypomethylated DMRs, and similarities and differences between SLOS and ART-LOS. As a regulatory element, CpG Islands and shores are enriched for enhancers in human, and the activity of enhancers is regulated by DNA methylation [Citation38,Citation39]. For both US_SLOS_muscle_DMR and ES_RF_necropsy_muscle_DMR, the observed frequencies at CpG Islands and shores are higher than expected, and with increased hypomethylation preference. This enrichment of hypomethylated DMRs over CpG shore resembles the observation of cancer-specific DMRs in human which are associated with cell proliferation and growth [Citation40]. It is well known that gene expression is negatively correlated with promoter DNA methylation level [Citation41]. Both US_SLOS_muscle_DMR and ES_RF_necropsy_muscle_DMR showed higher frequencies overlapping promoter regions than expected, but the former had increased hypomethylation. DNA methylation level of gene bodies reflects expression level [Citation42]. Interestingly, US_SLOS_muscle_DMR and ES_RF_necropsy_muscle_DMR showed opposite trend of hypomethylated DMR enrichment in gene body, which suggests differences in global gene expression level.
When comparing ES_ART_muscle_DMR and ES_RF_muscle_DMR, we found the supplementation of the culture medium with reproductive fluids largely reduced the number of hypermethylated DMRs caused by ART. However, only ~15% of the DMRs of ES_RF_muscle_DMR were shared with ES_ART_muscle_DMR, indicating the supplementation of reproductive fluids also induced new changes in the methylome, which we have previously reported [Citation43]. Next, when adding ES_RF_blood_DMR into this comparison, we found that although the distribution pattern of ES_RF_blood_DMR resembled ES_ART_muscle_DMR, ES_RF_blood_DMR still shared more DMRs with ES_RF_muscle_DMR instead of ES_ART_muscle_DMR. This indicates that the progenitors of muscle and blood have cell type-specific response to the supplementation of reproductive fluids. Nevertheless, the shared DMRs were very consistent in the direction of changes, which suggests that a proportion of identified DMRs could be used as diagnostic biomarkers in blood for muscle.
Several of the LOS-vulnerable loci were found close to the promoter of genes, including 7_2579941_2581100, 8_43514181_43518080, and 9_64659781_64660620. The frequently hypomethylated loci 7_2579941_2581100 resides in a region enriched for histone proteins including H2A.W histone (H2AW/HIST3H2A), H2B.U histone 1 (H2BU1/HIST3H2BB), and H3.4 histone (H3-4/LOC518318). However, the transcript level of these histone genes were barely detected from our previous RNA-seq results of fibroblast cells and muscle of ART-LOS foetuses [Citation20,Citation25], although that may be indicative of different developmental stages (d105 foetuses vs. newborn calves). 8_43514181_43518080 covers the promoter of protein coding gene doublesex and mab-3 related transcription factor 2 (DMRT2) and was detected both hypo- and hypermethylation in different experiments. DMRT2 is a polycomb associated transcription factor and is known to be regulated by promoter DNA methylation [Citation44,Citation45]. Interestingly, significant downregulation of DMRT2 transcript was reported in muscle of ART-LOS foetuses although no DNA methylation differences detected in the corresponding samples [Citation20]. 9_64659781_64660620 is one of the four most frequent LOS-vulnerable loci mainly showing hypermethylation and located close (1.3 kb) to the transcription start site of gene T-box transcription factor 18 (TBX18). As a critical transcription factor during embryo development in various tissues, TBX18 can also be regulated by promoter DNA methylation [Citation46,Citation47]. The downregulation of TBX18 transcript has been reported in muscle of ART-LOS foetuses [Citation20].
We have shown that ART-LOS, like BWS is a global loss-of-imprinting disorder. Several LOS-vulnerable loci were found within bodies of imprinted genes and overlapped with CpG Islands. 6_94882141_94883160 overlapped a CpG Island within the third intron of PR/SET domain 8 (PRDM8). PRDM8 is a histone methyltransferase and can inhibit cell proliferation through PI3K/AKT/mTOR signalling pathway thus functioning as a tumour suppressor [Citation48]. Although not completely confirmed, PRDM8 is considered as a candidate of imprinted genes and the predicted ICR in human located in its last exon [Citation49,Citation50]. The gene structure of PRDM8 is highly conserved between human and bovine, thus this locus’ overlapped CpG Island is not likely to be the ICR [Citation50]. Accordingly, PRDM8 was not found to be misregulated in fibroblast cells nor in muscle of ART-LOS foetuses [Citation20,Citation25]. The hypomethylated DMR 13_66465461_66466640 localizes within the second intron of imprinted gene BLCAP apoptosis inducing factor (BLCAP) and covers most of another imprinted gene neuronatin (NNAT) [Citation51]. BLCAP is known as a tumour suppressor through inducing cell cycle arrest and apoptosis [Citation52]. NNAT is a proteolipid that regulates calcium channels [Citation53]. Increased expression of NNAT is often found in tumour development, including the Wilms tumour of kidney, and associated with poor outcomes of patients [Citation53,Citation54]. Similarly, NNAT showed significant upregulation in both fibroblast cells and muscle of ART-LOS foetuses [Citation20,Citation25]. Interestingly, the proposed model of imprinting regulation in human at this locus relies on CTCF binding within the second intron of BLCAP [Citation54]. However, there is no putative CTCF binding sites predicted in bovine based on vertebrate CTCF motifs, which suggests either there is undiscovered unique motif in bovine, or the mechanism of regulation is not conserved in bovine.
As previously mentioned, IGF2R imprinted domain contains the highest number of LOS-vulnerable loci, which is nine. These hypermethylated loci in LOS are located within the first four introns of IGF2R surrounding (i.e., not including) the ICR. This ICR is the promoter of lncRNA AIRN and normally its methylated state on the maternal allele prevents AIRN’s expression and allows IGF2R expression [Citation55]. On the contrary, an unmethylated ICR on the paternal allele allows the expression of AIRN which silences IGF2R by attracting Polycomb repressive complexes to the locus [Citation56]. Hypomethylation of IGF2R ICR occurs frequently in LOS, but the low read coverage prevented us to include it in the list of vulnerable loci although we observed similar results regardless of coverage [Citation19,Citation57,Citation58]. Compared to Chen_LOS_muscle, the decreased read coverage at IGF2R ICR in the other three LOS experiments is likely caused by differences in the process of sequencing library preparation. Further studies are needed to determine the reasons of this inconsistency of sequencing results of this region. DNA methylation level of gene bodies is associated with transcription frequency in a parabolic pattern that the most highly and lowly expressed genes have low level of methylation but genes with intermediate level of expression have high methylation level [Citation42]. This pattern matches our observation for the hypermethylated DMRs in IGF2R gene body and IGF2R transcripts were downregulated in both fibroblast cells and muscle of ART-LOS foetuses [Citation20,Citation25]. For example, the IGF2R expression ranked 127 (top 0.7%) in the control group (~880 counts per million reads (cpm)) of fibroblast cells and decreased by ~3.5 folds to ~260 cpm in LOS group which ranked 581 (top 3%) [Citation25].
Among the four most frequently LOS-vulnerable loci, 6_66245821_66247640 is the only one located within a gene body that does not overlap with a CpG Island. This locus covers the 20th exon and surrounding 19th and 20th introns of ATPase phospholipid transporting 10D (ATP10D) gene and is hypomethylated in all four LOS experiments. ATP10D functions in the modulation of high density lipoprotein and is associated with susceptibility of obesity under high fat diet in mice studies [Citation59]. Our previous RNA-seq results did not show misregulation of ATP10D transcript in either fibroblast cells or muscle of LOS foetuses [Citation20,Citation25]. For the other two LOS-vulnerable loci found in four LOS experiments, namely 4_102068961_102070360 and 9_54438201_54439220, they always show hypomethylation at intergenic regions covering CpG Islands. Further studies are needed to determine whether these loci serve as remote regulatory elements for gene expression.
In human, although the hierarchical cluster analyses based on DNA methylation status at imprinted/non-imprinted genes cannot completely separate ART-BWS and SBWS groups, the two group still show different preferences of DNA methylation changes for imprinted domains including PEG10, MEST, GNAS, PLAGL1, and IGF2R [Citation32,Citation33]. Similarly, we also observed inconsistency of DNA methylation disruption between SLOS and ART-LOS at some imprinted domains, including NNAT and IGF2R. Additionally, SBWS is associated more with genetic defects including changes of chromosomal contents and gene mutations when compared to ART-BWS [Citation33]. Further studies on DNA sequencing of LOS are needed to investigate if there is a genetic contribution to the susceptibility of LOS/AOS development.
Finally, we did a comparison of the methylome of a SLOS, namely US_SLOS_#6, with its relatives (dam, sire, and full-sibling) to determine if the epimutations were inherited or occurred de novo in the offspring. We identified that some of the DMRs may have been inherited through the maternal or paternal genomes, although the dam seems to contribute more to the abnormal offspring’s methylome. While some of the differences detected may be breed specific, it appears that the abnormalities in the SLOS may be partly due to the higher number of epimutations inherited from the parents as its full-sibling was born healthy and of normal size, even though it shares some inherited epimutations.
In summary, unique patterns of distribution over different genomic contexts were observed for DMRs as a result of ART, reproductive fluid supplementation of culture media, ART-LOS, and SLOS. Hundreds of LOS-vulnerable loci determined in this study could serve as molecular markers for the diagnosis of LOS. Further studies are needed to determine the level of conservation of these DMRs in other tissue types of LOS foetuses that could be used for early diagnosis, such as amniotic fluid. In conclusion, alterations of epigenome are involved in the aetiology of SLOS with certain levels of similarities to ART induced LOS.
Materials and methods
All the chromosomal coordinates in this manuscript refer to bovine genome assembly ARS-UCD1.2 [Citation60].
Animal tissues
Blood and tissue samples of animals from the United States (US) and Spain (ES) were used in this study (). Control animals from the US (US_Control) were conceived by artificial insemination (AI) at the University of Missouri Foremost Dairy Research Center and sacrificed immediately upon birth by a trained Veterinarian for blood and tissue collection. The three Holstein breed neonates were male, of average birth weight and without any abnormal phenotypes. Blood samples were collected from the jugular vein using K3EDTA vacutainers (BD) and processed as described by Ortega et al. [Citation61]. Tissues were dissected, diced, sealed in aluminium foil pockets, snap frozen in liquid nitrogen, and stored at −80°C.
SLOS animals were from various parts of the US and were stillborn or died within several hours/days after birth (US_SLOS). Tissue samples of SLOS animals were collected from carcase by their owners, veterinarians, or our collaborators and shipped to University of Missouri and we do not have any information other than body weight, breed, sex (for most), and clinical features (for some). US_SLOS_#6 was processed by us and donated by a farmer from a nearby town so in this case we know that the stillborn calf had been conceived by natural service. We also collected blood samples of the dam, sire, and full-sibling of US_SLOS_#6 for methylome comparisons (i.e., case study).
Animals from Spain were generated as described previously [Citation62]. Briefly, the control animals (ES_Control) were conceived by AI using frozen-thawed semen from one bull (Asturian Valley breed) among synchronized cows (Holstein breed) on the day of presumptive oestrus. In vitro produced animals were generated using slaughterhouse oocytes (crossbred Limousin and Charolais) and semen from the same bull as controls. Following fertilization, embryos were separated in two different groups: one culture group (ES_ART) composed of synthetic oviductal fluid (SOF) media supplemented with bovine serum albumin during the 7–8 days of culture and another group (ES_RF) composed of SOF media supplemented with bovine oviductal fluid (NaturARTs-BOF-EL, Embryocloud, Spain) for the first 4 days and bovine uterine fluid (NaturARTs-BUF-ML, Embryocloud) for the following days. Embryos (blastocysts and expanded blastocysts) were vitrified on day 7 or 8 of culture and stored until use. Recipients (Holstein cows) were synchronized and on day 6 to 8 after presumptive oestrus, each cow received one thawed embryo. After parturition, calves were immediately assessed for general health parameters and continued to be monitored throughout their lives. Calves that did not survive parturition or died were collected for necropsy. Simultaneous blood and muscle samples were collected in two different days and calves’ age ranged between 71 and 292 days (mean age 167 days and median 138). Necropsy muscle samples do not have corresponding blood sample and the age of the calves varied between 0 (at birth) and 13 days (mean age 5 days and median 2). Blood samples were collected from the jugular or coccygeal vein (according to the size of the animal) using EDTA tube (BD vacutainer, BD, Spain) and stored at 4°C. Samples (less than 2 h after collection) were then aliquoted in 300 µL and 900 µL of Tris-HCl solution was added. The content was mixed and centrifuged at 14,500 x g for one minute and the supernatant discarded. The procedure was repeated twice more and the final pellet was submerged in liquid nitrogen and stored at −80°C. Muscle biopsies were performed using a semiautomatic needle (ML18160, RI.MOS., Italy). Surgical preparation prior biopsy included minor restraint of the animal, shaving of the area, cleaning, and application of local anaesthesia (lidocaine). The incision on the gluteus medius was ~1 cm long, enough for the biopsy needle to pass. Samples were immediately collected and placed on ice. The incision was closed, and calves were monitored for any sign of infection. Samples were transported to the laboratory (less than 2 h after collection), frozen in liquid nitrogen and stored at −80°C. Blood and muscle samples were shipped on dry ice to the University of Missouri.
Ethics approval
US_Control animals were purchased from the University of Missouri Foremost Dairy Research Center and euthanized by veterinarians. All the animal procedures were approved by University of Missouri Animal Care and Use Committee under protocol 9455.
Animals from Spain were handled by veterinarians following the Spanish Policy for Animal Protection RD 53/2013, which meets European Union Directive 2010/63/UE on animal protection. The Ethics Committee of Animal Experimentation of the University of Murcia and the Animal Production Service of the Agriculture Department of the Region of Murcia (Spain) (ref. no. A132141002) approved the procedures performed for these animals.
Genomic DNA extraction
Blood and tissue samples were lysed in lysis buffer (0.05 M Tris-HCl (pH 8.0), 0.1 M EDTA, and 0.5% (w/v) SDS) with proteinase K (Fisher BioReagents, BP1700) at 55°C for four hours (blood) or overnight (tissue). Genomic DNA was extracted with Phenol:Chloroform:Isoamyl Alcohol (SIGMA, P3803) following the manufacturer’s instructions. The concentration of DNA was measured by using a NanoDrop® ND-1000 Spectrophotometer (Thermo Fisher Scientific) and DNA integrity was confirmed by electrophoresis on a 0.7% agarose gel. Genomic DNA samples were stored at −20°C.
Whole genome bisulphite sequencing (WGBS) and data analyses
WGBS was conducted by CD Genomics (New York, United States). Information on library preparation and sequencing obtained from the company is as follows: For WGBS library preparation, 1 ug of genomic DNA was fragmented by sonication to a mean size of approximately 200–400 bp. Fragmented DNA was end-repaired, 5’-phosphorylated, 3’-dA-tailed and then ligated to methylated adapters. The methylated adapter-ligated DNAs were purified using 0.8× Agencourt AMPure XP magnetic beads and subjected to bisulphite conversion by ZYMO EZ DNA Methylation-Gold Kit (zymo). The converted DNAs were then amplified using 25 μl KAPA HiFi HotStart Uracil+ ReadyMix (2X) and 8-bp index primers with a final concentration of 1 μM each. The constructed WGBS libraries were then analysed by Agilent 2100 Bioanalyzer and quantified by a Qubit fluorometer with Quant-iT dsDNA HS Assay Kit (Invitrogen), and finally sequenced on Illumina Hiseq X ten sequencer. 0.1–1% lambda DNA were added during the library preparation to monitor bisulphite conversion rate.
For WGBS data analyses, duplicated reads generated during PCR and sequencing were removed from raw sequencing reads using the clumpify function of BBMap 38.90 [Citation63]. The remaining raw reads were trimmed for adapter sequences and low quality bases using trimmomatic 0.39 [Citation64] with parameters ‘ILLUMINACLIP:adapter_seq:2:30:10:1:true LEADING:20 TRAILING:20 AVGQUAL:20 MAXINFO:0:0.5.’ Trimmed reads were aligned to the bovine genome using bismark 0.23.0 [Citation65] with parameters ‘-X 900 – unmapped – ambiguous – non_bs_mm.’ Trimmed reads were also aligned to lambda phage genome to determine bisulphite conversion rates. Samtools 1.13 [Citation66] was used to convert, sort, filter, and index bam files. MarkDuplicates function of picard 2.25.5 [Citation67] was used to further remove duplicated reads after alignment. Read groups were added for each samples using AddOrReplaceReadGroups function of picard. The dataset of known variants in bovine, namely ARS1.2PlusY_BQSR_v3.vcf.gz, was acquired from the 1000 bull genome project [Citation68] and served as reference to identify genomic variants in WGBS data. Indel realignment was performed using RealignerTargetCreator and IndelRealigner functions of BisSNP 1.0.1 [Citation69]. Base quality recalibration was carried out using BisulfiteCountCovariates and BisulfiteTableRecalibration functions of BisSNP 0.82.2 since these functions are missing in version 1.0.0 and 1.0.1. Parameters used for BisulfiteCountCovariates were ‘-cov ReadGroupCovariate -cov QualityScoreCovariate -cov CycleCovariate -baqGOP 30.’ Genomic variants were identified using BisSNP 1.0.1 with default setting expect that ‘-bsRate’ was changed to bisulphite conversion rate observed from lambda phage genome alignment for each sample. BisSNP identified variants were filtered by its VCFpostprocess function with parameter ‘-windSizeForSNPfilter 0.’ Additionally, genomic variants were identified using BS-SNPer 1.0 [Citation70] with parameters ‘-minhetfreq 0.1 – minhomfreq 0.85 – minquali 15 – mincover 5 – maxcover 1000 – minread2 2 – errorate 0.02 – mapvalue 20.’ M-bias plots were generated using bismark and the first 3 bases of R1 reads and the first 4 bases of R2 reads showed biased CpG methylation level, thus these bases were excluded from downstream analyses. CpG methylation information were extracted from the bam files using bismark_methylation_extractor function of bismark with parameters ‘-p – ignore 3 – ignore_r2 4 – comprehensive – no_header – gzip – bedGraph – buffer_size 50% – cytosine_report.’ Statistical analyses were conducted using R package hummingbird [Citation71] with parameter ‘minCpGs = 10, minLength = 100, maxGap = 300’ to identify differentially methylated regions (DMRs) in various comparisons. DMRs with at least 15% difference in methylation level (both gain and loss of methylation) and at least 4 mean read coverage at CpG sites were reported. The sex chromosomes were not analysed to circumvent confounding created by X chromosome inactivation associated DNA methylation.
In addition, WGBS data from two of our previous LOS experiments were analysed with the same methods mentioned above [Citation19,Citation25]. The GEO accession numbers for these data are GSE93775 and GSE197130.
Analyses of overlapping between DMRs and genomic contents
Information of gene annotation was obtained from NCBI (GCF_002263795.1_ARS-UCD1.2_genomic.gff) [Citation72]. Repeated and overlapped exons were merged for each gene, and introns were calculated based on merged exons. Promoters (1kb) were calculated based on transcription start sites annotation and only included protein coding genes and long non-coding RNAs. Annotation of CpG Islands and repeated sequences were obtained from UCSC Genome Browser [Citation73]. Locations of CpG shores (flanking 2kb from CpG Islands) and shelves (flanking 2–4kb from the CpG Island) were calculated based on CpG Island annotation. Potential CTCF binding sites were predicted as previously reported [Citation25]. Bedtools and custom Perl scripts were used for these analyses to identify overlapped genomic location and make tables [Citation74]. R package Sushi, circular, and ggplot2 were used for making figures [Citation75–77].
Supplemental Material
Download Zip (15.9 MB)Acknowledgments
We thank Astrid Roshealy Brau for technical assistance and Dr. Darren Hagen, Dr. Callum Donnelly and Mr. Stephenson for providing pictures and samples. In addition, we would like to thank Dr. Dietrich Volkmann, Professor in Theriogenology, College of Veterinary Medicine, University of Missouri for recognizing the US_SLOS_#6 and arranging for us to collect the tissues and Dr. Fred Williams III for helping with the tissue collection and identification of malformations. We thank Dr. Rafael Latorre for aiding in biopsy collection and the Physiology of Reproduction group for support with the animals.
S equencing d ata a vailability statement
The raw sequencing reads of WGBS used in this study are available in the GEO database with accession numbers (GSE199084).
Disclosure statement
No potential conflict of interest was reported by the author(s).
Supplementary material
Supplemental data for this article can be accessed here
Additional information
Funding
References
- Farin PW, Piedrahita JA, Farin CE. Errors in development of fetuses and placentas from in vitro-produced bovine embryos. Theriogenology. 2006;65(1):178–191.
- Rivera RM, Donnelly CG, Patel BN, et al. Abnormal offspring syndrome. Bovine Reprod. 2021: 876–895
- Chen Z, Robbins KM, Wells KD, et al. Large offspring syndrome: a bovine model for the human loss-of-imprinting overgrowth syndrome Beckwith-Wiedemann. Epigenetics. 2013;8(6):591–601.
- Hori N, Nagai M, Hirayama M, et al. Aberrant CpG methylation of the imprinting control region KvDMR1 detected in assisted reproductive technology-produced calves and pathogenesis of large offspring syndrome. Anim Reprod Sci. 2010;122(3–4):303–312.
- Lazzari G, Wrenzycki C, Herrmann D, et al. Cellular and molecular deviations in bovine in vitro-produced embryos are related to the large offspring syndrome. Biol Reprod. 2002;67(3):767–775.
- Behboodi E, Anderson GB, BonDurant RH, et al. Birth of large calves that developed from in vitro-derived bovine embryos. Theriogenology. 1995;44(2):227–232.
- Farin PW, Farin CE. Transfer of bovine embryos produced in vivo or in vitro: survival and fetal development. Biol Reprod. 1995;52(3):676–682.
- McEvoy TG, Sinclair KD, Broadbent PJ, et al. Post-natal growth and development of Simmental calves derived from in vivo or in vitro embryos. Reprod Fertil Develop. 1998;10(6):459–464.
- Farin PW, Crosier AE, Farin CE. Influence of in vitro systems on embryo survival and fetal development in cattle. Theriogenology. 2001;55(1):151–170.
- Hasler JF, Henderson WB, Hurtgen PJ, et al. Production, freezing and transfer of bovine IVF embryos and subsequent calving results. Theriogenology. 1995;43(1):141–152.
- van Wagtendonk-de Leeuw AM, Aerts BJ, den Daas JH. Abnormal offspring following in vitro production of bovine preimplantation embryos: a field study. Theriogenology. 1998;49(5):883–894.
- Sinclair KD, Broadbent PJ, Dolman DF. In vitro produced embryos as a means of achieving pregnancy and improving productivity in beef cows. Anim Sci. 1995;60(1):55–64
- Kruip TA, Den Daas JHG. In vitro produced and cloned embryos: effects on pregnancy, parturition and offspring. Theriogenology. 1997;47(1):43–52.
- Fauser BC, Devroey P, Diedrich K, et al. Health outcomes of children born after IVF/ICSI: a review of current expert opinion and literature. Reprod Biomed Online. 2014;28(2):162–182.
- Urrego R, Rodriguez-Osorio N, Niemann H. Epigenetic disorders and altered gene expression after use of assisted reproductive technologies in domestic cattle. Epigenetics. 2014;9(6):803–815.
- Li Y, Donnelly CG, Rivera RM. Overgrowth syndrome. Vet Clin Food Anim Pract. 2019;35:265–276.
- Thompson JG, Allen NW, McGowan LT, et al. Effect of delayed supplementation of fetal calf serum to culture medium on bovine embryo development in vitro and following transfer. Theriogenology. 1998;49(6):1239–1249.
- Coleman L, Back P, Blair H, et al. Sire effects on birth weight, gestation length, and pre-weaning growth of beef-cross-dairy calves: a case study in New Zealand. Dairy. 2021;2(3):385–395.
- Chen Z, Hagen DE, Ji T, et al. Global misregulation of genes largely uncoupled to DNA methylome epimutations characterizes a congenital overgrowth syndrome. Sci Rep. 2017;7(1):12667.
- Chen Z, Hagen DE, Elsik CG, et al. Characterization of global loss of imprinting in fetal overgrowth syndrome induced by assisted reproduction. Proc Natl Acad Sci U S A. 2015;112(15):4618–4623.
- Sangalli JR, Chiaratti MR, De Bem THC, et al. Development to term of cloned cattle derived from donor cells treated with valproic acid. PLoS One. 2014;9(6):e101022.
- Su J, Wang Y, Liu Q, et al. Aberrant mRNA expression and DNA methylation levels of imprinted genes in cloned transgenic calves that died of large offspring syndrome. Livestock Sci. 2011;141(1):24–35.
- Su H, Li D, Hou X, et al. Molecular structure of bovine Gtl2 gene and DNA methylation status of Dlk1-Gtl2 imprinted domain in cloned bovines. Anim Reprod Sci. 2011;127(1–2):23–30.
- Li Y, Hagen DE, Ji T, et al. Altered microRNA expression profiles in large offspring syndrome and Beckwith-Wiedemann syndrome. Epigenetics. 2019;14(9) ;850–876.
- Li Y, Boadu F, Highsmith M, et al. Allele-specific aberration of imprinted domain chromosome architecture associates with large offspring syndrome. iScience. 2022; In press.
- Mussa A, Molinatto C, Cerrato F, et al. Assisted reproductive techniques and risk of beckwith-wiedemann syndrome. Pediatrics. 2017;140(1).
- Mussa A, Russo S, De Crescenzo A, et al. Prevalence of Beckwith–Wiedemann syndrome in north west of Italy. Am J Med Genet Part A. 2013;161:2481–2486.
- Brioude F, Kalish JM, Mussa A, et al. Expert consensus document: clinical and molecular diagnosis, screening and management of Beckwith–Wiedemann syndrome: an international consensus statement. Nat Rev Endocrinol. 2018;14(4):229–249.
- Krzyzewska IM, Alders M, Maas SM, et al. Genome-wide methylation profiling of Beckwith-Wiedemann syndrome patients without molecular confirmation after routine diagnostics. Clin Epigenetics. 2019;11(11):53.
- Rovina D, La Vecchia M, Cortesi A, et al. Profound alterations of the chromatin architecture at chromosome 11p15. 5 in cells from Beckwith-Wiedemann and Silver-Russell syndromes patients. Sci Rep. 2020;10:1–19.
- Naveh NSS, Deegan DF, Huhn J, et al. The role of CTCF in the organization of the centromeric 11p15 imprinted domain interactome. Nucleic Acids Res. 2021;49(11):6315–6330.
- Tee L, Lim DH, Dias RP, et al. Epimutation profiling in Beckwith-Wiedemann syndrome: relationship with assisted reproductive technology. Clin Epigenetics. 2013;5(1):1–10.
- Tenorio J, Romanelli V, Martin‐Trujillo A, et al. Clinical and molecular analyses of Beckwith–Wiedemann syndrome: comparison between spontaneous conception and assisted reproduction techniques. Am J Med Genet Part A. 2016;170(10):2740–2749.
- Rossignol S, Steunou V, Chalas C, et al. The epigenetic imprinting defect of patients with Beckwith—Wiedemann syndrome born after assisted reproductive technology is not restricted to the 11p15 region. J Med Genet. 2006;43(12):902–907.
- Cooper WN, Luharia A, Evans GA, et al. Molecular subtypes and phenotypic expression of Beckwith–Wiedemann syndrome. Eur J Hum Genet. 2005;13(9):1025.
- Mussa A, Russo S, De Crescenzo A, et al. (Epi) genotype–phenotype correlations in Beckwith–Wiedemann syndrome. Eur J Hum Genet. 2016;24(2):183.
- Li T, Zhou X, Wang X, et al. Identification and characterization of human snoRNA core promoters. Genomics. 2010;96(1):50–56.
- Moran S, Arribas C, Esteller M. Validation of a DNA methylation microarray for 850,000 CpG sites of the human genome enriched in enhancer sequences. Epigenomics. 2016;8(3):389–399.
- Plank JL, Dean A. Enhancer function: mechanistic and genome-wide insights come together. Mol Cell. 2014;55(1):5–14.
- Irizarry RA, Ladd-Acosta C, Wen B, et al. Genome-wide methylation analysis of human colon cancer reveals similar hypo-and hypermethylation at conserved tissue-specific CpG Island shores. Nat Genet. 2009;41(2):178.
- Vincent A, Omura N, Hong S-M, et al. Genome-wide analysis of promoter methylation associated with gene expression profile in pancreatic adenocarcinoma. Clin Cancer Res. 2011;17(13):4341–4354.
- Jjingo D, Conley AB, Soojin VY, et al. On the presence and role of human gene-body DNA methylation. Oncotarget. 2012;3(4):462.
- Canovas S, Ivanova E, Romar R, et al. DNA methylation and gene expression changes derived from assisted reproductive technologies can be decreased by reproductive fluids. Elife. 2017;6:e23670.
- Renner M, Wolf T, Meyer H, et al. Integrative DNA methylation and gene expression analysis in high-grade soft tissue sarcomas. Genome Biol. 2013;14(12):1–26.
- Daino K, Nishimura M, Imaoka T, et al. Epigenetic dysregulation of key developmental genes in radiation‐induced rat mammary carcinomas. Int J Cancer. 2018;143(2):343–354.
- Christoffels VM, Grieskamp T, Norden J, et al. Tbx18 and the fate of epicardial progenitors. Nature. 2009;458(7240):E8–9.
- Haraguchi R, Kitazawa R, Kitazawa S. Epigenetic regulation of Tbx18 gene expression during endochondral bone formation. Cell Tissue Res. 2015;359(2):503–512.
- Chen Z, Gao W, Pu L, et al. PRDM8 exhibits antitumor activities toward hepatocellular carcinoma by targeting NAP1L1. Hepatology. 2018;68(3):994–1009.
- Daelemans C, Ritchie ME, Smits G, et al. High-throughput analysis of candidate imprinted genes and allele-specific gene expression in the human term placenta. BMC Genet. 2010;11(1):1–20.
- Bina M. Discovering candidate imprinted genes and imprinting control regions in the human genome. BMC Genomics. 2020;21(1):1–16.
- Schulz R, McCole RB, Woodfine K, et al. Transcript-and tissue-specific imprinting of a tumour suppressor gene. Hum Mol Genet. 2009;18(1):118–127.
- Yao J, Duan L, Fan M, et al. Overexpression of BLCAP induces S phase arrest and apoptosis independent of p53 and NF-κB in human tongue carcinoma. Mol Cell Biochem. 2007;297(1–2):81–92.
- Nass N, Walter S, Jechorek D, et al. High neuronatin (NNAT) expression is associated with poor outcome in breast cancer. Virchows Arch. 2017;471(1):23–30.
- Hubertus J, Zitzmann F, Trippel F, et al. Selective methylation of CpGs at regulatory binding sites controls NNAT expression in Wilms tumors. PLoS One. 2013;8(6):e67605.
- Sleutels F, Zwart R, Barlow DP. The non-coding Air RNA is required for silencing autosomal imprinted genes. Nature. 2002;415(6873):810–813.
- Schertzer MD, Braceros KC, Starmer J, et al. lncRNA-induced spread of polycomb controlled by genome architecture, RNA abundance, and CpG Island DNA. Mol Cell. 2019;75(3):523–537. e10.
- Young LE, Fernandes K, McEvoy TG, et al. Epigenetic change in IGF2R is associated with fetal overgrowth after sheep embryo culture. Nat Genet. 2001;27(2):153.
- Smith LC, Therrien J, Filion F, et al. Epigenetic consequences of artificial reproductive technologies to the bovine imprinted genes SNRPN, H19/IGF2, and IGF2R. Front Genet. 2015;6:58.
- Sigruener A, Wolfrum C, Boettcher A, et al. Lipidomic and metabolic changes in the P4-type ATPase ATP10D deficient C57BL/6J wild type mice upon rescue of ATP10D function. PLoS One. 2017;12(5):e0178368.
- Rosen BD, Bickhart DM, Schnabel RD, et al. De novo assembly of the cattle reference genome with single-molecule sequencing. Gigascience. 2020;9(3):giaa021.
- Ortega MS, Moraes JG, Patterson DJ, et al. Influences of sire conception rate on pregnancy establishment in dairy cattle. Biol Reprod. 2018;99(6):1244–1254.
- Lopes JS, Alcázar-Triviño E, Soriano-Úbeda C, et al. Reproductive outcomes and endocrine profile in artificially inseminated versus embryo transferred cows. Animals. 2020;10(8):1359.
- Bushnell B. BBMap. Accessed 24/5/2021. https://sourceforge.net/projects/bbmap/
- Bolger AM, Lohse M, Usadel B. Trimmomatic: a flexible trimmer for Illumina sequence data. Bioinformatics. 2014;30(15):2114–2120.
- Krueger F, Andrews SR. Bismark: a flexible aligner and methylation caller for Bisulfite-Seq applications. bioinformatics. 2011;27(11):1571–1572.
- Li H, Handsaker B, Wysoker A, et al. The sequence alignment/map format and SAMtools. Bioinformatics. 2009;25(16):2078–2079.
- Broad Institute. Picard toolkit. Broad Institute, GitHub Repository. Accessed 24/5/2021. http://broadinstitute.github.io/picard/
- Hayes BJ, Daetwyler HD. 1000 bull genomes project to map simple and complex genetic traits in cattle: applications and outcomes. Annu Rev Anim Biosci. 2019;7(1):89–102.
- Liu Y, Siegmund KD, Laird PW, et al. Bis-SNP: combined DNA methylation and SNP calling for Bisulfite-seq data. Genome Biol. 2012;13(7):R61.
- Gao S, Zou D, Mao L, et al. BS-SNPer: SNP calling in bisulfite-seq data. Bioinformatics. 2015;31(24):4006–4008.
- Ji T. A Bayesian hidden Markov model for detecting differentially methylated regions. Biometrics. 2019;75(2):663–673.
- O’Leary NA, Wright MW, Brister JR, et al. Reference sequence (RefSeq) database at NCBI: current status, taxonomic expansion, and functional annotation. Nucleic Acids Res. 2016;44(D1):D733–45.
- Kent WJ, Sugnet CW, Furey TS, et al. The human genome browser at UCSC. Genome Res. 2002;12(6):996–1006.
- Quinlan AR, Hall IM. BEDTools: a flexible suite of utilities for comparing genomic features. Bioinformatics. 2010;26(6):841–842.
- Wickham H. ggplot2. Wiley Interdiscip Rev Comput Stat. 2011;3(2):180–185.
- Lund U, Agostinelli C, Agostinelli MC. Package ‘circular.’ Repos CRAN. 2017.
- Phanstiel DH, Boyle AP, Araya CL, et al. Sushi R: flexible, quantitative and integrative genomic visualizations for publication-quality multi-panel figures. Bioinformatics. 2014;30(30):2808–2810.