
ABSTRACT
Gestational diabetes mellitus (GDM) increases the risk of developing metabolic disorders in both pregnant women and their offspring. Factors such as nutrition or the intrauterine environment may play an important role, through epigenetic mechanisms, in the development of GDM. The aim of this work is to identify epigenetic marks involved in the mechanisms or pathways related to gestational diabetes. A total of 32 pregnant women were selected, 16 of them with GDM and 16 non-GDM. DNA methylation pattern was obtained from Illumina Methylation Epic BeadChip, from peripheral blood samples at the diagnostic visit (26–28 weeks). Differential methylated positions (DMPs) were extracted using ChAMP and limma package in R 2.9.10, with a threshold of FDR <0.05, deltabeta >|5|% and B >0. A total of 1.141 DMPs were found, and 714 were annotated in genes. A functional analysis was performed, and we found 23 genes significantly related to carbohydrate metabolism. Finally, a total of 27 DMPs were correlated with biochemical variables such as glucose levels at different points of oral glucose tolerance test, fasting glucose, cholesterol, HOMAIR and HbA1c, at different visits during pregnancy and postpartum. Our results show that there is a differentiated methylation pattern between GDM and non-GDM. Furthermore, the genes annotated to the DMPs could be implicated in the development of GDM as well as in alterations in related metabolic variables.
Background
GDM is defined as a carbohydrate intolerance with onset during pregnancy [Citation1]. GDM can increase the risk of prematurity, C-section delivery, preeclampsia, the long-term risk of type 2 diabetes mellitus (T2DM), metabolic syndrome, renal disease and cardiovascular disease (CVD). Furthermore, offspring from women with GDM have an increased risk of foetal macrosomia, higher infant fat mass and long-term obesity [Citation2]. Globally, the prevalence of GDM varies depending on the country and the diagnostic criteria, ranging from 1% to 31% [Citation3]. In Europe, the prevalence ranges from 1.5% in Sweden to 10% in Italy [Citation4,Citation5]. Obesity, increasing reproductive age of women, sedentary lifestyle, and environmental factors are some of the principal risk factors for developing GDM [Citation6].
During normal pregnancy, beta-cells secrete more insulin to compensate and maintain normal glucose levels, due to the insulin resistance, especially at the end of the gestation. However, in GDM, certain alterations exist that produce reduced insulin sensitivity and impaired insulin secretion [Citation7], developing carbohydrate intolerance. The molecular mechanisms that produce these alterations are still unknown. GDM development is influenced by genetic, epigenetic, and environmental factors [Citation8–11]. Epigenetics is the link between genetics and the environment, and it could explain how environmental factors affect the development of diseases. There are different epigenetic mechanisms involved such as histone modification, DNA methylation and some authors have also included non-coding RNAs. DNA methylation is the most extensively studied, and it consists of the addition of a methyl group to the five positions of cytosine residues [Citation12]. There are different techniques to study DNA methylation, but one of the best ways to have a global view of methylation is with an epigenome-wide association study (EWAS), performing methylation arrays.
A few EWAS studies on GDM have been reported with different approaches such as the epigenetic changes in cord blood and the effect on the offspring and epigenetic patterns on the foetus-placental endothelium [Citation13–15]. However, there are not many epigenetic studies on blood samples of mothers with GDM. According to an epigenetic study in peripheral blood in GDM vs non-GDM pregnancies, it has been revealed that five of the most differentiated methylated CpG in the following genes, Solute Carrier Family 9 Member A3 (SLC9A3), Male-Enhanced Antigen 1 (MEA1), Kelch Domain Containing 3 (KLHDC3) and Calmodulin Binding Transcription Activator 1 (CAMTA1) were correlated to glucose levels and fasting insulin in the first visit (at 23 weeks of pregnancy) [Citation10]. Another study on peripheral blood of GDM vs. non-GDM presented five CpGs within COP9 signalosome Subunit 8 (COPS8), Phosphoinositide-3-Kinase Regulatory (PIK3R), 3-Hydroxyanthranilate 3,4- Dioxygenase (HAAO), Coiled-Coil Domain Containing 124 (CCDC124) and Chromosome 5 Open Reading Frame 34 (C5orf34) with biomarker potential for early therapeutic intervention [Citation16]. Also, a recent study in peripheral blood identified three CpGs in Long Intergenic Non-Protein Coding RNA 917 (LINC00917), Trafficking Protein Particle Complex Subunit 9 (TRAPPC9) and Lymphoid Enhancer Binding Factor 1 (LEF1) genes, respectively, that may be implicated in the development of GDM and postpartum abnormal glucose tolerance [Citation17].
In this study, we have compared by EWAS the epigenome of GDM vs non-GDM women in the moment of the diagnosis and studied the association with clinical variables related to diabetes in an attempt to elucidate the molecular mechanisms of the development of gestational diabetes.
Methodology
Subjects
The participants of this study are part of the EPI_DG study, which started at the beginning of 2019. The recruitment was done in the Diabetes and Pregnancy Unit at the University Hospital Virgen de la Victoria, Málaga, Spain. The inclusion criteria were age 18–45 years, singleton pregnancy and being in the second or third trimester of pregnancy. The existence of a GDM diagnosis at <14 weeks of pregnancy and multiple pregnancy were exclusion criteria. All the participants were of Caucasian Mediterranean ethnicity.
Sixteen GDM pregnant women and 16 non-GDM pregnant women (controls) were studied. The GDM diagnosis was made according to the National Diabetes Data Group NDDG criteria in two-step screening [Citation18]: firstly, an O’Sullivan test (50 g glucose overload) was performed in primary care centres. If post-load glucose was ≥7.8 mmol/L, women were referred to our Diabetes and Pregnancy Unit for performing the 100 gr oral glucose tolerance test (OGTT-100 g). GDM was diagnosed if glucose values were higher than the threshold, at least in two points: fasting >5.8 mmol/l (OGTT0.0), after 1 h >10.6 mmol/l (OGTT60.0), after 2 h >9.2 mmol/L (OGTT120.0), and after 3 h >8.0 mmol/l (OGTT180.0). Pregnant women with normal OGTT-100 were considered as controls.
The study protocol includes a baseline visit (at the moment of performance of 100 gr OGTT, at 24–29 weeks of pregnancy; T0), a pre-labour visit (at 36–37 weeks of pregnancy; T1), and a pos-labour visit (8 weeks after birth; T2), all of them at our Diabetes and Pregnancy Unit. Height was measured at T0, and weight and blood pressure (BP) were measured at every visit, according to standardized procedures. At T0, we collected data regarding pre-pregnancy weight to calculate ‘pre-pregnant body mass index (BMI)’ as weight (kg)/height2 (m2). Weight gain was calculated as the difference between the weight at T1 and at T0.
At T2, we collected anthropometric data—weight, length, and head circumference— from the digital medical history of newborns (these parameters were measured by the neonatologist during the first evaluation of newborns according to local protocols and compiled at the medical history).
Samples
Peripheral blood samples were collected at three different times: T0 during the diagnostic visit (24–29 weeks); T1 pre-labour visit (37–38 weeks) and T2 post-birth visit (8 weeks after birth). The 75 gr OGTT at T2 (OGTT.2), measuring fasting glucose (OGTT0.2) and 2 h postload glucose (OGTT120.2), was only performed in the GDM group to test these women for prediabetes or diabetes according to ADA recommendation [Citation19]. Blood and serum were stored at −80ºC until the analysis.
Biochemical analysis
Glucose was measured by the oxidase method (Bayer, Leverkusen, Germany). Insulin levels were measured by a radioimmunoassay method using BioSource International Inc. (Camarillo, CA, USA). We calculated the homoeostasis model assessment of insulin resistance index (HOMA-IR) as described by Matthews et al. [Citation20]. Serum 25(OH)D levels were determined by the Enzyme-Linked ImmunoAssay (ELISA) kit (Immundiagnostik, Bensheim, Germany). Cholesterol, triglycerides, and HDL were measured using commercial enzymatic methods. The blood pressure was measured twice with a sphygmomanometer with an interval of 5 min between measurements and the average of the two measurements was used in the analyses.
DNA isolation and bisulphite conversion
DNA was isolated using QIAamp DNA Blood Mini Kit (Qiagen, Hilden, Germany) according to the manufacturer’s instructions. Quality and concentration of DNA were measured using Qubit 3.0 Fluorometer with Qubit dsDNA HS Assay Kit Fluorometer (Thermo Fisher Scientific, Waltham, MA, USA). A total of 500 ng of genomic DNA from T0 was bisulphite treated with Epitect Bisulphite Kit (Qiagen, Germany) for posterior DNA methylation analysis.
Epigenome-wide DNA methylation
DNA methylation was tested using the Infinium Mehylation EPIC BeadChip Kit. R statistical software (https://www.rstudio.com/) was used to extract the data, using ChAMP package version 2.9.10 [Citation21]. The probes were deleted using the following threshold: a detection p-value above 0.01 in one or more samples, with a bead count less than 3 in at least 5% of the samples, probes non-cpg and probes with SNPs [Citation22,Citation23]. Intra-cell type normalization was done using the beta-mixture quantile normalization (BMIQ) method. Houseman correction was used to correct the differences in methylation resulting from differences in cellular heterogeneity [Citation24]. Finally, inflation levels were calculated with RaMWas package in R studio.
Methylation data analysis
β-values and M-values were calculated to obtain the methylation levels. M-values are a logical transformation of β-value, and they were used to obtain the differentially methylated positions (DMPs) by performing an eBayes moderated t-statistic with limma package in R statistical software. β-value is the estimate of the methylation level using the ratio of the methylation probe intensity and the overall intensity. The DMPs were filtered using the False Discovery Ratio (FDR) <0.05, the difference of β level between groups (deltaβ) higher than 5% in absolute terms, and the log odds that the CpG site is deferentially methylated (B) higher than 0. The models were adjusted by variables previously associated with GDM such as age, pre-pregnant BMI, foetal sex, weight gain, gestational age, and HOMAIR [Citation25].
Functional analysis
A functional enrichment analysis was performed looking for the potential mechanism that may be altered in GDM compared with non-GDM. Once we obtained the DMPs with annotated genes, a gene ontology (GO) and Kyoto encyclopaedia of genes and genomes (KEGG) were performed. GO terms and KEGG pathways were obtained using Missmethyl package in R software. In addition, a String net (https://string-db.org/) was performed to identify protein–protein interactions (PPI). The significant threshold was an interaction score >0.7 and FDR <0.05. Clustering was performed in Cytoscape (https://cytoscape.org/) with MCODE app. Finally, each cluster was analysed by DAVID (https://david.ncifcrf.gov/summary.jsp) to identify the potential function.
Statistical analysis
Due to the small sample size and the fact that some variables did not show a normal distribution, non-parametric tests were used to compare quantitative variables and for correlation analysis. R software (4.0.4) was used to study the differences in clinical and biochemical variables using the U-Mann Whitney test. A correlation analysis by spearman test was performed between methylation levels and biochemical variables. Genes with more than 1 DMP, and those genes related with carbohydrate metabolism function in the functional analysis were chosen for this analysis. The correlation was made with clinical variables at different times (T0, T1 and T2). The correlation matrix was obtained and represented with the package GGally in R studio (4.0.4), and the threshold was r > 0.5 and p < 0.05.
Results
Clinical characteristic of the subjects
The characteristics of the subjects are represented in . Both groups were matched by age, gestational age, and pre-pregnancy BMI. The control group showed higher weight gain during pregnancy compared with GDM. The rest of the variables were not statistically different between groups. In the GDM group, after diet and exercise recommendation, six pregnant women required additional pharmacological treatment (insulin).
Table 1. Clinical characteristic of the subject included in the study.
Differential methylation analysis
A total of 1.141 differentially methylated positions (DMPs) were found comparing GDM vs. non-GDM, with a threshold of FDR <0.05, deltaβ >|0.5|, and B ≥0. Slight level of inflation was found in our EWAS (λ = 1.136) (Supplementary fig. S1). The PCA analysis shown in represents the two populations. As shown in , cg13824270 in pre-mRNA processing factor 4B (PRPF4B) gene, cg20409752 in CAMTA1 and cg050373962 are the most hypomethylated, and cg04248279 in rabphilin 3A like (RPH3AL) gene, cg20758759 in non-annotated gene, cg02518222 in hydroxysteroid 17-beta dehydrogenase 11 (HSD17B11) gene are the most hypermethylated (Supplementary table S1).
Figure 1. a) Principal component analysis between GDM (blue, cluster 2) and non-GDM (Red, cluster 1) b) Volcano plot, green: CpGs most hypometylated, red: most hypermethylated, blue: non-significant. c) DMPs according with feature position in the gene d) DMPs according with island position (Cgi position).
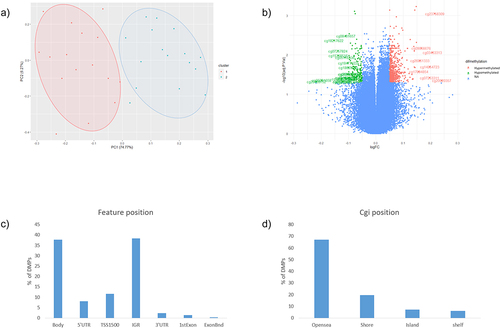
According to the position of the CpGs respecting the gene (feature position), 36% are located in the body, 37% in the intergenic region (IGR), around 20% in the promoters area (transcription start site (TSS) 1500 1500, 5’UTR, and TSS200) and the rest are in the beginning of the exon and in 3’UTR (). Related to the cgi position, most of the DMPs were in the Open sea position (67%). The rest of the DMPs were in shore (19%), island (7%) and shelf (7%) positions, respectively ().
Functional enrichment analysis
In order to understand what potential mechanisms are involved in GDM, a functional enrichment analysis was performed. First, a gene ontology (GO) and a Kyoto encyclopaedia of genes and genomes (KEGG) analyses were performed in all the CpGs with genes annotated (714). The most significant GO terms are represented in . Among the significant GO, we identified the following mechanisms: the regulation of insulin secretion, cellular response to amino acid stimulus and response to nutrient levels. KEGG analysis showed that the most significant pathways were the insulin signalling pathway, growth hormone synthesis, ErbB signalling pathway, and T2DM ().
Figure 2. a) GO terms most enrichment pval<0.01 b) KEGG pathways most enriched. c)String net PPI (p-value<1.0e-16) with 23 genes related to glucose metabolism.
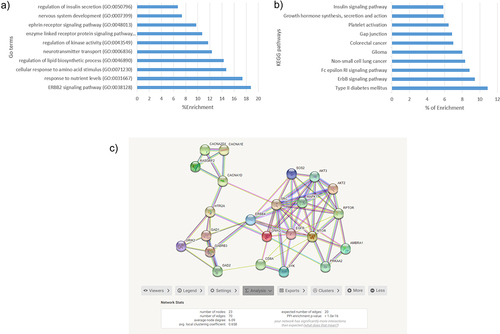
In addition, a String net was performed in genes annotated (714) to identify protein–protein interactions (PPI) and their related mechanisms. The resulting net was clustered in Cytoscape using MCODE app and analysed in DAVID. As shown in , a total of 15 clusters were defined using the default values of MCODE app. The three most significant (enrichment p-value <1e-16) clusters were related to carbohydrate metabolism pathways: positive regulation of glycolytic process, MAPK signalling pathway, insulin pathway, cellular response to nutrient levels, type 1 diabetes, T2DM, and insulin resistance. A total of 23 of our annotated genes were included in these clusters, and there was also interaction between them.
Correlation analysis
Within the top 100 DMPs, genes with more than one DMP and those genes related with carbohydrate metabolism according to our enrichment analysis were selected to perform a correlation analysis with the biochemical variables at different times T0, T1, and T2. A total of 27 CpGs were significantly correlated to biochemical variables (p < 0.05, r>|0.5|) ().
Table 2. CpGs most correlated to biochemical variables.
The highest correlations were for OGTT0.2 in epidermal growth factor receptor (EGFR) (cg14688342), protein disulphite isomerase family A member 5 (PDIA5) (cg21873971), protein kinase AMP-activated catalytic subunit alpha 2 (PRKAA2) (cg05894391) genes, and in non-annotated region cg04217177; and for OGTT120.2 in DAN Family BMP antagonist (NBL1) gene (cg14579430, cg15589641, cg12474394, and cg14715327) and in the mitochondrial inner membrane organizing system 1-NBL1 (MINOS1-NBL1) gene (cg10211745, cg19234140) (). There is a strong correlation between CpGs in the same gene (r > 0.9), and in the same direction ().
Figure 3. Correlation-plots a)the most correlated CpGs with OGTT0.2 (r>|0.6|). b) the most correlated CpGs with OGTT120.2(r>|0.6|). *: p-value<0.05, **: p-value<0.01, ***: p-value<0.005, ****: p-value<0.001. OGTT0: Fasting glucose; OGTT120: Oral Glucose Tolerance Test, point 120 min. .2: post labour visit.
Discussion
In this work, we found a total of 1041 DMPs in the peripheral blood of GDM vs. non-GDM women. Based on functional analysis of the 714 genes annotated, we found 23 genes related to positive regulation of glycolytic process, MAPK signalling pathway, insulin pathway, cellular response to nutrient levels, T2DM, and insulin resistance. Furthermore, the correlation analysis showed that some of the most enriched genes are correlated to glucose and insulin variables (fasting glucose, different points of OGTT, HbA1C, HOMAIR) at baseline and post-labour clinical analytics.
Currently, there is a growing interest in the study of genetic and epigenetic patterns in GDM pregnant women and their offspring [Citation14,Citation26]. Our results agree with recent studies. Ballesteros et al. [Citation17] identified 3 DMPs within LINC00917, TRAPPC9, and LEF1 genes in GDM women with abnormal glucose tolerance, and also LINC00917 and TRAPPC9 were associated with abnormal glucose levels after 4 years of postpartum. In another study, carried out in maternal blood before the GDM diagnosis, they found five DMPs in COPS8, PIK3R5, HAAO, CCDC124, and C5orf34 genes with the potential to be clinical biomarkers of GDM development [Citation16]. In another study, in a group of South African women with GDM and non-GDM, the five CpG more differentiated were in SLC9A3, MEA1, KLHDC3, CAMTA1, and RASA3 genes. According to their functional analysis, these genes were related to signal transduction, cell growth, proliferation, differentiation and apoptosis, insulin resistance, glucose metabolism, inflammation, neurological signalling, and oncogenesis [Citation10].
CAMTA1 was one of the most hypomethylated genes and is correlated with relevant metabolic variables. CAMTA1 seems to be implicated in the beta cell insulin regulation and secretion [Citation27]. Guerra-Mollet suggests that in response to a high level of sugar there is a decreased level of CAMTA1 downregulating the expression of INS1 and INS2, and decreasing insulin secretion. Recent studies highlight the importance of CAMTA1 at multiple levels, from the detection of glucose to insulin production and secretion, and beta cell function. As it is well known, insulin regulates the glucose and lipid metabolism [Citation28]. The hypomethylation observed in the GDM group could imply an altered expression of CAMTA1 affecting the insulin secretion, and in consequence in the regulation of glucose and lipid metabolism [Citation28], as we observed with a negative correlation with HOMA-IR and triglyceride levels. However, this effect should be evaluated with additional experiments. Dias et al. found, as we did, a lower methylation of CAMTA1 in GDM vs non-GDM [Citation29]. Although our DMPs are different from their work, the location of both our CPGs and theirs are in the body region, meaning that the biological response may be similar. Finally, different studies have shown an association between polymorphisms in CAMTA1 and carbohydrate metabolism such as blood lipid traits and blood pressure [Citation30], fasting glucose [Citation31] and T2DM [Citation32].
It is known that insulin secretory defect, high insulin resistance, and beta cell dysfunction may be implicated in the development of GDM [Citation7,Citation33,Citation34]. Accordingly, in our functional enrichment analysis of the DMPs, we found that the most significant GO and KEGG were related to the regulation secretion of insulin, insulin signalling pathway, and T2DM. All of these pathways are implicated in the development of T2DM [Citation35–37]. Therefore, the epigenetic pattern of these genes may be implicated in the development/risk of GDM.
We found that some CpGs were correlated with some clinical variables at different times. Most of these associations are related to glucose levels and the OGTT result after labour. Several genes seem to be associated with the response to the glucose overload. For example, AKT serine/threonine kinase 2 (AKT2) and mechanistic target of rapamycin kinase (MTOR) are known for their implication in the insulin signalling pathways. Some studies in mice suggest that downregulation of AKT2 is related to high levels of glucose and insulin resistance [Citation38]. In humans, certain polymorphisms associated with decreased levels of AKT2 were related with impaired glucose, insulin resistance, and T2DM risk [Citation39,Citation40]. In general, hypermethylation in promoters regions is associated with downregulation, whereas gene body methylation is associated with expression in several studies, although this latter is still unclear [Citation41]. We have found that AKT2 is hypermethylated in the promoter region (5’UTR), suggesting that this gene could be downregulated and therefore contributing to the increase in glucose levels. Regarding MTOR, overexpression is associated with anabolic process and insulin secretion [Citation42,Citation43]. In our study, CpGs of MTOR were hypermethylated in the body region, which could involve a higher expression of this gene. PRKAA2 was associated with glucose levels after OGTT, and this gene seems to be related to insulin sensitivity [Citation44] and some polymorphisms have been associated with T2DM [Citation45]. Furthermore, PRKAA2 is closely related to MTOR regulation, i.e., downregulation of PRKAA2 induces MTOR expression and an increase in protein synthesis and insulin resistance in rats [Citation46]. Perhaps higher methylation in the TSS1500 region of PRKAA2, as we have found, could mean a downregulation of this gene resulting in a decrease in insulin secretion and higher glucose levels after OGTT.
In our result NBL1 and MINOs-NBL1 had more than 1 CpG correlated with the response to OGTT at 120 min, after labour. NBL1 could be implicated in the regulation of β cell function and in diabetic kidney disease acting as a bone morphogenetic protein (BMP) antagonist, which are part of the TGF-β pathway [Citation47,Citation48]. Therefore, lower level of NBL1 may induce a dysregulation in beta cell function. As a result, an altered function of β cell, maintained in the time, could result in an increased risk of high glucose levels in response to an OGTT. Also, there are recent studies that suggest the implication of the BMP family in obesity and glucose metabolism (potential functions of the BMP family in bone, obesity, and glucose metabolism). Therefore, the antagonist role of NBL1 through BMP could be implicated in the glucose level after an OGTT in the post-labour visit. However, more studies would be necessary to understand the role of NBL1 gene in glucose metabolism.
Our study presents some limitations that we must comment. Although the differences found are relevant and significant beyond the FDR threshold, the sample size is small, and the results should be interpreted with caution. Furthermore, validation in a larger cohort or with other technologies would reinforce our findings. Nevertheless, we consider that the probability of false positives is low due to the small genomic inflation lambda factor obtained, but more studies are necessary to confirm our results. Regarding the characteristics of our population, the control group are pregnant women with a previous positive O’Sullivan test, so this issue should be considered when extrapolating these results to other populations. Finally, with our study design, we cannot demonstrate that the associations found imply causality.
Regarding the strengths of our study, we highlight the homogeneous selection of the sample, emphasizing that the differences found are mostly due to the different epigenetic marks and not to other possible confounding variables, which were also considered in the study. The main difference between the groups was that the control group showed higher weight gain during pregnancy compared with GDM. This finding is not surprising and indicates good adherence from GDM pregnant women to therapeutic measures implemented at diagnosis. Furthermore, our results are in accordance with previous studies that found a different methylation pattern between GDM and non-GDM. In fact, our findings were strongly significant at a threshold of FDR <0.05.
Conclusion
In addition, these epigenetic differences correspond to genes involved in the glucose metabolism and are associated with some biochemical variables after labour. These results help to understand which mechanism could be modified in GDM and how the methylation profile at the diagnostic visit can be associated with glucose metabolism-related variables in the future.
Data availability of statement
The data sets used during the current study are available from the corresponding author on reasonable request.
Ethics approval and consent to participate
This study was conducted according to the guidelines of the Declaration of Helsinki and approved by the Ethics Committee of the Hospital Universitario Virgen de la Victoria, Málaga.
Authors’ contributions
TML-P: methodology, analysis, interpretation of the data and wrote original draft, NP-M: processed the samples and performed the experiments prior to the DNA methylation, CG-R: participated in the design of the work, FL-M: sample collection, AS-P: revision of the manuscript, FJ-T: supervision and revision of the paper, MM-V: conceptualization and acquired data from the patients and collected samples, MJ-P: conceptualization, funding acquisition and contributed to the discussion, SM: conception/design, funding acquisition, interpretation of the data and has substantively revised the work.
Supplemental Material
Download Zip (56.3 KB)Disclosure statement
No potential conflict of interest was reported by the author(s).
Supplementary material
Supplemental data for this article can be accessed online at https://doi.org/10.1080/15592294.2023.2211369.
Additional information
Funding
References
- Phelan S, Jelalian E, Coustan D, et al. Protocol for a randomized controlled trial of pre-pregnancy lifestyle intervention to reduce recurrence of gestational diabetes: gestational diabetes prevention/Prevención de la diabetes gestacional. Trials [Internet]. 2021 Dec 1;22(1). [cited 2022 Feb 2]. Available from: /pmc/articles/PMC8024941/
- Lesseur C, Chen J. Adverse maternal metabolic intrauterine environment and placental epigenetics: implications for fetal metabolic programming. Curr Environ Heal Reports. 2018 Dec 1;5(4):531–12.
- McIntyre HD, Catalano P, Zhang C, et al. Gestational diabetes mellitus. Nat Rev Dis Prim 2019 51 [Internet]. 2019 Jul 11; 5(1):1–19. [cited 2022 Feb 3]. Available from: https://www.nature.com/articles/s41572-019-0098-8
- Mack LR, Tomich PG Gestational Diabetes: Diagnosis, Classification, and Clinical Care [Internet]. Obstet Gynecology Clin North Am WB Saunders. 2017;44:207–217. [cited 2020 Sep 28]. Available from: https://pubmed.ncbi.nlm.nih.gov/28499531/
- Eades CE, Cameron DM, Evans JMM. Prevalence of gestational diabetes mellitus in Europe: a meta-analysis. Diabet Res Clin Pract. 2017 Jul 1;129:173–181.
- Xiong X, Saunders LD, Wang FL, et al. Gestational diabetes mellitus: prevalence, risk factors, maternal and infant outcomes. Int J Gynaecol Obstet [Internet]. 2001;75(3):221–228. [cited 2022 Jul 29]. Available from: https://pubmed.ncbi.nlm.nih.gov/11728481/
- Fakhrul-Alam M, Sharmin-Jahan MH, Nusrat-Sultana MZ, et al. Insulin secretory defect may be the major determinant of GDM in lean mothers. J Clin Transl Endocrinol [Internet]. 2020 Jun 1;20:100226. [cited 2022 Jul 28]. Available from: /pmc/articles/PMC7199011/
- Haertle L, El Hajj N, Dittrich M, et al. Epigenetic signatures of gestational diabetes mellitus on cord blood methylation. Clin Epigenetics. 2017 Mar 27;9:2–12.
- Yang IV, Zhang W, EJ D, et al. Epigenetic marks of in utero exposure to gestational diabetes and childhood adiposity outcomes: the EPOCH study. Diabet Med [Internet]. 2018 May 1;35(5):612–620. [cited 2021 Sep 22]. Available from: https://pubmed.ncbi.nlm.nih.gov/29461653/
- Dias S, Adam S, Rheeder P, et al. Altered genome-wide DNA methylation in peripheral blood of South African women with gestational diabetes mellitus. Int J Mol Sci [Internet]. 2019 Nov 20;20(23):5828. [cited 2020 Apr 20]. Available from: http://www.ncbi.nlm.nih.gov/pubmed/31757015
- Wu L, Cui L, Tam WH, et al. Genetic variants associated with gestational diabetes mellitus: a meta-analysis and subgroup analysis. Sci Rep [Internet]. 2016 Jul 29;6. [cited 2022 Feb 3]. Available from: https://pubmed.ncbi.nlm.nih.gov/27468700/
- Moore LD, Le T, Fan G DNA methylation and its basic function. Neuropsychopharmacology [Internet]. 2013 Jan;38(1):23–38. [cited 2022 Jul 28]. Available from: https://pubmed.ncbi.nlm.nih.gov/22781841/10.1038/npp.2012.112
- Dias S, Pheiffer C, Abrahams Y, et al. Molecular biomarkers for gestational diabetes mellitus. Int J Mol Sci. 2018 Oct 1;19:2926–2899.
- Valencia-Ortega J, Saucedo R, Sánchez-Rodríguez MA, et al. Epigenetic alterations related to gestational diabetes mellitus. Int J Mol Sci [Internet]. 2021 Aug 31;22(17):9462. [cited 2021 Sep 22]. Available from: https://www.mdpi.com/1422-0067/22/17/9462
- Canouil M, Khamis A, Keikkala E, et al. Epigenome-wide association study reveals methylation loci associated with offspring gestational diabetes mellitus exposure and maternal methylome. Diabetes Care [Internet]. 2021 Sep 1;44(9):1992–1999. [cited 2023 Mar 29]. Available from: https://pubmed.ncbi.nlm.nih.gov/34116986/
- Wu P, Farrell WE, Haworth KE, et al. Maternal genome-wide DNA methylation profiling in gestational diabetes shows distinctive disease-associated changes relative to matched healthy pregnancies. Epigenetics [Internet]. 2018 Feb 1;13(2):122. [cited 2021 Oct 8]; Available from: /pmc/articles/PMC5873366/
- Ballesteros M, Gil-Lluís P, Ejarque M, et al. DNA methylation in gestational diabetes and its predictive value for postpartum glucose disturbances. J Clin Endocrinol Metab [Internet]. 2022 Aug 2. [cited 2022 Aug 9]. Available from: https://pubmed.ncbi.nlm.nih.gov/35914803/
- Classification and diagnosis of diabetes mellitus and other categories of glucose intolerance. National Diabetes Data Group Diabetes. 1979 Dec;28(12):1039–1057.
- Elsayed NA, Aleppo G, Aroda VR, et al. 15. Management of diabetes in pregnancy: standards of care in diabetes—2023. Diabetes Care [Internet]. 2023 Jan 1;46(Supplement_1):S254–66. [cited 2023 Mar 29]. Available from: https://diabetesjournals.org/care/article/46/Supplement_1/S254/148052/15-Management-of-Diabetes-in-Pregnancy-Standards
- Matthews DR, Hosker JP, Rudenski AS, et al. Homeostasis model assessment: insulin resistance and β-cell function from fasting plasma glucose and insulin concentrations in man. Diabetologia [Internet]. 1985 Jul;28(7):412–419. [cited 2023 Mar 29]. Available from: https://link.springer.com/article/10.1007/BF00280883
- Morris TJ, Butcher LM, Feber A, et al. ChAMP: 450k chip analysis methylation pipeline. Bioinformatics [Internet]. 2014 Feb 1;30(3):428–430. [cited 2022 Jun 13]. Available from: https://academic.oup.com/bioinformatics/article/30/3/428/228299
- Zhou W, Laird PW, Shen H Comprehensive characterization, annotation and innovative use of infinium DNA methylation BeadChip probes. Nucleic Acids Res [Internet]. 2017 Feb 28;45(4):e22. [cited 2022 Jun 13]. Available from: https://academic.oup.com/nar/article/45/4/e22/2290930
- Weng X, Liu F, Zhang H, et al. Genome-wide DNA methylation profiling in infants born to gestational diabetes mellitus. Diabet Res Clin Pract. 2018 Aug 1;142:10–18.
- Houseman EA, Accomando WP, Koestler DC, et al. DNA methylation arrays as surrogate measures of cell mixture distribution. BMC Bioinf [Internet]. 2012 May 8;13(1):1–16. [cited 2022 Jun 13]. Available from: https://bmcbioinformatics.biomedcentral.com/articles/10.1186/1471-2105-13-86
- Alptekin H, Çizmecioäÿlu A, Işik H, et al. Predicting gestational diabetes mellitus during the first trimester using anthropometric measurements and HOMA-IR. J Endocrinol Invest [Internet]. 2016 May 1;39(5):577–583. [cited 2023 Mar 29]. Available from: https://pubmed.ncbi.nlm.nih.gov/26754418/
- Samra NA, Jelinek HF, Alsafar H, et al. Genomics and epigenomics of gestational diabetes mellitus: understanding the molecular pathways of the disease pathogenesis. Int J Mol Sci [Internet]. 2022 Apr 1;23(7). [cited 2022 Aug 8]. Available from: https://pubmed.ncbi.nlm.nih.gov/35408874/
- Mollet IG, Malm HA, Wendt A, et al. Integrator of stress responses calmodulin binding transcription activator 1 (Camta1) regulates miR-212/miR-132 expression and insulin secretion. J Biol Chem [Internet]. 2016 Aug 26;291(35):18440–18452. [cited 2022 Aug 10]. Available from: https://pubmed.ncbi.nlm.nih.gov/27402838/
- Saltiel AR, Kahn CR Insulin signalling and the regulation of glucose and lipid metabolism. Nature [Internet]. 2001 Dec 13;414(6865):799–806. [cited 2023 Mar 29]. Available from: https://pubmed.ncbi.nlm.nih.gov/11742412/
- Dias S, Adam S, Rheeder P, et al. Altered genome-wide DNA methylation in peripheral blood of South African women with gestational diabetes mellitus. Int J Mol Sci [Internet]. 2019 Dec 1;20(23). [cited 2021 Sep 22]. Available from: https://pubmed.ncbi.nlm.nih.gov/31757015/
- Wei FJ, Cai CY, Yu P, et al. Quantitative candidate gene association studies of metabolic traits in Han Chinese type 2 diabetes patients. Genet Mol Res [Internet]. 2015 Nov 30;14(4):15471–15481. [cited 2022 Aug 10]. Available from: https://pubmed.ncbi.nlm.nih.gov/26634513/
- Mohamed SA, Fernadez-Tajes J, Franks PW, et al. GWAS in people of Middle Eastern descent reveals a locus protective of kidney function-a cross-sectional study. BMC Med [Internet]. 2022 Dec 1;20(1). [cited 2022 Aug 10]. Available from: https://pubmed.ncbi.nlm.nih.gov/35227251/
- Cauchi S, Proença C, Choquet H, et al. Analysis of novel risk loci for type 2 diabetes in a general French population: the D.E.S.I.R. study. J Mol Med (Berl) [Internet]. 2008 Mar;86(3):341–348. [cited 2022 Aug 10]. Available from: https://pubmed.ncbi.nlm.nih.gov/18210030/
- Ellerbrock J, Spaanderman B, Drongelen JV, et al. Role of beta cell function and insulin resistance in the development of gestational diabetes mellitus. Nutrients [Internet]. 2022 Jun 13;14(12):2444. [cited 2022 Aug 9]. Available from: /pmc/articles/PMC9231208/.
- Zhang NJ, Tao MF, Li HP, et al. The relationship between patterns of insulin secretion and risks of gestational diabetes mellitus. Int J Gynaecol Obstet [Internet]. 2020 Sep 1;150(3):318–323. [cited 2022 Aug 9]. Available from: https://pubmed.ncbi.nlm.nih.gov/32415984/
- Doria A, Patti ME, Kahn CR The emerging genetic architecture of type 2 diabetes. Cell Metab [Internet]. 2008 Sep 3;8(3):186–200. [cited 2022 Aug 10]; Available from: http://www.cell.com/article/S1550413108002477/fulltext
- Florez JC The genetics of type 2 diabetes: a realistic appraisal in 2008. J Clin Endocrinol Metab [Internet]. 2008 Dec 1;93(12):4633–4642. [cited 2022 Aug 10]. Available from: https://academic.oup.com/jcem/article/93/12/4633/2627272
- Staiger H, Machicao F, Fritsche A, et al. Pathomechanisms of type 2 diabetes genes. Endocr Rev [Internet]. 2009 Oct 1;30(6):557–585. [cited 2022 Aug 10]. Available from: https://academic.oup.com/edrv/article/30/6/557/2355053
- Cho H, Mu J, Kim JK, et al. Insulin resistance and a diabetes mellitus-like syndrome in mice lacking the protein kinase Akt2 (PKB beta). Science [Internet]. 2001 Jun 1;292(5522):1728–1731. [cited 2023 Mar 27]. Available from: https://pubmed.ncbi.nlm.nih.gov/11387480/
- Manning A, Highland HM, Gasser J, et al. A low-frequency inactivating AKT2 variant enriched in the Finnish population is associated with fasting insulin levels and type 2 diabetes risk. Diabetes [Internet]. 2017 Jul 1;66(7):2019–2032. [cited 2023 Mar 27]. Available from: https://pubmed.ncbi.nlm.nih.gov/28341696/
- Latva-Rasku A, Honka MJ, Stancáková A, et al. A partial loss-of-function variant in AKT2 is associated with reduced insulin-mediated glucose uptake in multiple insulin-sensitive tissues: a genotype-based callback positron emission tomography study. Diabetes [Internet]. 2018 Feb 1;67(2):334–342. [cited 2023 Mar 27]. Available from: https://diabetesjournals.org/diabetes/article/67/2/334/15949/A-Partial-Loss-of-Function-Variant-in-AKT2-Is
- Yang X, Han H, DeCarvalho DD, et al. Gene body methylation can alter gene expression and is a therapeutic target in cancer. Cancer Cell [Internet]. 2014 Oct 13;26(4):577–590. [cited 2023 Mar 27]. Available from: https://pubmed.ncbi.nlm.nih.gov/25263941/
- Alejandro EU, Bozadjieva N, Blandino-Rosano M, et al. Overexpression of kinase-dead mTOR impairs glucose homeostasis by regulating insulin secretion and not β-cell mass. Diabetes [Internet]. 2017 Aug 1;66(8):2150–2162. [cited 2023 Mar 27]. Available from: https://pubmed.ncbi.nlm.nih.gov/28546423/
- Leprivier G, Rotblat B How does mTOR sense glucose starvation? AMPK is the usual suspect. Cell Death Discov [Internet]. 2020 Dec 1;6(1). [cited 2023 Mar 27]. Available from: https://pubmed.ncbi.nlm.nih.gov/32351714/
- Ganbold M, Ferdousi F, Arimura T, et al. New amphiphilic squalene derivative improves metabolism of adipocytes differentiated from diabetic adipose-derived stem cells and prevents excessive lipogenesis. Front Cell Dev Biol [Internet]. 2020 Nov 4;8. [cited 2022 Aug 11]. Available from: https://pubmed.ncbi.nlm.nih.gov/33251210/
- Virginia DM, Dwiprahasto I, Wahyuningsih MSH, et al. The effect of PRKAA2 variation on type 2 diabetes mellitus in the Asian population: a systematic review and meta-analysis. Malays J Med Sci [Internet]. 2022 Jun 28;29(3):5–16. [cited 2022 Aug 11]. Available from: https://pubmed.ncbi.nlm.nih.gov/35846493/
- Saha AK, Xu XJ, Lawson E, et al. Downregulation of AMPK accompanies leucine- and glucose-induced increases in protein synthesis and insulin resistance in rat skeletal muscle. Diabetes [Internet]. 2010 Oct;59(10):2426–2434. [cited 2023 Mar 27]. Available from: https://pubmed.ncbi.nlm.nih.gov/20682696/
- Wang HL, Wang L, Zhao CY, et al. Role of TGF-Beta signaling in beta cell proliferation and function in diabetes. Biomolecules [Internet]. 2022 Mar 1;12(3):373. [cited 2022 Sep 26]. Available from: /pmc/articles/PMC8945211/
- Kobayashi H, Looker HC, Satake E, et al. Neuroblastoma suppressor of tumorigenicity 1 is a circulating protein associated with progression to end-stage kidney disease in diabetes. Sci Transl Med [Internet]. 2022 Aug 10;14(657):eabj2109. [cited 2022 Sep 26]. Available from: https://www.science.org/doi/10.1126/scitranslmed.abj2109