
ABSTRACT
Benzo[a]pyrene (BaP) is ubiquitously present in the aquatic environment and has been identified as a bone toxicant. Previous studies have demonstrated that ancestral BaP exposure can cause transgenerational bone deformities in fish. Transgenerational effects are thought to be caused by heritable epigenetic changes, such as DNA methylation, histone modification, and non-coding RNAs. To investigate the role of DNA methylation in BaP-induced transgenerational skeletal deformities and the related transcriptomic changes in deformed vertebrae, we examined the vertebrae of male F1 and F3 medaka fish using high-throughput RNA sequencing (RNA-seq) and whole-genome bisulphite sequencing (WGBS). The histological results revealed that osteoblast numbers at the vertebral bone decreased in the BaP-derived F1 and F3 adult males in comparison with the control group. Differentially methylated genes (DMGs) associated with osteoblastogenesis (F1 and F3), chondrogenesis (F1 and F3), and osteoclastogenesis (F3) were identified. However, RNA-seq data did not support the role of DNA methylation in the regulation of genes involved in skeletogenesis since there was very little correlation between the level of differential methylation and gene expression profiles related to skeletogenesis. Although DNA methylation plays a major role in the epigenetic regulation of gene expression, the dysregulation of vertebral gene expression patterns observed in the current study is most likely to be mediated by histone modification and miRNAs. Notably, RNA-seq and WGBS data indicated that genes related to nervous system development are more sensitive to ancestral BaP exposure, indicating a more complex transgenerational phenotype in response to ancestral BaP exposure.
Introduction
Benzo[a]pyrene (BaP) is a representative polycyclic aromatic hydrocarbon (PAH) ubiquitously present in the aquatic environment. Many studies have demonstrated its effects on development, reproductive function, neurobehavior, and immunity in both humans and fish (reviewed in [Citation1] [Citation2–4]). Notably, an increased incidence of skeletal defects (spinal and craniofacial) has been reported in feral fish from PAH-polluted waters [Citation5]. Moreover, parental BaP exposure resulted in bone toxicity (altered body shape) in the offspring of medaka (F1) and zebrafish (F1 – F2) (10–1012 μg/g diet; 0.2–125 μg/L) [Citation6,Citation7]. Recent studies in our laboratory have further demonstrated that an environmentally realistic level of BaP (1 μg/L) caused transgenerational skeletal deformities (larvae: bone compression, reduced osteoblast number; adult: bone thinning) in both developing larvae and adult males (F1 – F3) following ancestral BaP exposure [Citation8–11]. The in vivo expression of osteoblast and osteoclast marker genes (collagen 10a1 (COL10a1) and osterix (OSX)) were disrupted in developing larvae [Citation8], while bone morphogenetic proteins (BMP2 and 3) and genes involved in the WNT/β-catenin pathway were possibly responsible for the dysregulation of bone formation and resorption processes in the vertebrae of adult males upon ancestral BaP exposure [Citation9,Citation10].
Transgenerational effects occurring in the F3 generation and beyond should be distinguished from multigenerational effects occurring in the F1 and F2 generations (see review by [Citation12]). In medaka fish, which reproduce via external fertilization, the F1 offspring are directly exposed to a toxicant via F1 germ cell exposure in the gonads of F0 parents and/or possible chemical transfer into the yolk sac. Moreover, F2 offspring may also be directly exposed since the chemical deposit in an F1 yolk sac may release and affect F2 primordial germ cells (PGCs) harboured in the developing F1 embryos [Citation11,Citation13]. On the contrary, F3 offspring are never exposed to the chemical, and any effects observed in the F3 and subsequent generations are likely attributable to epigenetic inheritance. Considering the difference between multigenerational and transgenerational effects, the transgenerational vertebral deformities of F3 adult males can be attributed to epigenetic modifications inherited from the exposed ancestors. To explore the epigenetic modifications potentially responsible for BaP-induced transgenerational bone impairment, five functional pairs of mRNA/miRNA (i.e., OSX/miR−214, col2a1b/miR−29b, Runt-related transcription factor 2(RUNX2)/miR−204, SRY-box transcription factor 9 (SOX9b)/miR−199a−3p, and Adenomatous polyposis coli (APC)/miR−27b) were suggested to be involved in decreased osteoblast activity in the F3 generation [Citation10]. Additionally, mRNA and miRNA transcriptomic analysis identified a few dysregulated mRNA/miRNA sets that may explain the inhibition of bone formation and promotion of bone resorption in F3 vertebrae [Citation9].
Gene expression can also be regulated by DNA methylation and histone modifications. As one of the most-studied epigenetic mechanisms, it has been demonstrated that BaP exposure modifies global and gene-specific DNA methylation in fish in concomitance with developmental, reproductive, and neurobehavioral toxicity. Fang et al. [Citation14] reported that the waterborne BaP exposure (24 μg/L) of zebrafish embryos significantly decreased global methylation levels and decreased global DNA methylation and aberrant changes in the promoters of many human disease-related genes were identified following parental and continued embryonic BaP exposure at 50 μg/L [Citation6]. Furthermore, Knecht et al. ([Citation15]) demonstrated that the developmental exposure of F0 zebrafish embryos to BaP (1262 μg/L and 2514 μg/L) could cause the transgenerational inheritance of neurobehavioral and physiological deficits in subsequent generations (hyper locomotor activity, decreased heartbeat, and mitochondrial function in F0 and F2 juvenile). Reduced global DNA methylation coupled with the downregulated expression of dnmt genes was observed in F0 embryos, which suggests that DNA methylation may play a role in the transgenerational neurophysiological effects resulting from BaP exposure. However, methylation data for F1 and F2 generations were not investigated. Deregulation of DNA methylation was highlighted in the sperm of the F1 generation upon larval neurobehavioral and-developmental impacts in response to parental BaP exposure [Citation16].
Although BaP-induced DNA methylation changes influence the transcription levels of genes that play important roles in various physiological functions, little is known about their involvement in vertebral malformations in fish. Nevertheless, we have recently reported that BaP exposure in F0 adult fish caused transgenerational vertebral deformities in F1, F2, and F3 adult males. Therefore, it is hypothesized that DNA methylation changes are involved in the regulation of gene expressions in vertebrae and responsible for the observed vertebral deformities in male fish. More importantly, some DNA methylation marks might be conserved between generations. Although skeletal deformities were present in the vertebrae of male F1, F2, and F3 fish, the F1 and F3 generations can present multigenerational bone toxicity (directly exposed) and transgenerational bone toxicity caused by BaP, respectively.
Materials and methods
Benzo[a]pyrene
BaP (Chemical Abstracts Service no. 50-32-8; purity > 97%) was purchased from Sigma-Aldrich. A stock solution (20 000 μg/l) was prepared by dissolving BaP powder in ethanol – dimethyl sulphoxide solvent (EtOH: DMSO = 4:1), which was stored at −20°C in aliquots. The ethanol and DMSO used were analytical or high-performance liquid chromatography grade.
Medaka model
The Japanese medaka (Cab strain) used in this study originated from Prof. Christoph Winkler’s laboratory at the Department of Biological Sciences, National University of Singapore, and have been maintained in our laboratory since 2015. The breeding pairs (∼6 months old) used in this experiment were raised in charcoal-dechlorinated tap water at a constant temperature (26 ± 1°C) with a 14:10 h light:dark cycle.
BaP exposure
Briefly, 10 pairs of sexually mature medaka (six months old, F0 generation) were randomly assigned into glass aquariums containing 20-L of charcoal-dechlorinated tap water. Four tanks were assigned as solvent controls by adding a 0.0005% EtOH:DMSO (vol/vol) mixture and six tanks were treated with BaP by adding 1 μg/L BaP with a final concentration of EtOH:DMSO at 0.0005%. Thereafter, 75% of the water from both control and treatment group tanks was changed and replenished every 2 days. Fish were fed twice per day with hormone-free dry flake food (Marubeni Nisshin Feed Co., Ltd., Tokyo, Japan) and once per day with brine shrimp (Brine Shrimp Direct, CA, USA). BaP exposure was then suspended after 21 days. To eliminate the BaP from tanks, a total of five water changes were conducted on days 22 and 23. Thereafter, embryos were collected from the spawning females within two hours after the beginning of the light photoperiod. Collected embryos were assessed under a dissection stereomicroscope and only fertilized embryos were kept and raised to adults (F1 generation). For the assessment of F1 adult male bone development, 6-month-old males were collected from both the control and BaP treatment groups. The same procedure was repeated for the F2 and F3 generations. All animal handling was performed following the regulations of the Animal Ethics Committee, City University of Hong Kong.
DNA library preparation for whole-genome bisulphite sequencing
The genomic DNA (gDNA) of vertebrae from male F1 and F3 fish was extracted for WGBS using the phenol-chloroform-isoamyl alcohol method. For each gDNA sample (n = 1; gDNA of 15 fish), DNA quantity, integrity, and purity were determined using 1% agarose gel electrophoresis and a Qubit DNA Assay on a Qubit 3.0 fluorometer (Life Technologies, CA, USA). The gDNA was fragmented into 200–300 bp fragments by sonication. Terminal repair, A-ligation, and methylation sequencing adapter ligation were then performed on the DNA fragments. DNA library bisulphite treatment was conducted using the EZ DNA Methylation Gold Kit (Zymo Research Corp, Irvine, CA, USA). The resulting single-stranded DNA was amplified using a HiFi HotStart Uracil + ReadyMix polymerase chain reaction (PCR) Kit (KAPA Biosystems, Boston, MA, USA). Thereafter, the library concentration and quality were determined using a Qubit 3.0 Fluorometer and an Agilent 2100 Bioanalyser (Agilent Technologies, Santa Clara, CA, USA), respectively. Libraries were sequenced using the HiSeq X Ten System at Novogene Co., Ltd (Beijing, China) to generate 150-bp paired-end reads delivered in FASTQ format, which provided sufficient genome coverage for differential methylation analysis.
WGBS analysis
Sequencing files that were generated by the sequencer first underwent initial quality control [Citation17] and were then subjected to quality and adaptor trimming by using Trim Galore [Citation17] with the following parameters: (a) removal of base calls with a Phred score of 20 or lower; (b) removal of reads shorter than 20 bp; (c) removal of reads with an adaptor sequence. After retrieving qualified reads from raw data, Bismark (v0.22.3) [Citation18] was used for WGBS alignments (http://www.bioinformatics.babraham.ac.uk/projects/bismark/). Before alignments could be performed, the genome of Japanese medaka (Oryzias latipes, genome assembly: ASM223467v1) was bisulphite-converted in-silico and indexed using the bismark_genome_preparation command. Filtered reads were aligned to the bisulphite-converted genome using the bismark command, which takes advantage of the Bowtie2 aligner. Generated Bismark alignment BAM files underwent a deduplication step using the deduplicate_bismark command, which removed all reads but one, which was aligned to the very same position and orientation. Additionally, alignments with a mapping quality (MAPQ) value of less than 10 were discarded. To extract the methylation call for each cytosine (C), the bismark_methylation_extractor command was used on the result files. The position of every C was then written out to a new output file depending on its content (i.e., cytosines (C) followed by guanine (G) residues (CpG), C followed by any base except G and G (CHG), or C followed by any base except G (CHH)), and only CpG content was kept for downstream analysis.
The downstream analysis and generation of figures for methylation data were conducted in R [Citation19]. The Bioconductor package DSS (Dispersion Shrinkage for Sequencing data) was used for differential methylation assessment [Citation20]. The core of DSS is a procedure based on the Bayesian hierarchical model to estimate and shrink CpG site-specific dispersions. The minimum read depth was 30 × . Read depth variation has been taken into consideration through the DSS pipeline, which includes an algorithm to account for technical and biological variability [Citation21] [Citation22] Wald tests were then performed for differential methylation detection. Since only one biological sample in each treatment was sequenced, the method used to analyse the differentially methylated locis (DMLs) or regions was limited. However, one of the advantages that DSS provides is that the statistical test can be conducted even when there are no biological replicates because the neighbouring CpG sites can be considered pseudo-replicates due to smoothing, while dispersion can still be calculated with reasonable precision [Citation23]. Data from the bismark output were prepared in the format required by DSS, which contains the following information: chromosome number, genomic coordinate, the total number of reads, and the number of reads with methylation. The callDML and callDMR functions from the DSS package were used to extract DML and regions with methylation differences greater than 10% (DMLs: p < 0.001 and DMR: p < 0.01). Differently methylated regions (DMRs) were filtered based on their length (≥50 bps) and number of CpG sites (≥4). The neighbouring DMRs were merged if the distance between them was less than 50 bps.
Gene ontology enrichment analysis (DMR-Associated genes)
Genes that had DMRs on their promoter regions (4 kb upstream and 200 bp downstream of the transcription start site (TSS)) and gene body (from TSS to transcription end site (TES)) were considered DMR-associated genes. These DMR associated genes were used in the Gene Ontology (GO) (biological process and molecular function) and Kyoto Encyclopedia of Genes and Genomes (KEGG) enrichment analysis in Metascape [Citation24] and Ingenuity Pathway Analysis (IPA, version: 60467501, Qiagen, US).
RNA-Seq
Total RNA extracted from the vertebrae of F1 and F3 males (n = 3 and each sample was pooled from 6 fish) were sent to BGI (Wuhan, China) for RNA sequencing. A library was prepared by BGI and sequencing was conducted on an Illumina Nova-seq platform (Illumina, US). At least 70 million sequences with 150-base paired-end single-reads were generated per sample. Reads were mapped to the Japanese medaka HdrR genome (assembly version: ASM223467v1) using Hisat2 [Citation25]. Successfully aligned reads were counted using the featureCounts programme from the Subread package [Citation26]. Read counts were processed and analysed using DESeq2 to calculate the expression changes of all successfully aligned genes [Citation27]. Differentially expressed genes (DEGs) were filtered by adjusted p-value (padj <0.05). GO enrichment analysis and IPA were performed on these DEGs using Metascape [Citation24] and IPA (Qiagen, US), respectively. Transcriptome raw data for the F3 generation were retrieved from PR- JNA757563 [Citation9].
Bone histology
Whole medaka fish (6 months old) were fixed after the removal of hard tissues (i.e., fins, operculum, skull roof, and otoliths). Fixed samples were processed according to the protocol described in Kong et al. [Citation28]. Briefly, adult males were fixed in GPHS [0.05% glutaraldehyde, 2% paraformaldehyde, 80% Histochoice MB fixative (Cat# 64115–04, Electron Microscopy Sciences, USA), 1% sucrose and 1% CaCl2 solution] overnight at 4°C. Fixed fish were dehydrated in a 70/80/95/100% graded series of methanol followed by cleaning in chloroform. Cleaned samples were infiltrated and embedded in melted paraffin (Fisher Scientific, US). Serial sections of individual fish were cut (7 μm) on a rotary microtome (Leica RM2125, Germany), mounted onto SuperFrost® Plus slides (Menzel-Gläser, Germany), and dried on a slide warmer at 33°C overnight. Tissue sections were observed under a compound microscope, and only sections showing vertebral columns were selected and number coded for specific staining.
Identification of osteoblasts via Goldner’s trichrome staining
Osteoblasts (OBs) were identified by measuring alkaline phosphatase (ALPase) activity using a modified version of Goldner’s trichrome staining protocol [Citation29]. Briefly, medaka tissue sections were deparaffinized and immersed in Weigert’s haematoxylin for nuclei staining (20 minutes), followed by immersion in Ponceau/acid fuchsin/azophloxine for 5 minutes. The staining colour was differentiated with 0.5% acid alcohol for 20 seconds. The stained sections were treated with phosphomolybdic acid and light green stain for 5 and 20 minutes, respectively. Stained sections were dehydrated in a series of ethanol solutions (70, 80, 100%) and xylene (two times) and then mounted for microscopic observation and analysis.
Quantitative histological analysis of osteoblast (OB)
Six sections (n = 5 in F1) containing vertebral segments 15–29 were selected to assess OB numbers at the intervertebral segments from the control and BaP-derived offspring in both F1 and F3 generations [Citation10].
Statistical analysis
For the osteoblast population, Student’s unpaired t-test were used to test the null hypothesis that the means of the control and BaP-derived group are equal. Significant differences are indicated by * < 0.05, ** < 0.01, and *** < 0.001. Statistical analyses were performed using R and figures were plotted using Microsoft Excel and R.
Results
DNA methylation profiling of vertebrae
Approximately 31 Gb (range 30–33) of raw data were generated from each pooled vertebrate gDNA sample from the F1 and F3 adult males (). The average number of sequenced reads for each sample was 200 million with an average read depth above 30× and the bisulphite conversion efficiency was over 99.9% (). The unique mapping rates of these reads to the bisulphite-converted medaka genome were between 62% and 65% in vertebrae. The global methylation levels for the control and BaP groups of the F1 and F3 generations were 7.47%, 7.26%, 7.32%, and 7.38%, respectively. CpG content, which presents 3% of the medaka genome [Citation30], had the highest methylation rate with 74.6%. Only 0.27% and 0.3% of cytosines were methylated in the CHH and CHG context.
Table 1. Overview of whole-genome bisulphite sequencing status in vertebrae.
BaP-induced multigenerational changes in DNA methylation in the F1 vertebrae
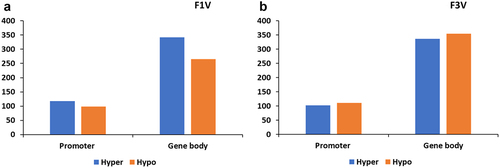
A total of 2093 DMRs were identified in the F1 vertebrae in response to BaP exposure of the F0 adults. 826 DMRs were annotated to a promoter region or a gene body (). 217 genes had a differently methylated promoter region (hypermethylated: 118 and hypomethylated: 99) and 608 genes showed a changed methylation pattern in the gene body (hypermethylated: 342 and hypomethylated: 266; ).
Figure 1. Number of methylated genes in vertebrae. Number of genes with differential methylation region on promoter and gene body in the vertebrae of F1 (a) and F3 (b).
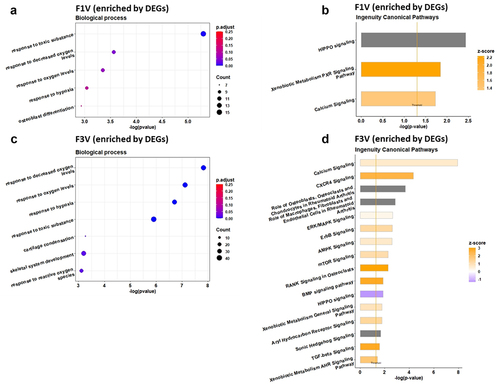
GO analysis of the differentially methylated genes (DMGs) revealed enrichment of biological processes in different categories. The enriched processes in the F1 male vertebrae associated with skeletogenesis were chondrocyte differentiation (14 genes, p = 2.07E–06), skeletal system development (33 genes, p = 7.81E–06), cartilage development (18 genes, p = 8.98E–06), regulation of chondrocyte differentiation (9 genes, p = 1.07E–05), regulation of cartilage development (10 genes, p = 2.07E–05), chondrocyte development (5 genes, p = 1.40E–03), bone development (14 genes, p = 1.70E–03), negative regulation of chondrocyte differentiation (4 genes, p = 4.12E–03), skeletal system morphogenesis (14 genes, p = 4.16E–03), negative regulation of cartilage development (4 genes, p = 8.48E–03), ossification (27 genes, p = 6.15E–05), regulation of ossification (12 genes, 1.09E–04), osteoblast differentiation (16 genes, p = 9.69E–04), regulation of osteoblast differentiation (11 genes, p = 1.36E–03), negative regulation of ossification (5 genes, p = 4.75E–03), positive regulation of chondrocyte differentiation (4 genes, p = 1.27E–03), positive regulation of cartilage development (5 genes, p = 1.40E–03) and cartilage condensation (4 genes, p = 2.41E–03; ).
Figure 2. GO terms and ingenuity pathway analysis of DMGs in the F1 (a, b) and F3 (c, d) vertebrae upon ancestral BaP-exposure. Left panel represents GO biological process terms and the right panel shows canonical pathways. Go term analysis was performed on DMGs using Metascape and significant terms were selected with p-value <0.01 and q-value <0.25. Canonical pathway analysis was performed on DMGs by Qiagen IPA tool and statistically significant pathways were filtered at p-value <0.05 level.
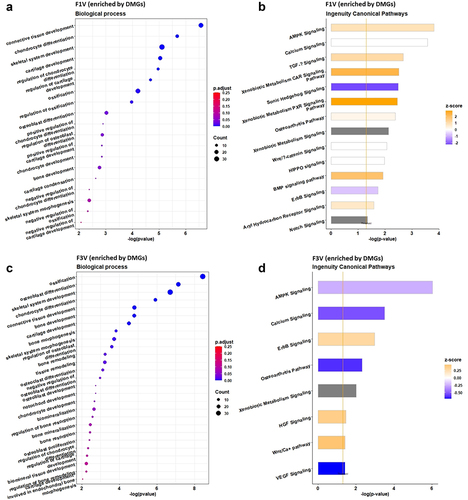
In addition, based on the IPA, DMGs were found to be significantly enriched in many canonical pathways, including AMP-activated protein kinase (AMPK) signalling (p = 1.51E–04, z-score 0.905), calcium signalling (p = 2.63E–04, z-score 0), transforming growth factor-β (TGF-β) signalling (p = 2.14E–03, z-score 1.134), xenobiotic metabolism CAR signalling pathway (p = 3.09E–03, z-score 2.324), sonic hedgehog signalling (p = 3.24E–03, z-score −2.236), xenobiotic metabolism PXR signalling pathway (p = 3.55E–03, z-score 2.84), osteoarthritis pathway (p = 4.17E–03, z-score 0.277), Wnt/β-catenin signalling (p = 8.71E–03, z-score 0), HIPPO signalling (p = 1.05E–02, z-score 0), BMP signalling pathway (p = 1.20E–02, z-score 1.89), ErbB signalling (p = 1.82E–02, z-score −0.707) and aryl hydrocarbon receptor signalling (p = 2.63E–02, z-score 0.707; ).
BaP-induced transgenerational changes in DNA methylation in the F3 vertebrae
In the F3 vertebrae, 2396 DMRs were found after F0 BaP exposure. 213 DMRs were within promoter regions (hypermethylated: 102 and hypomethylated: 111) and 691 were inside gene bodies (hypermethylated: 336 and hypomethylated: 355) ().
The enriched GO terms (biological processes, ) associated with skeletogenesis were ossification (38 genes, p = 3.65E–09), osteoblast differentiation (25 genes, p = 7.27E–08), regulation of osteoblast differentiation (13 genes, p = 2.52E–04), negative regulation of osteoblast differentiation (7 genes, p = 1.04E–03), skeletal system development (39 genes, p = 1.91E–07), chondrocyte differentiation (15 genes, p = 1.19E–06), bone development (19 genes, p = 1.63E–05), cartilage development (18 genes, p = 3.16E–05), bone morphogenesis (11 genes, p = 1.46E–04), skeletal system morphogenesis (18 genes, p = 1.94E–04), chondrocyte development (5 genes, p = 2.12E–03), regulation of chondrocyte differentiation (6 genes, p = 4.67E–03), regulation of cartilage development (7 genes, p = 5.19E–03), cartilage development involved in endochondral bone morphogenesis (4 genes, p = 9.01E–03), bone remodelling (10 genes, p = 5.74E–04), regulation of bone resorption (6 genes, p = 2.70E–03), bone resorption (7 genes, p = 3.66E–03), regulation of bone remodelling (6 genes, p = 5.69E–03), osteoclast differentiation (10 genes, p = 7.47E–04), notochord development (4 genes, p = 1.80E–03), osteoblast development (4 genes, p = 1.80E–03), biomineralization (13 genes, p = 2.29E–03), bone mineralization (10 genes, p = 3.53E–03), biomineral tissue development (12 genes, p = 5.69E–03), osteoblast proliferation (5 genes, p = 3.81E–03).
The enriched canonical pathways included AMPK signalling (p = 9.55E–07, z-score −0.243), calcium signalling (p = 3.16E–04, z-score −0.535), ErbB signalling (p = 1.07E–03, z-score 0.302), osteoarthritis pathway (p = 4.79E–03, z-score 0.632), hepatocyte growth factor (HGF) signalling (p = 3.399E–02, z-score 0.378), Wnt/Ca+ pathway (p = 3.80E–02, z-score 0.447) and vascular endothelial growth factor (VEGF) signalling (p = 3.89E–02, z-score 0.707) (), where positive z-score and negative z-score indicates the pathway is activated and inactivated, respectively.
Methylation changes across generations
To identify the transmission of DNA methylation status across generations, the DMGs between the two generations were compared. The total number of DMGs in the F3 was higher (904) than that in the F1 (825) (). There were 21 common DMGs with changes in the promoter region methylation and 96 common DMGs with a modified methylation pattern of the gene body in the F1 and F3 generation (). Of the 21 common DMGs with methylation changes in the promoter region, 12 were hypermethylated and 9 were hypomethylated (). Of the 96 common DMGs with methylation changes in the gene body, 37 were hypermethylated and 59 were hypomethylated (). Functional analysis of conserved DMGs showed the enrichment of skeletogenesis-associated biological processes, including chondrocyte differentiation, cartilage development, and skeletal system development (Appendix I). The DMGs consistent in the F1 and F3 were provided in Appendix II.
Figure 3. Venn diagrams for hypermethylated, hypomethylated, and total DMGs in promoter and gene body, showing numbers of common DMGs between the F1 and F3 generations in the BaP treatment.
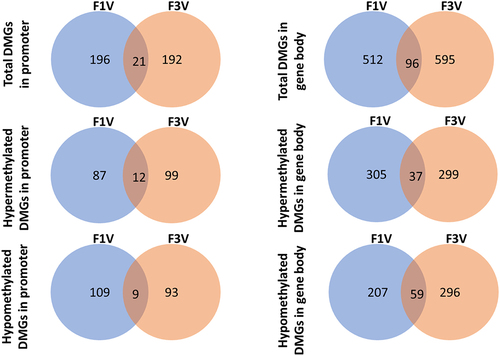
Table 2. Common DMGs and DEGs showing expected methylation difference and expression directions in the F1 vertebrae.
Table 3. Common DMGs and DEGs showing expected methylation difference and expression directions in the F3 vertebrae.
BaP-Induced transcriptional changes in the F1 and F3 vertebrae
The transcriptome profiles of F1 and F3 vertebrae were studied using RNA-seq. 23.5 M and 21.8 M quality trimmed reads were obtained from the samples of the F1 generation, which generated 2.2 Gb and 2.1 Gb clean reads for control and BaP groups, respectively. The analysis of the samples from the F3 generation resulted in 21.8 M and 22.6 M filtered reads, yielding 2.2 Gb clean reads for the F3 control and F3 BaP groups, respectively.
A total of 23,209 transcripts (out of 34,461 mRNAs in the medaka reference genome (ASM31367v1) were identified in the vertebrae of the F1 generation, of which 230 (including up-regulated: 39 and down-regulated: 191, ) were differentially expressed (adjusted p < 0.05). The functional analysis and pathway analysis revealed diverse categories of biological processes and pathways. The selected biological processes and pathways that are involved in skeletogenesis and stimuli responses were plotted (). Only one biological process involved in skeletogenesis was enriched: osteoblast differentiation (7 genes, p = 1.15E–03) (). The significantly enriched IPA canonical pathways included HIPPO signalling (p = 3.63E–03, z-score NA), xenobiotic metabolism PXR signalling pathway (p = 1.41E–02, z-score 2.236) and calcium signalling (p = 1.86E–02, z-score 1.342) ().
Figure 4. Vertebral gene expression changes. Volcano plots showing DEGs in F1 (a) and F3 vertebrae (b). Vertical dashed lines represent the -log10(adjusted p-value) of 0.05. Red and green spots represent statistically up- and down-regulated genes, respectively.
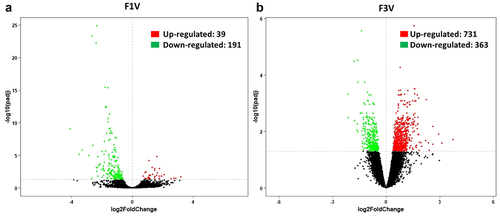
Figure 5. GO terms and ingenuity pathway analysis of DEGs in the F1 (a, b) and F3 (c, d) vertebrae. Left panel includes GO biological process terms and the right panel reveals canonical pathways. Go term analysis was performed on DEGs using Metascape and significant terms were selected with p-value <0.01 and q-value <0.25. Canonical pathway analysis was performed on DEGs by Qiagen IPA tool and statistically significant pathways were filtered at p-value <0.05 level.
In the F3 generation, 23409 genes were identified in the transcriptome and 1094 of them were differentially expressed. Among the 1094 DEGs, 731 were upregulated and 363 downregulated (). The DEGs showed functional enrichment of biological processes and pathways in various categories. Among them, GO enrichment analysis revealed two skeletogenesis biological processes, cartilage condensation (5 genes, p = 5.42E–04) and skeletal system development (34 genes, p = 6.36E–04) (). The significantly enriched canonical pathways by DEGs included calcium signalling (p = 1.20E–08, z-score 0.688), CXCR4 signalling (p = 4.79E–05, z-score 2.5), role of osteoblasts, osteoclasts and chondrocytes in rheumatoid arthritis (p = 2.04E–04, z-score NA), role of macrophages, fibroblasts and endothelial cells in rheumatoid arthritis (p = 1.38E–03, z-score NA), ERK/MAPK signalling (p = 2.24E–03, z-score 0.277), ErbB signalling (p = 2.45E–03, z-score 1.265), AMPK signalling (p = 2.57E–03, z-score 0.707), mTOR signalling (p = 5.13E–03 z-score 1.134), RANK signalling in osteoclasts (p = 5.25E–03, z-score 3), HIPPO signalling (p = 1.32E–02, z-score −1.342), BMP signalling pathway (p = 1.32E–02, z-score 2.828), aryl hydrocarbon receptor signalling (p = 1.74E–02, z-score 1.342), xenobiotic metabolism general signalling pathway (p = 1.74E–02, z-score 0.905), sonic hedgehog signalling (p = 2.09E–02, z-score NA), TGF-beta signalling (p = 2.57E–02, z-score 2.828) and xenobiotic metabolism AHR signalling pathway (p = 3.80E–02, z-score 1.89) ().
Relationship between DMGs and DEGs
In the F1 generation, seven common genes were both significantly differentially methylated and expressed: the amino acid transporter slc43a2 (SLC43A2) showed a negative correlation between promotor DNA methylation and gene expression, and three genes (hypoxia inducible factor (HIF3A), LRRN4 C-terminal-like protein (LRRN4) and myelin basic protein (MBP) showed a positive correlation between gene body methylation and gene expression ().
In the F3 generation, 79 genes had significantly altered DNA methylation and gene expression. Of these, 11 genes showed a negative correlation between promotor DNA methylation and gene expression, and in 20 genes gene body methylation and gene expression were positively correlated ().
Reduced osteoblast population in F1 and F3 vertebrae
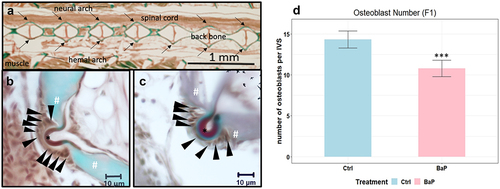
The histomorphometric assessments revealed a significantly reduced OB population after parental BaP exposure in comparison with the control group (p = 0.0006, ).
Figure 6. Representative histology images of Goldner’s trichrome staining for the detection of osteoblasts (black arrowheads), osteoid (asterisks) and mineralized bones (number sign) in adult male Japanese medaka O. latipes. (a) the locations of corresponding cells on the serial tissue sections are indicated by arrows. (b) Representative segment in F1 control. (c) Representative segment in F1 BaP. (d) number of osteoblasts at the intervertebral segments of individuals from the control and ancestral 1 μg/L BaP exposed group in F1; (n = 5; mean ± SD; * and ***: p < 0.05 and 0.001, respectively; Student’s t-test).
Discussion
Whole-genome methylation analysis revealed both CpG- and DMR-specific changes in the DNA methylation profiles of adult fish (F1 and F3) after ancestral exposure to an environmentally relevant BaP concentration. BaP exposure modified DNA methylation patterns in both the promoter regions and gene body regions of the vertebrae genome in the F1 and F3 generation. Over 100 DMGs were consistent in the F1 and F3 generation. Nine DMGs (MAPK14, GLI3, HOXB3, NFIB, SKI, CHST11, KIAA1217, CREB3I2, CST) were enriched in diverse physiological pathways including chondrocyte differentiation, osteoblast differentiation and ossification, which are associated with skeletogenesis in both generations, but did not appear differently regulated in the transcriptome.
Transcriptomic profiling uncovered enrichment of (I) skeletogenesis related pathways (F1, F3); and (II) classical BaP exposure response pathways: activation of xenobiotic metabolism PXR signalling pathway (F1), xenobiotic metabolism general signalling pathway (F3) and aryl hydrocarbon receptor signalling (F3). Although both DMGs and DEGs were enriched in similar or common pathways involved in skeletogenesis, no correlated overlap between DMGs and DEGs was conserved between the F1 and F3 generation. In the F1 generation, SLC43A2 and HIF3a are possibly associated with decreased bone mass. In the F3 generation, chondroitin sulphate synthase 1 (CHSY1), histone deacetylase 7 (HDAC7) and secreted protein acidic and rich in cysteine (SPARC) have a confirmed role during skeletogenesis and a set of 19 were somehow associated with osteoblast differentiation, function and bone mineral density. The results suggest ancestral BaP exposure could alter both DNA methylation and gene expression in the directly exposed offspring (F1) and the unexposed offspring (F3). Moreover, similar methylation patterns were observed in nine loci associated with genes involved in skeletogenesis in the F1 and F3. This corroborates the initial assumption that DNA methylation may play a role in regulating specific gene expressions associated with the transgenerational skeletal deformities upon ancestral BaP exposure. Persistence of the bone phenotype was confirmed with significantly reduced OB numbers in the ancestrally exposed F3 generation, which were previously reported [Citation8,Citation11].
Differential methylation in the F1 vertebrae
In the vertebrae of the F1, genome-wide methylation analysis revealed a variety of DMGs. The enriched biological processes involved in skeletogenesis () are major regulators of osteoblastogenesis and chondrogenesis ().
Figure 7. Relationship between enriched biological process (solid line box) involved in skeletogenesis and potential dysregulated pathways (dash line box; orange colour: activated pathway; white colour: neither activation nor inactivation; grey colour: no predication on status) associated with the biological process in the F1. DMGs involved in specific biological process are presented and only additional genes are indicated in following tier.
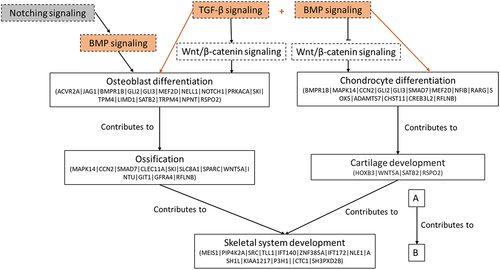
TGF-β signalling and BMP signalling are crucial for osteoblast differentiation, chondrogenesis and bone formation [Citation31,Citation32]. Among the DMGs involved in TGF-β and BMP signalling pathways, type I BMP receptor (BMPR1b) was found to be hypermethylated in the gene body in the F1 vertebrae. BMPR1b is indispensable for chondrogenesis, including chondrocyte condensation, proliferation, differentiation, survival, and function [Citation33]. In addition, the transcription factor Suppressor of Mothers against Decapentaplegic 7 (SMAD7) was hypermethylated in the promoter, which interferes with both TGF-β and BMP signalling [Citation34]. The regulation of skeletogenesis is also controlled by multiple cytokines, which requires dynamic crosstalk between TGF-β and BMP signalling and other signalling pathways, such as hedgehog, Wnt and Notch signalling. For instance, TGF-β can promote Wnt/β-catenin signalling through upregulating the expressions of Wnts (Wnt−2, −4, −5a, −7a, and −10a) [Citation35]. The cooperation of TGF-β and Wnt stimulate the differentiation of both osteoblast and chondrocyte [Citation36]. Among the DMGs associated with Wnt/β-catenin signalling, Wnt5a was hypermethylated in the gene body. In contrast to positive regulatory role of TGF-β, BMPs can inhibit Wnt signalling in osteoblast via BMPR1a, which negatively regulate bone mass [Citation37]. BMP-induced osteoblast differentiation can be stimulated by notch activation [Citation38], while TGF-β and BMP2 can coordinate expression of notch signalling proteins [Citation39]. Jagged Canonical Notch Ligand 1 (Jag1) and Neurogenic locus notch homolog protein 1 (Notch1) were found to be hypermethylated in the gene body and they are required for triggering Notch signalling [Citation40]. Evidence of jag1 participating in bone development in fish is limited, but the gene is required for normal trabecular bone formation in mice [Citation41]. Both TGF-β and BMP signalling were found to be activated, which suggested a positive regulation towards osteoblastogenesis and chondrogenesis. However, histomorphometric assessments revealed a significant reduction in osteoblast numbers (). Compensatory changes have also been observed in rockfish with increasing BaP exposure concentrations upon direct exposure [Citation42]. Thus, the observed elevated TGF-β and BMP signalling might present a compensatory response to re-establish bone homoeostasis, which is impacted by ancestral BaP exposure.
PAHs, including BaP, have been reported to induce expression changes of genes involved in detoxification pathways [Citation43,Citation44]. BaP-responsive pathways (xenobiotic metabolism CAR signalling pathway, xenobiotic metabolism PPAR signalling pathway and aryl hydrocarbon receptor signalling) were persistently activated in both the F1 and F3 generation. The constitutive androstane receptor (CAR), pregnane X receptor (PXR) and aryl hydrocarbon receptor (AHR) are evolutionary conserved cellular sensors for both endogenous and exogenous stimuli and modulate numerous genes involved in a wide range of cellular processes, such as cell growth, differentiation, metabolism and stress response [Citation45]. The AhR plays a confirmed role in bone homoeostasis and direct exposure experiments revealed a concomitant deregulation of AhR and bone genes in fish [Citation46, Citation47]. In the three BaP-responsive pathways, Glutathione S-Transferase Omega 2 (GSTO2), UDP Glucuronosyltransferase Family 1 Member A3 (UGT1a3), Superoxide dismutase 3 (SOD3) and Sulfotransferase Family 1A Member 1 (SULT1a1) were differentially methylated. All of them are part of the chemical defensome defined for model fish and their transcript changes have been reported in response to direct BaP exposure in fish [Citation48,Citation49].
Differential methylation in the F3 vertebrae
The enriched GO terms related to skeletogenesis in the F3 generation () were classified into three categories: (I) osteoblastogenesis, (II) chondrocytogenesis and (III) osteoclastogenesis (). During osteoblastogenesis, the inactivation of AMPK signalling may point towards negatively regulated bone formation in the F3. Previous studies have shown that osteoblast differentiation and bone mineralization could be positively regulated by AMPK activation [Citation50,Citation51]. The calcium signalling which is associated with osteoblast differentiation was significantly inhibited in the F3 methylome. Ca2+ is a prominent and ubiquitous intracellular messenger that is responsible for guiding numerous cellular processes [Citation52]. Many of its cellular regulation, which includes osteoblast proliferation and differentiation, are orchestrated by the Ca2+ binding protein, calmodulin (CaM). The CaM-dependent kinase II (CAMKII) was found to interact with the osteoblast-specific transcription factor OSX, and enhanced the transcriptional activity and protein levels of OSX during osteoblast differentiation [Citation53]. Deregulation of calcium signalling is corroborated by the hypomethylation of calcium/calmodulin-dependent protein kinase (camk1d and camk2b), which might lead to silencing of these genes. The third inactivated pathway enriched by DMGs in the F3 was VEGF signalling. VEGF can regulate osteoblast differentiation and bone formation from periosteal progenitor cells [Citation54]. The observed DMGs providing a possible molecular explanation for the reduced osteoblast differentiation and activity in response to ancestral BaP exposure.
Figure 8. Relationship between enriched biological process (solid line box) involved in skeletogenesis and potential dysregulated pathways (dash line box; orange colour: activated pathway; blue colour: inactivated pathway) associated with the biological process in the F3. DMGs involved in specific biological process are presented and only additional genes are indicated in following tier.
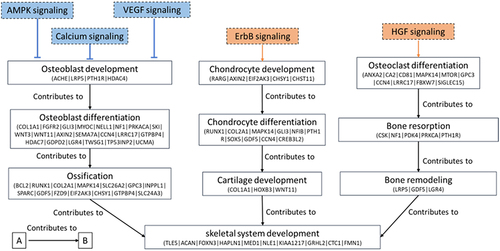
Regarding chondrocytogenesis, activation of ErbB signalling was revealed. Erb-B2 Receptor Tyrosine Kinase 4 (ErbB4, hypomethylated in the gene body), one of the receptors inducing ErbB signalling, is expressed in chondrocytes and has been reported to play a role in chondrocyte growth and differentiation [Citation55]. Ancestral BaP exposure-induced perturbed chondrocyte differentiation was suggested to lead to defective notochord sheath and further disrupted bone formation in developing larvae [Citation11].
In terms of osteoclastogenesis, the activation of HFG signalling in the F3 generation implied that osteoclastogenesis was promoted and subsequently increased in bone resorption. HGF influences various responses in numerous cells including epithelial cells, osteoblasts and osteoclasts, with a confirmed role in osteoclastogenesis [Citation56]. Jiezhang [Citation8] found significant reduction of bone thickness in the male fish of F3 generation following ancestral BaP exposure. The balance between bone formation and bone resorption determines whether the skeleton undergoes normal development. The BaP-induced transgenerational bone phenotype suggest that bone homoeostasis was skewed towards bone resorption by either inhibited bone formation or promoted bone resorption or both. The number of osteoblasts was significantly reduced in the BaP-derived F3 individuals, which could partially explain the bone thinning. The here described methylation changes in the F3 vertebrae indicate that reduced bone thickness could be attributed to the downregulation of bone formation and upregulation of bone resorption, which is in-line with the transcriptome [Citation9].
Conservation of DMGs during skeletogenesis in the F1 and F3 vertebrae
To unravel epigenetic regulation and regulated genes responsible for the bone phenotype inheritance, the data were mined for conserved methylation pattern changes. The comparison of DMGs between the F1 and F3 generation revealed 117 conserved DMGs (). Nine of them were associated with the biological process skeletal system development (Appendix I): mitogen-activated protein kinase 14 (MAPK14), GLI family zinc finger 3 (GLI3), homeobox B3 (HOXB3), nuclear factor I B (NFIB), SKI Proto-Oncogene (SKI), carbohydrate sulfotransferase 11 (CHST11), sickle tail protein homolog (KIAA1217), cAMP responsive element-binding protein 3-like 2 (CREB3L2) and CTS telomere maintenance complex component 1 (CTC1). MAPK14 is a key factor for OSX and RUNX2 phosphorylation to regulate osteoblast activity and subsequently affects bone mineralization [Citation57,Citation58]. GLI3 is associated with bone development and serves as a key effector for hedgehog signalling in the developing skeleton [Citation59]. HOXB3 has been identified as a candidate gene for bone growth and development in chicken [Citation60]. NFIB is an important regulator of the Insulin-like growth factor-binding protein 5 expression in osteoblasts, and thus, plays a critical role in osteoblast proliferation, differentiation, and survival as well as cartilage development [Citation61]. SKI is one of the SMAD-interacting proteins that negatively regulate the TGF-β signalling pathway during tissue homoeostasis [Citation62]. CHSTT11 expression is required for proper chondroitin sulphate location, modulation of TGF- β and BMP signalling and cartilage development [Citation63]. KIAA1217 deregulation has resulted in vertebral malformations in mammals [Citation64]. Mutations in CREB3L2 induced skeletal deformities during zebrafish development through impacted notochord sheath cells [Citation65], while CTC1 has been associated with the clinical feature of recurrent bone fractures [Citation66].
In general, conserved methylation pattern between F1 and F3 generation have been reported in other ecotoxicological transgenerational studies [Citation67,Citation68]. These consistently differently methylated genes are potential markers for bone phenotype inheritance and bone health over generations in response to ancestral BaP exposure.
Differential transcription in the F1 and F3 vertebrae
The transcriptome data further confirmed the BaP-induced transgenerational dysregulation of biological processes involved in skeletogenesis, including osteoblast differentiation in the F1 () and cartilage condensation and skeletal system development in the F3 (). Of the seven differently regulated genes involved in osteoblast differentiation (ACHE, LRP3, NPPC, PENK, SEMA4d, GDPD2 and TP53INP2) in the F1 vertebrae, six of them play specific roles in promoting osteoblast differentiation. The expression pattern in the bone tissue of the ancestrally exposed individuals suggested an inhibited osteoblastogenesis event during skeletogenesis possibly responsible for the significantly reduced osteoblast number. Both ACHE (down-regulated) and TP53INP2 (down-regulated) play a role in facilitating osteoblast differentiation and mineralization in vitro by activating Wnt/β-catenin signalling [Citation69–71]. LRP3, an LRP family member, was found to be inhibited and possibly indicative for reduced osteogenesis [Citation72]. C-type natriuretic peptide (NPPC, down-regulated) was found to stimulate osteoblast proliferation and collagen-X expression [Citation73] and preproenkephalin (PENK, down-regulated) was reported to be involved in bone mineralization in mice [Citation74]. Glycerophosphodiester phosphodiesterase domain containing 2 (GDPD2) was found to be inhibited after parental BaP exposure, which serve as an osteoblast differentiation-promoting factor in the mouse osteoblast-like cells [Citation75]. Semaphorin 4D (SEMA4d, down-regulated) promotes bone resorption by inhibiting the function of osteoblasts [Citation76].
In the F3 generation, a larger number of DEGs were observed compared to the F1 generation suggesting that ancestral BaP exposure had a more comprehensive impact on the unexposed offspring. The F3 transcriptome data are discussed at an extent in Jiezhang [Citation9]. DEG-enriched GO biological processes and IPA canonical pathways were critical to skeletogenesis (e.g., cartilage condensation, calcium signalling, AMPK signalling, mTOR signalling, RANK signalling in osteoclasts, BMP signalling, AhR signalling, TGF-beta signalling; ).
To determine if transcriptional changes were persistent between the F1 and F3 generation, a comparison was made between the DEGs of the F1 and F3 with over four times more DEGs identified in the F3 than in the F1 generation vertebrae but no conserved gene expression pattern, which is in line with other transgenerational studies. Nguyen et al. [Citation77] reported that maternal intake of high-fat food during pregnancy of F0 induced more changes in the transcriptome of the F3 than the F1 generation, suggesting different mechanisms of inheritance in the F1 and F3 generation. Jing et al. [Citation68], found that ancestral TCDD exposure of F0 pregnant rats caused a greater decrease in mRNA expression of the hepatic insulin-like growth factor 2 in the F3 than in the F1 offspring. Notwithstanding, the transcriptome of the F1 and F3 generation reveal the deregulation of the same biological processes, indicating the importance of functional pathways versus individual marker gene expression for tissue and organism-level phenotypes.
Integrated methylome and gene expression analysis reveals potential methylation driven transcriptome changes in the F3 vertebral deformities
DNA methylation has been proposed to be one of the pivotal epigenetic mechanisms through which environmental stressor exposure of one generation can lead to persistent phenotypic changes in the subsequent generations. The presented data revealed only a small number of DMGs, which were also differentially expressed per generation, which is consistent with recent studies showing a small degree of overlap between DEGs and DMGs due to environmental stressors including increased temperature in fish [Citation78,Citation79] and chemical exposure in fish [Citation80].
It is suspected that BaP exposure-induced double-strand breaks are guided by the DNA methylation pattern and thus occur more often in methylated DNA sequences [Citation81]. Direct BaP exposure induces dynamic, sequence-specific hypo- and hypermethylation events as demonstrated in human cell lines, affects DNA methyltransferase activity and the BaP metabolite benzo[a]pyrene-trans−7,8-dihydriol−9,10-epoxide has a binding preference for methylated DNA [Citation82–84]. Recent research in mice has highlighted that BaP-induced modification may affect the methylation profile of imprinting genes in sperm, which was partly persistent upon the F2 generation [Citation85]. There is mounting evidence that enhancement of the AHR mediated pathway is further promoting DNA hypomethylation, indicating that the AHR activation is modulating DNA methylation pattern in response to stress, which are proposed to be ‘fixed’ upon long-term exposure [Citation86]. The here described differential methylation pattern and transcriptional regulation of the Bap-responsive pathways in the F1 and F3 corroborate the hypothesis that the AHR may regulate the DNA methylation over generations in a tissue-specific manner [Citation87,Citation88].
No conserved DMGs/DEGs were identified between the F1 and the F3 generation. The poor correlation between DNA methylation and gene expression indicates a potential role of DNA methylation on trans-acting elements that mediate gene transcription. DMRs could be located on regulatory elements that are outside of the gene regions used in this study (4 kb upstream to TES), or the inheritance of bone deformities upon ancestral BaP exposure on gene expression may be not due to DNA methylation but might be attributed to changes in histone modification or miRNA abundance. It has to be noted that the present methylome data originate from a preliminary screen with reduced replication.
In the F1 generation, the amino acid transporter 43A2 (SLC43A2), hypoxia-inducible factor (HIF3a), LRRN4 C-terminal-like protein (LRRNC4CL) and myelin basic protein (MBP) () showed a correlation between de/methylation and expression. Transcription of the methionine transporter SLC43A2 has not been reported in osteoblasts, but methionine restriction affects osteoblast differentiation and bone mineralization in a male-biased manner [Citation89]. Hypoxia inducible factors are a potential target for low bone mass treatment regulating osteoblastogenesis, although HIF3a expression has not been measured in bone tissue, HIF3 is thought to regulate HIF1/2 activity [Citation90–92].
No function for LRRN4CL and MBP were specifically reported for bone tissue and osteoblast function and differentiation. The results indicate that DNA methylation is not the sole epigenetic factor responsible for the observed bone phenotype in the ancestrally BaP-exposed F1 generation.
In the F3 generation, 33 genes showed the expected correlation (), out of which secreted protein acidic and rich in cysteine (SPARC), chondroitin sulphate synthase 1 (CHSY1), and histone deacetylase 7 (HDAC7) were considered the most interesting for the presented inherited bone phenotype. SPARC is among the most abundant non-collagenous proteins expressed in mineralized tissues and is secreted by osteoblasts during bone formation [Citation93]. SPARC is one of the marker genes for the osteoblast lineage [Citation94] and is involved in osteoblast differentiation and mineral incorporation in the bone matrix [Citation95]. In medaka, SPARC is present during the onset of bone development and regulates sclerotomal cell migration to the notochord [Citation96]. The downregulation of SPARC may be responsible for the inhibited osteoblastogenesis and lead to the observed reduced osteoblast number in the tissue sections of BaP-derived F3 offspring, which is corroborated by reports that SPARC polymorphism with idiopathic osteoporosis in men [Citation97]. CHSY1 is required for bone development and CHSY1 null mice exhibited a defect in chondrogenesis and delayed endochondral ossification [Citation98]. Up-regulation of CHSY1 was found in the F3, suggesting a positive effect on chondrogenesis and hampering osteoblast differentiation. During bone resorption, HDAC7 plays a repressive role in osteoclast formation and is needed for osteoblast maturation [Citation99]. In mice, conditional deletion of HDAC7 promoted osteoclast formation in vivo, associated with increased bone resorption and lower bone mass [Citation100]. As a result, inhibited expression of HDAC7 might lead to an enhancement in osteoclast formation possibly entailing increased bone resorption. In addition, HDAC7 represses RUNX2 mediated histone acetylation, thus, impacting osteoblastic lineage commitment [Citation101,Citation102].
A literature review further revealed potential functional involvement of the identified differentially methylated and expressed genes in the ancestrally exposed F3 male fish. CD81, FAM171B, TJP1 and FREM2 have been demonstrated to be expressed in osteoblast and play a role in osteoblast differentiation and proliferation [Citation103–107]. LDHB is a major regulator of osteoblast lactate metabolism, whose inhibition affects osteoblast differentiation in a sex-specific manner, while its expression is downregulated in osteoclasts during bone resorption [Citation108–110]. CST3 is an osteoclast coupling factor regulating osteoblast differentiation [Citation94,Citation111]. ANK2and SRCIN are regulators of osteoblast and osteoclast differentiation, and deficiency of the former has been associated with reduced bone mass and calcification [Citation112–114]. GNA13 deficiency results in osteoclast hyperactivation, while upregulation may protect from pathological bone loss [Citation115]. NDUFS2 is part of the mitochondrial complex I assembly, which has been demonstrated to have an osteoclastogenic effect and is controlled by oestrogen receptors [Citation116].
RNF220 suppresses GLI3 processing and enhances its degradation, thus affecting the SHH signalling while promoting the WNT/β-catenin signalling [Citation117–119]. SHISA6 is a WNT/β-catenin signalling inhibitor, although its role in bone tissue or bone cells has not been described. GFAP, SLC38A4 and UQCC1 are regulation of bone development and growth [Citation120] [Citation107,Citation121–123]. LLGL1 and NPDC1, are crucial factors for bone repair and potential candidate gene for fracture risk assessment in humans [Citation124,Citation125] and NDFIP1 is a regulator of bone development and repair through the BMP2/TGF-β pathway [Citation126]. TTC28 and WNK1 expression is correlated with bone mineral density in mammals [Citation127,Citation128]).
Overall, the observed methylation and transcriptome changes, although not on the same genes, but in the same skeletogenesis pathways, indicate an ancestrally BaP exposure-induced transition from osteoblastogenesis towards chondrocyte differentiation, as these cells originate from the same sclerotome progenitors. The reduction of osteoblast numbers in both generations (reported here and in [Citation8,Citation9]) may result in a lack of osteoblastic mediator release to orchestrate osteoclastogenesis and bone resorption. Moreover, direct Bap exposure resulted in impaired stem cell self-renewal, cell replication and differentiation in multiple in vitro studies affecting cell growth and function [Citation129–132]. Changes on the cell subpopulation levels may be responsible for modified gene expression, which are not driven by DNA methylation, and aberrant DNA methylation, which is not affecting gene expression in adult male fish [Citation133], resulting in the here observed reduced alignment between gene expression and DNA methylation. As demonstrated by our group, the persistent impact of ancestral BaP exposure has developmental origins, thus, it is hypothesized that differential DNA methylation and changed gene expression are downstream compensation mechanisms in the adult tissue, which may be variable between generations. Moreover, the modification of DNA methylation and gene expression may have different origins, furthering the idea of the multidimensional nature of transcriptomes and methylomes in response to cellular and micro-environment [Citation134]. Blake et al. [Citation135] stated that conserved tissue-specific gene expression levels are more likely to be regulated through DNA methylation, which may account for same pathways found enriched in this study.
The data highlight the need for cell population- and differentiation stage-specific analyses to possible decipher cause–effect relationships between osteoblasts, osteoclast and chondrocytes. SPARC, CHSY1 and HDAC7 are highlighted for further investigation of this transgenerational bone phenotype.
Conclusion
The present study demonstrated the vertebral DNA methylation and concomitant gene expression changes in medaka fish with skeletal deformities after an ancestral BaP exposure. It is known that transgenerational effects can be regulated by different epigenetic mechanisms, including DNA methylation. However, genome-wide DNA methylation profiling and their relationship with corresponding gene expressions in the deformed bone were still lacking. The results suggest that the effects of ancestral BaP exposure on DNA methylation are distinct from gene expression changes, especially in the directly exposed generation (F1). The weak correlation between the degree of methylation changes and gene expression of overlapping DMR-associated genes and DEGs suggests that the regulation of gene expression is complex and DNA methylation alone is not enough to regulate the expressions of observed DEGs. However, DNA methylation in bone was still found to play an important role in BaP-induced skeletal deformities by mediating the bone-related physiological pathways and/or biological processes in a multigenerational and transgenerational manner. Additionally, transcriptional expressions of SPARC and HDAC7 were probably regulated by DNA methylation, which can serve as candidate markers for bone formation and resorption, respectively, during BaP-induced transgenerational skeletal deformities. Confirmation is needed if these DNA methylation changes originate from the germ lines.
Acknowledgements
The authors would like to acknowledge the generosity of Prof. Christoph Winkler of the National University of Singapore in providing us with the transgenic medaka fish line used in this study; Dr K. M. Cheung for his guidance on bioinformatics; Ms. K. L. Wong for help with fish dissection.
Disclosure statement
No potential conflict of interest was reported by the authors.
Data availability statement
Raw reads of the methylome have been deposited in NCBI’s BioProject accession number PRJNA845945. The RNA sequencing raw data of this study have been submitted to the NCBI Sequence Read Archive (SRA) (http://www.ncbi.nlm.nih.gov/sra) under the accession number PRJNA757563
Additional information
Funding
References
- Reynaud S, Deschaux P. The effects of polycyclic aromatic hydrocarbons on the immune system of fish: a review. Aquatic Toxicol. 2006;77(2):229–26. doi: 10.1016/j.aquatox.2005.10.018
- Abdel-Shafy HI, Mansour MS. A review on polycyclic aromatic hydrocarbons: source, environmental impact, effect on human health and remediation. Egypt J Pet. 2016;25(1):107–123. doi: 10.1016/j.ejpe.2015.03.011
- Chepelev NL, Moffat ID, Bowers WJ, et al. Neurotoxicity may be an overlooked consequence of benzo [a] pyrene exposure that is relevant to human health risk assessment. Mutat Res/Rev Mutat Res. 2015;764:64–89.
- Madeen EP, Williams DE. Environmental PAH exposure and male idiopathic infertility: a review on early life exposures and adult diagnosis. Rev Environ Health. 2017;32(1–2):73–81. doi: 10.1515/reveh-2016-0045
- Au DWT. The application of histo-cytopathological biomarkers in marine pollution monitoring: a review. Mar Pollut Bull. 2004;48(9–10):817–834. doi: 10.1016/j.marpolbul.2004.02.032
- Corrales J, Thornton C, White M, et al. Multigenerational effects of benzo [a] pyrene exposure on survival and developmental deformities in zebrafish larvae. Aquatic Toxicol. 2014;148:16–26.
- Zhao Y, Luo K, Fan Z, et al. Modulation of benzo [a] pyrene-induced toxic effects in Japanese medaka (Oryzias latipes) by 2, 2′, 4, 4′-tetrabromodiphenyl ether. Environ Sci Technol. 2013;47(22):13068–13076.
- Jiezhang M, Au DW, Wan MT, et al. Multigenerational impacts of benzo [a] pyrene on bone modeling and remodeling in medaka (Oryzias latipes). Environ Sci Technol. 2020;54(19):12271–12284.
- Mo Jiezhang, Wan MT, Au DW, et al. Transgenerational bone toxicity in F3 medaka (Oryzias latipes) induced by ancestral benzo [a] pyrene exposure: cellular and transcriptomic insights. J Environ Sci. 2023;127:336–348.
- Seemann F, Jeong CB, Zhang G, et al. Ancestral benzo [a] pyrene exposure affects bone integrity in F3 adult fish (Oryzias latipes). Aquatic Toxicol. 2017;183:127–134. doi: 10.1016/j.aquatox.2016.12.018
- Seemann F, Peterson DR, Witten PE, et al. Insight into the transgenerational effect of benzo [a] pyrene on bone formation in a teleost fish (Oryzias latipes). Comparative Biochemistry And Physiology Part C: Toxicology & Pharmacology. 2015;178:60–67. doi: 10.1016/j.cbpc.2015.10.001
- Ho DH, Burggren WW. Epigenetics and transgenerational transfer: a physiological perspective. J Exp Biol. 2010;213(1):3–16. doi: 10.1242/jeb.019752
- SKInner MK. What is an epigenetic transgenerational phenotype?: f3 or F2. Reprod Toxicol. 2008;25(1):2–6. doi: 10.1016/j.reprotox.2007.09.001
- Fang X, Corrales J, Thornton C, et al. Global and gene specific DNA methylation changes during zebrafish development. Comp Biochem Physiol Part B Biochem Mol Biol. 2013;166(1):99–108. doi: 10.1016/j.cbpb.2013.07.007
- Knecht AL, Truong L, Marvel SW, et al. Transgenerational inheritance of neurobehavioral and physiological deficits from developmental exposure to benzo [a] pyrene in zebrafish. Toxicol Appl Pharmacol. 2017;329:148–157.
- Wan, T., Au, D.W.T., Mo, J., Chen, L., Cheung, K.M., Kong, R.Y.C. and Seemann, F. Assessment of parental benzo [a] pyrene exposure-induced cross-generational neurotoxicity and changes in offspring sperm DNA methylome in medaka fish. Environmental Epigenetics; 2022
- Bioinformatics, Babraham. FastQC: a quality control tool for high throughput sequence data. Cambridge (UK): Babraham Institute; 2011
- Felix K, Andrews SR. Bismark: a flexible aligner and methylation caller for Bisulfite-Seq applications. Bioinformatics. 2011;27(11):1571–1572. doi: 10.1093/bioinformatics/btr167
- Team, R.C. R: a language and environment for statistical computing. R Foundation for Statistical Computing Vienna (Austria); 2013. Available from: http://www.R-project.org/.
- Hao W, Xu T, Feng H, et al. Detection of differentially methylated regions from whole-genome bisulfite sequencing data without replicates. Nucleic Acids Res. 2015;43(21):e141–e141. doi: 10.1093/nar/gkv715
- Yang J-X, Xie P, Li Y-S, et al. Osteoclast-derived miR-23a-5p-containing exosomes inhibit osteogenic differentiation by regulating Runx2. Cell Signal. 2020;70:109504. doi: 10.1016/j.cellsig.2019.109504
- Singer BD. A practical guide to the measurement and analysis of DNA methylation. Am J Respir Cell Mol Biol. 2019;61(4):417–428. doi: 10.1165/rcmb.2019-0150TR
- Chen M, Ruan R, Zhong X, et al. Comprehensive analysis of genome‐wide DNA methylation and transcriptomics between ovary and testis in Monopterus albus. Aquacult Res. 2021;52(11):5829–5839. doi: 10.1111/are.15457
- Zhou Y, Zhou B, Pache L, et al. Metascape provides a biologist-oriented resource for the analysis of systems-level datasets. Nat Commun. 2019;10(1):1–10. doi: 10.1038/s41467-019-09234-6
- Kim D, Paggi JM, Park C, et al. Graph-based genome alignment and genotyping with HISAT2 and HISAT-genotype. Nature Biotechnol. 2019;37(8):907–915. doi: 10.1038/s41587-019-0201-4
- Yang L, Smyth GK, Shi W. The Subread aligner: fast, accurate and scalable read mapping by seed-and-vote. Nucleic Acids Res. 2013;41(10):e108–e108. doi: 10.1093/nar/gkt214
- Love MI, Huber W, Anders S. Moderated estimation of fold change and dispersion for RNA-seq data with DESeq2. Genome Bio. 2014;15(12):1–21. doi: 10.1186/s13059-014-0550-8
- Kong RYC, Giesy JP, Wu RSS, et al. Development of a marine fish model for studying in vivo molecular responses in ecotoxicology. Aquatic Toxicol. 2008;86(2):131–141. doi: 10.1016/j.aquatox.2007.10.011
- Shanthanagouda AH, Guo B-S, Ye RR, et al. Japanese medaka: a non-mammalian vertebrate model for studying sex and age-related bone metabolism in vivo. PLoS ONE. 2014;9(2):e88165. doi: 10.1371/journal.pone.0088165
- Qu W, Hashimoto S-I, Shimada A, et al. Genome-wide genetic variations are highly correlated with proximal DNA methylation patterns. Genome Res. 2012;22(8):1419–1425. doi: 10.1101/gr.140236.112
- Chen G, Deng C, Yi-Ping L. TGF-β and BMP signaling in osteoblast differentiation and bone formation. Int J Biol Sci. 2012;8(2):272. doi: 10.7150/ijbs.2929
- Thielen NG, van der Kraan PM, van Caam AP. TGFβ/BMP signaling pathway in cartilage homeostasis. Cells. 2019;8(9):969. doi: 10.3390/cells8090969
- Yoon BS, Ovchinnikov DA, Yoshii I, et al. Bmpr1a and Bmpr1b have overlapping functions and are essential for chondrogenesis in vivo. Proc Natl Acad Sci, USA. 2005;102(14):5062–5067. doi: 10.1073/pnas.0500031102
- Moustakas A, Heldin C-H. The regulation of TGFβ signal transduction. Development. 2009;136(22):3699–3714. doi: 10.1242/dev.030338
- Zhou S, Eid K, Glowacki J. Cooperation between TGF‐β and Wnt pathways during chondrocyte and adipocyte differentiation of human marrow stromal cells. J Bone Mineral Res. 2004;19(3):463–470. doi: 10.1359/JBMR.0301239
- Zhou S. TGF‐β regulates β‐catenin signaling and osteoblast differentiation in human mesenchymal stem cells. J Cell Biochem. 2011;112(6):1651–1660. doi: 10.1002/jcb.23079
- Kamiya N, Kobayashi T, Mochida Y, et al. Wnt inhibitors Dkk1 and Sost are downstream targets of BMP signaling through the type IA receptor (BMPRIA) in osteoblasts. J Bone Mineral Res. 2010;25(2):200–210. doi: 10.1359/jbmr.090806
- Tezuka K, Yasuda M, Watanabe N, et al. Stimulation of osteoblastic cell differentiation by Notch. J Bone Mineral Res. 2002;17(2):231–239. doi: 10.1359/jbmr.2002.17.2.231
- De Jong DS, Steegenga WT, Hendriks JMA, et al. Regulation of Notch signaling genes during BMP2-induced differentiation of osteoblast precursor cells. Biochem Biophys Res Commun. 2004;320(1):100–107. doi: 10.1016/j.bbrc.2004.05.150
- Hozumi K. Distinctive properties of the interactions between Notch and Notch ligands. Deve Growth Differ. 2020;62(1):49–58. doi: 10.1111/dgd.12641
- Youngstrom DW, Dishowitz MI, Bales CB, et al. Jagged1 expression by osteoblast-lineage cells regulates trabecular bone mass and periosteal expansion in mice. Bone. 2016;91:64–74. doi: 10.1016/j.bone.2016.07.006
- Chengyong H, Wang C, Zhou Y, et al. Embryonic exposure to benzo (a) pyrene influences neural development and function in rockfish (Sebastiscus marmoratus). Neurotoxicology. 2012;33(4):758–762. doi: 10.1016/j.neuro.2012.01.002
- Goedtke L, John A, Lampen A, et al. Mixture effects of food-relevant polycyclic aromatic hydrocarbons on the activation of nuclear receptors and gene expression, benzo [a] pyrene metabolite profile and DNA damage in HepaRG cells. Food Chem Toxicol. 2021;147:111884.
- Luckert C, Ehlers A, Buhrke T, et al. Polycyclic aromatic hydrocarbons stimulate human CYP3A4 promoter activity via PXR. Toxicol Lett. 2013;222(2):180–188. doi: 10.1016/j.toxlet.2013.06.243
- Mackowiak B, Wang H. Mechanisms of xenobiotic receptor activation: direct vs. indirect. Biochimica Et Biophysica Acta (BBA)-Gene Regulatory Mechanisms. 2016;1859(9):1130–1140. doi: 10.1016/j.bbagrm.2016.02.006
- Olsvik PA, Hansen BH, Nordtug T, et al. Transcriptional evidence for low contribution of oil droplets to acute toxicity from dispersed oil in first feeding Atlantic cod (Gadus morhua) larvae. Comp Biochem Physiol Part C Toxicol Pharmacol. 2011;154(4):333–345. doi: 10.1016/j.cbpc.2011.07.002
- Torvanger I, Metz JR, Olsvik PA, et al. Benzo (a) pyrene reduces osteoclast and osteoblast activity in ex‐vivo scales of zebrafish (Danio rerio [Hamilton‐Buchanan, 1822]) and goldfish (Carassius auratus [Linnaeus, 1758]). J Appl Ichthyol. 2018;34(2):431–439.
- Eide M, Zhang X, Karlsen OA, et al. The chemical defensome of five model teleost fish. Sci Rep. 2021;11(1):1–13. doi: 10.1038/s41598-021-89948-0
- Fang X, Corrales J, Thornton C, et al. Transcriptomic changes in zebrafish embryos and larvae following benzo [a] pyrene exposure. Toxicol Sci. 2015;146(2):395–411. doi: 10.1093/toxsci/kfv105
- Jang WG, Kim EJ, Lee K-N, et al. AMP-activated protein kinase (AMPK) positively regulates osteoblast differentiation via induction of Dlx5-dependent Runx2 expression in MC3T3E1 cells. Biochem Biophys Res Commun. 2011;404(4):1004–1009. doi: 10.1016/j.bbrc.2010.12.099
- Kanazawa I, Yamaguchi T, Yano S, et al. Activation of AMP kinase and inhibition of Rho kinase induce the mineralization of osteoblastic MC3T3-E1 cells through endothelial NOS and BMP-2 expression. Am J Physiol Endocrinol Metab. 2009;296(1):E139–E146. doi: 10.1152/ajpendo.90677.2008
- Zayzafoon M. Calcium/Calmodulin signaling controls osteoblast growth and differentiation. J Cell Biochem. 2006;97(1):56–70. doi: 10.1002/jcb.20675
- Choi YH, Choi J-H, Oh J-W, et al. Calmodulin-dependent kinase II regulates osteoblast differentiation through regulation of Osterix. Biochem Biophys Res Commun. 2013;432(2):248–255. doi: 10.1016/j.bbrc.2013.02.005
- Kai H, Olsen BR. Osteoblast-derived VEGF regulates osteoblast differentiation and bone formation during bone repair. J Clin Investig. 2016;126(2):509–526. doi: 10.1172/JCI82585
- Nawachi K, Inoue M, Kubota S, et al. Tyrosine kinase-type receptor ErbB4 in chondrocytes: interaction with connective tissue growth factor and distribution in cartilage. FEBS Lett. 2002;528(1–3):109–113. doi: 10.1016/S0014-5793(02)03263-5
- Adamopoulos IE, Xia Z, Lau YS, et al. Hepatocyte growth factor can substitute for M-CSF to support osteoclastogenesis. Biochem Biophys Res Commun. 2006;350(2):478–483. doi: 10.1016/j.bbrc.2006.09.076
- Greenblatt MB, Shim JH, Zou W, et al. The p38 MAPK pathway is essential for skeletogenesis and bone homeostasis in mice. J Clin Investig. 2010;120(7):2457–2473. doi: 10.1172/JCI42285
- Xin B-C, Wu QS, Jin S, et al. Berberine promotes osteogenic differentiation of human dental pulp stem cells through activating EGFR-MAPK-Runx2 pathways. Pathol Oncol Res. 2019;26(3):1–9. doi: 10.1007/s12253-019-00746-6
- Hilton MJ, Tu X, Cook J, et al. Ihh controls cartilage development by antagonizing GLI3, but requires additional effectors to regulate osteoblast and vascular development. Development. 2005;132(19):4339–4351. doi: 10.1242/dev.02025
- Li YD, Liu X, Li ZW, et al. A combination of genome-wide association study and selection signature analysis dissects the genetic architecture underlying bone traits in chickens. Animal. 2021;15(8):100322. doi: 10.1016/j.animal.2021.100322
- Pérez-Casellas LA, Wang X, Howard KD, et al. Nuclear factor I transcription factors regulate IGF binding protein 5 gene transcription in human osteoblasts. Biochimica Et Biophysica Acta (BBA)-Gene Regulatory Mechanisms. 2009;1789(2):78–87. doi: 10.1016/j.bbagrm.2008.08.013
- Deheuninck J, Luo K. SKI and SnoN, potent negative regulators of TGF-β signaling. Cell Res. 2009;19(1):47–57. doi: 10.1038/cr.2008.324
- Kluppel M, Wight TN, Chan C, et al. Maintenance of chondroitin sulfation balance by chondroitin-4-sulfotransferase 1 is required for chondrocyte development and growth factor signaling during cartilage morphogenesis. Development. 2005;132(17):3989–4003. doi: 10.1242/dev.01948
- Al Dhaheri N, Wu N, Zhao S, et al. KIAA1217: a novel candidate gene associated with isolated and syndromic vertebral malformations. Am J Med Genet A. 2020;182(7):1664–1672. doi: 10.1002/ajmg.a.61607
- Melville DB, Montero-Balaguer M, Levic DS, et al. The feelgood mutation in zebrafish dysregulates COPII-dependent secretion of select extracellular matrix proteins in skeletal morphogenesis. Dis Models Mech. 2011;4(6):763–776. doi: 10.1242/dmm.007625
- Sargolzaeiaval F, Zhang J, Schleit J, et al. CTC 1 mutations in a Brazilian family with progeroid features and recurrent bone fractures. Mol Gene Genomic Med. 2018;6(6):1148–1156. doi: 10.1002/mgg3.495
- Assis D, Warri A, Sonia A, et al. High-fat or ethinyl-oestradiol intake during pregnancy increases mammary cancer risk in several generations of offspring. Nat Commun. 2012;3(1):1–9. doi: 10.1038/ncomms2058
- Jing M, Chen X, Liu Y, et al. Ancestral TCDD exposure promotes epigenetic transgenerational inheritance of imprinted gene Igf2: methylation status and DNMTs. Toxicol Appl Pharmacol. 2015;289(2):193–202. doi: 10.1016/j.taap.2015.09.024
- Chinnadurai RK, Saravanaraman P, Boopathy R. The significance of aryl acylamidase activity of acetylcholinesterase in osteoblast differentiation and mineralization. Mol Cell Biochem. 2018;440(1):199–208. doi: 10.1007/s11010-017-3167-x
- Dong S, Jie L, Zhang X. Tumor protein p53-induced nuclear protein 2 modulates osteogenic differentiation of human adipose derived stem/stromal cells by activating Wnt/β-catenin signaling. Am J Transl Res. 2020;12(10):6853.
- Xu ML, Bi CWC, Liu EYL, et al. Wnt3a induces the expression of acetylcholinesterase during osteoblast differentiation via the Runx2 transcription factor. J Biol Chem. 2017;292(30):12667–12678. doi: 10.1074/jbc.M117.777581
- Elsafadi M, Manikandan M, Alajez NM, et al. MicroRNA-4739 regulates osteogenic and adipocytic differentiation of immortalized human bone marrow stromal cells via targeting LRP3. Stem Cell Res. 2017;20:94–104. doi: 10.1016/j.scr.2017.03.001
- Chen WX, Liu HH, Li RX, et al. C-type natriuretic peptide stimulates osteoblastic proliferation and collagen-X expression but suppresses fibroblast growth factor-23 expression in vitro. Pediatr Rheumatol. 2020;18(1):1–11. doi: 10.1186/s12969-020-00441-w
- Seitz S, Barvencik F, Gebauer M, et al. Preproenkephalin (Penk) is expressed in differentiated osteoblasts, and its deletion in Hyp mice partially rescues their bone mineralization defect. Calcif Tissue Int. 2010;86(4):282–293. doi: 10.1007/s00223-010-9344-5
- Yanaka N, Imai Y, Kawai E, et al. Novel membrane protein containing glycerophosphodiester phosphodiesterase motif is transiently expressed during osteoblast differentiation. J Biol Chem. 2003;278(44):43595–43602. doi: 10.1074/jbc.M302867200
- Negishi-Koga T, Shinohara M, Komatsu N, et al. Suppression of bone formation by osteoclastic expression of semaphorin 4D. Nature Med. 2011;17(11):1473–1480. doi: 10.1038/nm.2489
- Nguyen NM, de Oliveira Andrade F, Jin L, et al. Maternal intake of high n-6 polyunsaturated fatty acid diet during pregnancy causes transgenerational increase in mammary cancer risk in mice. Breast Cancer Res. 2017;19(1):1–13. doi: 10.1186/s13058-017-0866-x
- Anastasiadi D, Shao C, Chen S, et al. Footprints of global change in marine life: inferring past environment based on DNA methylation and gene expression marks. Mol Ecol. 2021;30(3):747–760. doi: 10.1111/mec.15764
- Metzger DC, Schulte PM. The DNA methylation landscape of stickleback reveals patterns of sex chromosome evolution and effects of environmental salinity. Genome Biol Evol. 2018;10(3):775–785. doi: 10.1093/gbe/evy034
- Aluru N, Karchner SI, Krick KS, et al. Role of DNA methylation in altered gene expression patterns in adult zebrafish (Danio rerio) exposed to 3, 3’, 4, 4’, 5-pentachlorobiphenyl (PCB 126). Environ Epigenet. 2018;4(1):dvy005. doi: 10.1093/eep/dvy005
- Bailey KA, Fry RC. Chapter four - environmental toxicant exposure and the epigenome. Adv Mol Toxicol. 2012;6:129–162.
- Bekim S, Rodenhiser DI. Benzopyrene exposure disrupts DNA methylation and growth dynamics in breast cancer cells. Toxicol Appl Pharmacol. 2006;216(3):458–468. doi: 10.1016/j.taap.2006.06.012
- Wilson VL, Jones PA. Chemical carcinogen-mediated decreases in DNA 5-methylcytosine content of BALB/3T3 cells. Carcinogenesis. 1984;5(8):1027–1031. doi: 10.1093/carcin/5.8.1027
- Yoon JH, Smith LE, Feng Z, et al. Methylated CpG dinucleotides are the preferential targets for G-to-T transversion mutations induced by benzo [a] pyrene diol epoxide in mammalian cells: similarities with the p53 mutation spectrum in smoking-associated lung cancers. Cancer Res. 2001;61(19):7110–7117.
- Zhang W, Yang J, Lv Y, et al. Paternal benzo[a]pyrene exposure alters the sperm DNA methylation levels of imprinting genes in F0 generation mice and their unexposed F1-2 male offspring. Chemosphere. 2019;228:586–594.
- Habano W, Miura T, Terashima J, et al. Aryl hydrocarbon receptor as a DNA methylation reader in the stress response pathway. Toxicology. 2022;470:153154. doi: 10.1016/j.tox.2022.153154
- Abbott BD, Birnbaum LS, Perdew GH. Developmental expression of two members of a new class of transcription factors: i. Expression of aryl hydrocarbon receptor in the C57BL/6N mouse embryo. Dev Dyn. 1995;204(2):133–143. doi: 10.1002/aja.1002040204
- Guyot E, Chevallier A, Barouki R, et al. The AhR twist: ligand-dependent AhR signaling and pharmaco-toxicological implications. Drug Discovery Today. 2013;18(9):479–486. doi: 10.1016/j.drudis.2012.11.014
- Ouattara A, Cooke D, Gopalakrishnan R, et al. Methionine restriction alters bone morphology and affects osteoblast differentiation. Bone Rep. 2016;5:33–42. doi: 10.1016/j.bonr.2016.02.002
- Duan C. Hypoxia-inducible factor 3 biology: complexities and emerging themes. Am J Physiol Cell Physiol. 2016;310(4):C260–C269. doi: 10.1152/ajpcell.00315.2015
- Lee SY, Park KH, Yu HG, et al. Controlling hypoxia-inducible factor-2α is critical for maintaining bone homeostasis in mice. Bone Res. 2019;7(1):1–14. doi: 10.1038/s41413-019-0054-y
- Merceron C, Ranganathan K, Wang E, et al. Hypoxia-inducible factor 2α is a negative regulator of osteoblastogenesis and bone mass accrual. Bone Res. 2019;7(1):1–14. doi: 10.1038/s41413-019-0045-z
- Holland PW, Harper SJ, McVey JH, Hogan BL. In vivo expression of mRNA for the Ca++-binding protein SPARC (osteonectin) revealed by in situ hybridization. J Cell Bio. 1987;105(1):473–482.
- Weivoda MM, Chew CK, Monroe DG, et al. Identification of osteoclast-osteoblast coupling factors in humans reveals links between bone and energy metabolism. Nat Commun. 2020;11(1):1–13. doi: 10.1038/s41467-019-14003-6
- Rosset EM, Bradshaw AD. SPARC/Osteonectin in mineralized tissue. Matrix Biol. 2016;52:78–87. doi: 10.1016/j.matbio.2016.02.001
- Renn J, Schaedel M, Volff JN, et al. Dynamic expression of sparc precedes formation of skeletal elements in the Medaka (Oryzias latipes). Gene. 2006;372:208–218. doi: 10.1016/j.gene.2006.01.011
- Delany AM, McMahon DJ, Powell JS, et al. Osteonectin/SPARC polymorphisms in Caucasian men with idiopathic osteoporosis. Osteoporosis Int. 2008;19(7):969–978. doi: 10.1007/s00198-007-0523-9
- Wilson DG, Phamluong K, Lin WY, et al. Chondroitin sulfate synthase 1 (Chsy1) is required for bone development and digit patterning. Dev Biology. 2012;363(2):413–425. doi: 10.1016/j.ydbio.2012.01.005
- Yang M, Li CJ, Sun X, et al. MiR-497∼ 195 cluster regulates angiogenesis during coupling with osteogenesis by maintaining endothelial Notch and HIF-1α activity. Nat Commun. 2017;8(1):1–11. doi: 10.1038/ncomms16003
- Stemig M, Astelford K, Emery A, et al. Deletion of histone deacetylase 7 in osteoclasts decreases bone mass in mice by interactions with MITF. PLoS ONE. 2015;10(4):e0123843. doi: 10.1371/journal.pone.0123843
- Barrio-Hernandez I, Jafari A, Rigbolt KT, et al. Phosphoproteomic profiling reveals a defined genetic program for osteoblastic lineage commitment of human bone marrow–derived stromal stem cells. Genome Res. 2020;30(1):127–137. doi: 10.1101/gr.248286.119
- Jensen ED, Gopalakrishnan R, Westendorf JJ. Regulation of gene expression in osteoblasts. BioFactors. 2010;36(1):25–32. doi: 10.1002/biof.72
- Guo J, Qin W, Xing Q, et al. TRIM33 is essential for osteoblast proliferation and differentiation via BMP pathway. J Cell Physiol. 2017;232(11):3158–3169. doi: 10.1002/jcp.25769
- Kirschner G, Balla B, Horváth P, et al. Effects of imatinib and nilotinib on the whole transcriptome of cultured murine osteoblasts. Mol Med Rep. 2016;14(3):2025–2037. doi: 10.3892/mmr.2016.5459
- Mizoshiri N, Shirai T, Terauchi R, et al. The tetraspanin CD81 mediates the growth and metastases of human osteosarcoma. Cell Oncol. 2019;42(6):861–871. doi: 10.1007/s13402-019-00472-w
- Warsi S, Blank U, Dahl M, et al. BMP signaling is required for postnatal murine hematopoietic stem cell self-renewal. Haematologica. 2021;106(8):2203. doi: 10.3324/haematol.2019.236125
- Wattanachanya L, Wang L, Millard SM, et al. Assessing the osteoblast transcriptome in a model of enhanced bone formation due to constitutive Gs–G protein signaling in osteoblasts. Exp Cell Res. 2015;333(2):289–302. doi: 10.1016/j.yexcr.2015.02.009
- Kim SP, Li Z, Zoch ML, et al. Fatty acid oxidation by the osteoblast is required for normal bone acquisition in a sex-and diet-dependent manner. JCI Insight. 2017;2(16). doi: 10.1172/jci.insight.92704
- Taubmann J, Krishnacoumar B, Böhm C, et al. Metabolic reprogramming of osteoclasts represents a therapeutic target during the treatment of osteoporosis. Sci Rep. 2020;10(1):1–9. doi: 10.1038/s41598-020-77892-4
- Wu Y, Wang M, Feng H, et al. Lactate induces osteoblast differentiation by stabilization of HIF1α. Mol Cell Endocrinol. 2017;452:84–92. doi: 10.1016/j.mce.2017.05.017
- Danjo A, Yamaza T, Kido MA, et al. Cystatin C stimulates the differentiation of mouse osteoblastic cells and bone formation. Biochem Biophys Res Commun. 2007;360(1):199–204. doi: 10.1016/j.bbrc.2007.06.028
- Guo L, Zhu Y, Li L, et al. Breast cancer cell‐derived exosomal miR‐20a‐5p promotes the proliferation and differentiation of osteoclasts by targeting SRCIN1. Cancer Med. 2019;8(12):5687–5701. doi: 10.1002/cam4.2454
- Kim HJ, Minashima T, McCarthy EF, et al. Progressive ankylosis protein (ANK) in osteoblasts and osteoclasts controls bone formation and bone remodeling. J Bone Mineral Res. 2010;25(8):1771–1783. doi: 10.1002/jbmr.60
- Rai MF, Schmidt EJ, Hashimoto S, et al. Genetic loci that regulate ectopic calcification in response to knee trauma in LG/J by SM/J advanced intercross mice. J Orthop Res. 2015;33(10):1412–1423. doi: 10.1002/jor.22944
- Wu M, Chen W, Lu Y, et al. Gα13 negatively controls osteoclastogenesis through inhibition of the Akt-GSK3β-NFATc1 signalling pathway. Nat Commun. 2017;8(1):1–13. doi: 10.1038/ncomms13700
- Kim HN, Ponte F, Nookaew I, et al. Estrogens decrease osteoclast number by attenuating mitochondria oxidative phosphorylation and ATP production in early osteoclast precursors. Sci Rep. 2020;10(1):1–17. doi: 10.1038/s41598-020-68890-7
- Ma P, Song NN, Li Y, et al. Fine-tuning of Shh/Gli signaling gradient by non-proteolytic ubiquitination during neural patterning. Cell Rep. 2019;28(2):541–553. doi: 10.1016/j.celrep.2019.06.017
- Ma P, Yang X, Kong Q, et al. The ubiquitin ligase RNF220 enhances canonical Wnt signaling through USP7-mediated deubiquitination of β-catenin. Mol Cell Biol. 2014;34(23):4355–4366. doi: 10.1128/MCB.00731-14
- Wang H, Yang C, Li Y, et al. RNF220-mediated ubiquitination promotes aggresomal accumulation and autophagic degradation of cytoplasmic Gli via HDAC6. Biochem Biophys Res Commun. 2021;557:323–328. doi: 10.1016/j.bbrc.2021.03.156
- Chipoy C, Berreur M, Couillaud S, et al. Downregulation of osteoblast markers and induction of the glial fibrillary acidic protein by oncostatin M in osteosarcoma cells require PKCδ and STAT3. J Bone Mineral Res. 2004;19(11):1850–1861. doi: 10.1359/JBMR.040817
- Andrade AC, Lui JC, Nilsson O. Temporal and spatial expression of a growth-regulated network of imprinted genes in growth plate. Pediatr Nephrol. 2010;25(4):617–623. doi: 10.1007/s00467-009-1339-y
- Bajayo A, Goshen I, Feldman S, et al. Central IL-1 receptor signaling regulates bone growth and mass. Proc Nat Acad Sci. 2005;102(36):12956–12961. doi: 10.1073/pnas.0502562102
- Hatzikotoulas K, Roposch A, Shah KM, et al. Genome-wide association study of developmental dysplasia of the hip identifies an association with GDF5. Commun Biol. 2018;1(1):1–11. doi: 10.1038/s42003-018-0052-4
- Alam I, Koller DL, Cañete T, et al. Fine mapping of bone structure and strength QTLs in heterogeneous stock rat. Bone. 2015;81:417–426. doi: 10.1016/j.bone.2015.08.013
- Mo C, Guo J, Qin J, et al. Single‐cell transcriptomics of LepR‐positive skeletal cells reveals heterogeneous stress‐dependent stem and progenitor pools. Embo J. 2022;41(4):e108415. doi: 10.15252/embj.2021108415
- Tower RJ, Li Z, Cheng YH, et al. Spatial transcriptomics reveals a role for sensory nerves in preserving cranial suture patency through modulation of BMP/TGF-β signaling. Proc Nat Acad Sci. 2021;118(42):e2103087118. doi: 10.1073/pnas.2103087118
- Swan AL, Schütt C, Rozman J, et al. Mouse mutant phenotyping at scale reveals novel genes controlling bone mineral density. PLoS Genet. 2020;16(12):e1009190. doi: 10.1371/journal.pgen.1009190
- Xiao P, Chen Y, Jiang H, et al. In vivo genome‐wide expression study on human circulating B cells suggests a novel ESR1 and MAPK3 network for postmenopausal osteoporosis. J Bone Mineral Res. 2008;23(5):644–654. doi: 10.1359/jbmr.080105
- O’Brien JM, Beal MA, Yauk CL, et al. Benzo(a)pyrene is mutagenic in mouse spermatogonial stem cells and dividing spermatogonia. Toxicol Sci. 2016;152(2):363–371. doi: 10.1093/toxsci/kfw088
- Rathore K, Cekanova M. Effects of environmental carcinogen benzo(a)pyrene on canine adipose-derived mesenchymal stem cells. Res Vet Sci. 2015;103:34–43. doi: 10.1016/j.rvsc.2015.09.012
- Slotkin TA, Skavicus S, Card J, et al. In vitro models reveal differences in the developmental neurotoxicity of an environmental polycyclic aromatic hydrocarbon mixture compared to benzo[a]pyrene: neuronotypic PC12 Cells and embryonic neural stem cells. Toxicology. 2017;377:49–56.
- Zhou Y, Jiang R, An L, et al. Benzo[a]pyrene impedes self-renewal and differentiation of mesenchymal stem cells and influences fracture healing. Sci Total Environ. 2017;587-588:305–315.
- Barajas-Olmos FM, Ortiz-Sánchez E, Imaz-Rosshandler I, et al. Analysis of the dynamic aberrant landscape of DNA methylation and gene expression during arsenic-induced cell transformation. Gene. 2019;711:143941. doi: 10.1016/j.gene.2019.143941
- Binder H, Willscher E, Loeffler-Wirth H, et al. DNA methylation, transcriptome and genetic copy number signatures of diffuse cerebral WHO grade II/III gliomas resolve cancer heterogeneity and development. Acta Neuropathol Commun. 2019;7(1):59. doi: 10.1186/s40478-019-0704-8
- Blake LE, Roux J, Hernando-Herraez I, et al. A comparison of gene expression and DNA methylation patterns across tissues and species. Genome Res. 2020;30(2):250–262. doi: 10.1101/gr.254904.119
Appendix I.
Selected top GO (BP) terms of conserved differentially methylated genes in the F1 and F3 vertebrate
Appendix
Appendix II Conserved DMGs in the F1 and F3 vertebrae