
ABSTRACT
Background: Nonalcoholic fatty liver disease (NAFLD) is the most common hepatic disorders worldwide. The mitophagy is suggested to be repressed in NAFLD, but the mechanism remains to be elucidated.
Methods: NAFLD cell and mouse models were established by treating with free fatty acid (FFA) and feeding a high fat diet (HFD), respectively. QRT-PCR, Western blotting, or IHC measured the expression of ZNF143, lncRNA NEAT1, ROCK2, and lipid formation/mitophagy-related proteins. Cell viability and mitophagy were evaluated by MTT and immunofluorescence. The chloroform-methanol extraction method measured triglyceride and total cholesterol levels. ELISA detected ALT and AST levels. The interactions among ZNF143, lncRNA NEAT1 and SND1 were analysed by ChIP, dual-luciferase reporter, pull-down, and RIP. The lipid droplets were determined by Oil-red O and HE staining.
Results: ZNF143 and lncRNA NEAT1 were upregulated in hepatic cells treated with FFA (p < 0.01 and p < 0.001). Knockdown of ZNF143 or lncRNA NEAT1 inhibited lipid droplets formation, while promoting mitophagy (p < 0.01 and p < 0.001). ZNF143 promoted lncRNA NEAT1 transcriptional expression through binding to its promoter. LncRNA NEAT1 increased ROCK2 mRNA stability by targeting SND1. LncRNA NEAT1 or ROCK2 overexpression reversed the effect of ZNF143 or lncRNA NEAT1 knockdown on hepatic steatosis and mitophagy (p < 0.01 and p < 0.001). ZNF143 or lncRNA NEAT1 knockdown inhibited HFD-induced steatosis and promoted mitophagy in vivo (p < 0.01 and p < 0.001).
Conclusion: The upregulation of lncRNA NEAT1 caused by ZNF143 promoted NAFLD through inhibiting mitophagy via activating ROCK2 pathway by targeting SND1, providing potential targets for NAFLD therapy.
Introduction
Nonalcoholic fatty liver disease (NAFLD; because metabolic dysfunction is intimately involved in the complex mechanisms of NAFLD development, some publications now rename NAFLD as metabolic dysfunction-related fatty liver disease (MAFLD) [Citation1] is the most common chronic liver disease, with a global prevalence of approximately 25%, and the situation will become more serious as obesity rates rise [Citation2,Citation3]. The mildest form of NAFLD is fatty liver degeneration, which can then progress to inflammation, fibrosis, or sclerosis of the liver, leading to decompensation and ultimately increasing the risk of hepatocellular carcinoma [Citation4,Citation5], indicating that effective treatment of NAFLD can greatly reduce the severe liver lesion. Therefore, it is necessary and urgent to investigate the pathogenesis of NAFLD.
Mitophagy, a self-repairing process with the help of lysosome, has been demonstrated to ameliorate acute and chronic liver injury [Citation6]. The enlarged mitochondria have been reported in non-alcoholic fatty livers [Citation7], and the mitophagy is suggested to be repressed in NAFLD [Citation8]. Activation of mitophagy could alleviate the development of NAFLD and play a protective role [Citation9,Citation10]. Rho-associated coiled-coil-containing kinase (ROCK) consists of two isoforms: ROCK1 and ROCK2. They were linked to the advancement of multiple cardiovascular diseases: ROCK inhibitors are beneficial for improving hypertension and vascular inflammation [Citation11]. The function of the ROCK inhibitor is also effective in liver disease, including NAFLD. Wang et al. indicated that the ROCK inhibitor RKI-1447 reduced the lipid accumulation and inflammatory lesions in NAFLD through suppressing the ROCK signalling [Citation12], suggesting that the activation of the ROCK pathway might facilitate the development of NAFLD. Furthermore, a previous study demonstrated that a ROCK2 inhibitor SR3677 promoted Parkin-mediated mitophagy, which removed damaged mitochondria from cells [Citation13]. Therefore, we speculated whether the activation of the ROCK2 pathway is also involved in NAFLD by affecting mitophagy, which has not been reported so far.
Zinc finger protein 143 (ZNF143), a transcription factor, has been shown to have the ability to activate protein-coding and non-coding gene levels on a genome scale [Citation14]. ZNF143 was reported to be overexpressed in tumour cells and tissues and participated in the progression of cancer by regulating the expression of genes related to cell cycle [Citation15]. Recently, ZNF143 was demonstrated to be overexpressed in NAFLD [Citation16]. However, its specific effects on hepatic cells and tissues have not been reported. Interestingly, the data from JASPAR indicated binding sequences between ZNF143 and lncRNA NEAT1. LncRNA NEAT1 was reported in the study of NAFLD, which might facilitate the hepatic lipid accumulation through miR-146-5p/ROCK1 [Citation17], mTOR/S6K1 [Citation18], or other pathways, indicating that the promoting effect of lncRNA NEAT1 on NAFLD is a promising focus.
A previous study suggested that lncRNA NEAT1 was overexpressed in NAFLD, and that knockdown of NAET1 repressed the lipid accumulation of hepatic cells induced by free fatty acid (FFA) [Citation19]. Furthermore, lncRNA NEAT1 knockdown was demonstrated to inhibit the development of diabetic nephropathy through enhancing mitophagy [Citation20], revealing the role of lncRNA NEAT1 in regulating mitochondrial function. On the other hand, lncRNAs could be involved in posttranscriptional regulation through interaction with RNA-binding proteins by acting as scaffolds [Citation21]. Starbase predicted a binding site between lncRNA NEAT1/staphylococcal nuclease domain-containing 1 (SND1) and ROCK2/SND1. SND1, an RNA-binding protein, was demonstrated to be associated with the low-density lipid droplets in liver steatosis [Citation22]. Moreover, SND1 silencing could decrease fat accumulation and regulate the levels of lipogenesis enzymes in vivo [Citation23]. However, whether the interplay among lncRNA NEAT1, SND1, and ROCK2 could be involved in the development of NAFLD remains largely unknown.
Our study was designed to investigate the mechanism and function of ZNF143/NEAT1/ROCK2/SND1 axis in the pathogenesis of NAFLD. We speculated that the upregulation of lncRNA NEAT1 induced by ZNF143 might promote hepatic steatosis and inhibit mitophagy in FFA-treated hepatocytes and HFD-fed mice by regulating ROCK2 pathway.
Materials and methods
Cell culture and treatment
The human hepatoma cell Huh-7 (Chinese Academy of Sciences) and the human hepatoblastoma cell HepG2 (American Type Culture Collection) were cultured in Dulbecco’s modified Eagle’s medium (DMEM) with the presence of 10% foetal bovine serum (FBS), 100 units/ml penicillin, and 100 μg/mL streptomycin. Primary mouse hepatocytes were isolated from the liver of 8-week male C57BL/6J mice and then incubated with RPMI 1640 medium supplemented with 10% FBS and 1% P/S. All cells were maintained in cell incubators with 95% O2 and 5% CO2 under 37°C. For the treatment of FFA (containing a low proportion of palmitic acid (oleate/palmitate, 2:1 ratio)), cells were seeded in 6-well plates with a concentration of 1 × 10⁶ cells/well. When cells reach to approximately 80% confluent, they were exposed to different concentration FFA (0, 0.25, 0.5, 1 or 2 mM) for 24 h.
3-(4,5-dimethylthiazol-2-yl)-2,5-diphenyl tetrazolium bromide (MTT) assay
Cells (1 × 10⁶ cells/well) treated with different concentration FFA were plated in 24-well plate, followed by incubating with MTT solution for 4 h. Then, cells were washed twice with phosphate buffer saline (PBS), DMSO were added to each well and subjected to 15 min gently shaking. The absorbance was determined by a microplate spectrophotometer (BioTek Instruments, Winooski, VT, USA) at 490 nm.
Plasmid construction and transfection
Short hairpin RNA (shRNA) targeted ZNF143, lncRNA NEAT1, ROCK2, or scrambled oligonucleotides were inserted into pGLVH1 (GenePharm, China) vector (shZNF143, shNEAT1, shROCK2). The full length of lncRNA NEAT1 or ROCK2 coding sequence was amplified and cloned into a pcDNA3.1 (Invitrogen, Carlsbad, CA, USA) vector (NEAT1, ROCK2). HepG2 and Huh-7 cells were transfected with the above plasmids or their corresponding controls using Lipofectamine 3000 (Invitrogen). After 48 h, cells were harvested for subsequently experiments.
Biochemical analysisChloroform-methanol extraction method was used to measure triglyceride (TG) levels in cells and liver tissues and total cholesterol (TC) levels in liver tissues as previous described [Citation24,Citation25]. Briefly, collected cells and tissues were homogenized and then the lipids were extracted by homogenizing with chloroform: methanol (2:1 v/v) (Sigma-Aldrich). After drying and resuspending to obtain a homogeneous sample, TG and TC levels were measured using a biochemical analyser.
The serum index of liver tissues (alanine aminotransferase (ALT) and aspartate aminotransferase (AST) levels) were detected by their respectively kits purchased from Jiancheng (Nanjing, China) (ALT: C009-2-1; AST: C010-2-1) according to the instructions of manufacturer.
Immunofluorescent staining
Treated cells were plate on confocal Petri dishes, washed with PBS, and fixed with 4% paraformaldehyde for 15 min. After incubating with blocking buffer (PBS, 3% BAS), cells were incubated with the primary antibody: Parkin (1:200, ab15494, Abcam, Cambridge, UK) and TOM20 (1:250, ab186735, Abcam) for 24 h. Staining was revealed by the incubation with fluorescent-labelled secondary antibody. The confocal analysis was conducted by a Leica microscope. Percentages of areas occupied by autophagic vacuoles or mitochondria were measured using the ImageJ program.
Chromatin immunoprecipitation (ChIP)-PCR
There binding sites (site1: −1950~-1935, CTCCCACCATGGCCTT; site2: −211~-196, ATCCCAAAAAGCACTG) between ZNF143 and lncRNA NEAT1 were predicted by JASPAR (http://jaspar.genereg.net/). The kit from Millipore (Bedford, MA, USA) was used to perform ChIP assay. Anti-IgG was used as negative control, anti-ZNF143 was used to capture target DNA. Cells were collected and sonicated. The sonicated extracts were subjected for incubation with anti-IgG (ab172730, Abcam) and anti-ZNF143 (PA5–118371; Thermo Fisher Scientific, Rockford, USA) at 4°C overnight. The immunoprecipitated DNA was then detected using qRT-PCR using specific primers respective to each of potential three binding sites.
Dual-luciferase reporter assay
LncRNA NEAT1 promoter four fragments (pro, pro#1–2) containing the two binding sites (Pro: wild type 1 and 2; Pro#1: wild type 1, mutant 2; Pro#2: wild type 2, mutant 1) were amplified and inserted into pGL3-basic vector (Promega, USA) to establish recombinant luciferase reporter plasmids. Then, the recombinant plasmids were co-transfected into HepG2 and Huh-7 cells with shNC or shZNF143 using Lipofectamine 3000 (Invitrogen). After 48 h of co-transfection, luciferase reporter assay system (E2920, Promega) was used to detect the luciferase activities of each group.
RNA pull-down
Biotin-labelled lncRNA NEAT1 was designed and provided by GenePharm (Shanghai, China). In brief, the cell lysates of HepG2 and Huh-7 were prepared in RIP buffer, followed by mixing and incubating with biotin-labelled lncRNA NEAT1 overnight. Then, streptavidin-conjugated magnetic beads (Invitrogen, USA) were added and allowed for another 2 h incubation. Beads were then washed thoroughly and the retrieved proteins were examined using Western blotting.
RNA Immunoprecipitation (RIP)
RIP assay was conducted to analyse the interaction between lncRNA NEAT/SND1 and SND1/ROCK2 using the Magna RIP kit (EMD Millipore, USA) following the manufacturer’s instructions, and anti-SND1 antibody and IgG (used as control) were adopted for RIP assay. Co-precipitated RNAs were extracted and detected using qRT-PCR. Total RNAs (input control) were also detected.
Evaluation of mRNA stability
HepG2 and Huh-7 cells transfected with shNC or shNEAT1 were harvested and incubated in culture medium containing 5 μM actinomycin D (Sigma-Aldrich, Merck KGaA, Darmstadt, Germany) for 4 h, 8 h and 12 h. Total RNA was subsequently extracted for quantification using qRT-PCR.
Mice model of NAFLD
C57BL/6 mice (8-weeks old, male) were obtained from SJA Laboratory Animal Co., Ltd (Hunan, China, n = 40) and used in this study to establish NAFLD animal models. Mice were divided into five groups: Control (fed with normal diet: carbohydrate 61.9%, fat 12.6%, protein 24.6%), HFD (fed with carbohydrate 32.1%, fat 51.4%, protein 16.5%), HFD+shNC, HFD+shZNF143 and HFD+shNEAT1 (HFD-fed mice were injected with shNC, shZNF143 and shNEAT1, respectively, by tail vein once a week for 6 weeks) (n = 8). Mice were weighted in conscious state by using an electric balance every 1 week. After 12 weeks, mice were euthanized, blood samples were collected to determine the serum index, and liver tissues were stored at − 80°C for subsequent experiments. All animal experiments were approved by Institutional Animal Care and Use Committee of The First Affiliated Hospital, Department of Ultrasound Medicine, Hengyang Medical School, University of South China.
Glucose and insulin tolerance tests
For glucose tolerance test (GTT), mice were fasted overnight, followed by measuring baseline blood glucose levels. Mice were then intraperitoneally injected with glucose (1 mg/g body weight) in sterile saline solution, and the blood was collected by simply puncturing the tail vein at 15, 30, 60, 90, and 120 min after injecting with glucose to perform GTT using a glucometer. After four days, mice fasted 4 h were intraperitoneally injected with 0.75 U/kg body weight regular insulin to perform insulin tolerance test (ITT). The blood was collected and glucose levels were analysed at 0, 15, 30, 60, 90, and 120 min from mouse tail vein after insulin injection.
Hematoxylin and eosin (H&E) staining
Liver tissues were fixed with 4% paraformaldehyde, embedded in paraffin and sliced into 4 μm sections with a microtome. After dewaxing and dehydrating, slices were stained with haematoxylin and eosin. Slices were then imaged using a microscope (Olympus, Tokyo, Japan).
Oil red O staining
For evaluating the lipid accumulation, treated cells or slices of liver tissues were fixed in paraformaldehyde for 15 min, followed by washing with PBS (cells) or distilled water (slices). Then, cells and slices were stained with Oil red O (Sigma-Aldrich) at room temperature for 10 min. After soaking in 80% isopropanol for 30 s, cells and slices were counterstained with haematoxylin. Finally, cells and slices observed under a microscope (Olympus) and photographed with ImageJ program.
Immunohistochemistry (IHC)
Liver tissues were fixed with 4% paraformaldehyde, embedded in paraffin and sliced into 4 μm sections with a microtome. Then, slices were incubated with anti-ROCK2 (1:100, ab45171, Abcam) at 4°C overnight. Afterward, slices were incubated with a horseradish peroxidase-conjugated secondary antibody, and counterstained with haematoxylin. Finally, the slices were observed under a microscope.
Quantitative real-time PCR (Qrt-PCR) analysis
TRIzol reagent (Invitrogen) was employed to extract the total RNAs of treated cells or liver tissues of mice. RNAs were then reversely transcribed into cDNA using PrimeScript™ RT Kit (Takara, Japan) and qPCR processes were conducted using SYBR Green kit (Roche, Switzerland) on an ABI 7500 Real-Time System (Applied Biosystems). GAPDH was used as internal control. The primers were used in this study were shown in .
Table 1. Primers used for Qrt-PCR analysis.
Western blot analysis
Proteins from cells and tissues were prepared using RIPA lysis buffer (Thermo), BCA method was adopted to determine the protein concentration. Protein samples were separated by loading into 10% SDS-PAGE. Afterwards, isolated proteins were transferred onto PVDF membranes followed by the blockage with 5% low-fat milk for 2 h. Rinsed membranes with PBS for three times and subjected the membranes for incubation with primary antibodies against ZNF143 (1:1000, PA5–116147; Thermo Fisher Scientific), PTEN-induced kinase 1 (PINK1; 1:1000, ab23707, Abcam), Parkin (1:2000, ab77924, Abcam), LC3 II/I (1:200, ab128025, Abcam), Beclin1 (1:2000, ab207612, Abcam) and ROCK2 (1:20000, ab125025, Abcam) for 24 h. Rinsed membranes with PBS again and incubated the membranes with corresponding horseradish peroxidase-conjugated secondary antibodies (Abcam) for 2 h, followed by detecting the signals with enhanced chemiluminescence reagent (EMD Millipore). GAPDH (1:10000, ab8245, Abcam) used as a control.
Statistical analysis
Data in this study was presented as mean ± standard deviation. Data was organized and analysed in Graphpad Prism (Version 7.0, USA) using student’s t test or one-way ANOVA with Turkey post-hoc test. P value less than 0.05 was considered significant.
Results
ZNF143 and lncRNA NEAT1 were upregulated in FFA-induced NAFLD cell model
We first established a NAFLD model by FFA treatment (0, 0.25, 0.5, 1, or 2 mM) in HepG2 and Huh-7 cells. We observed that FFA treatment inhibited cell viability, while increasing TG levels, in a dose-dependent manner (, p < 0.05, p < 0.01, and p < 0.001). Then, we measured ZNF143 and lncRNA NEAT1 expression. The results showed that FFA upregulated their expression both at mRNA and protein levels in a dose-dependent manner in vitro (, p < 0.05, p < 0.01, and p < 0.001). The differential expression of ZNF143 and lncRNA NEAT1 in NAFLD cell model revealed that they might be involved in the progression of NAFLD. We chose a concentration of 1 mM FFA for subsequent experiments because it caused the cell viability to drop by approximately 50%.
Figure 1. ZNF143 and lncRNA NEAT1 were upregulated in FFA-induced NAFLD cell model. (a and b) Effects of FFA treatment with different concentrations (0, 0.25, 0.5, 1 or 2 mM) on the viability and TG levels of HepG2 and Huh-7 cells were examined using MTT assay and chloroform-methanol extraction method kit, respectively. (c-f) the mRNA and protein levels of ZNF143 and lncRNA NEAT1 were evaluated in HepG2 and Huh-7 cells treated with 0, 0.25, 0.5, 1 or 2 mM FFA using Qrt-PCR and Western blotting. *p < 0.05, **p < 0.01, and ***p < 0.001.
Silencing of ZNF143 or lncRNA NEAT1 alleviated FFA-induced lipid formation in hepatocytes
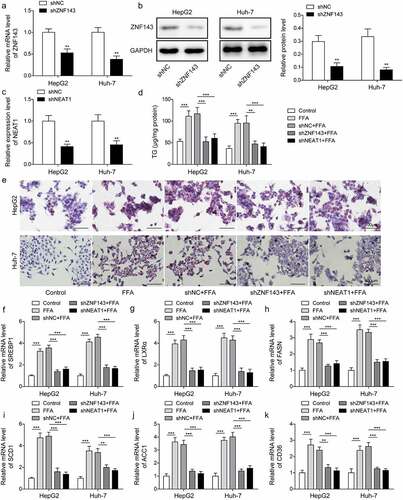
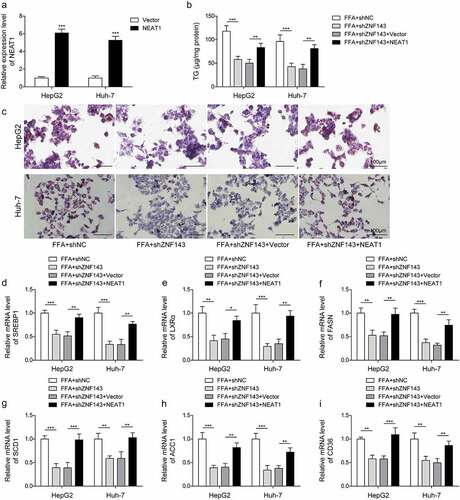
To examine the function of ZNF143 and lncRNA NEAT1 in NAFLD cell model, we first examined the effects of ZNF143 or lncRNA NEAT1 knockdown on the steatosis of HepG2 and Huh-7 cells treated with FFA. Knockdown efficiencies of shZNF143 and shNEAT1 were assessed, and we found significant reductions of ZNF143 and lncRNA NEAT1 in cells transfected with shZNF143 and shNEAT1 compared to those transfected with shNC (, p < 0.01). FFA treatment could increase the TG levels in hepatocytes, while knockdown of ZNF143 or lncRNA NEAT1 reversed this promoting effect (, p < 0.01, and p < 0.001). Furthermore, cells showed significant red lipid droplets of varying sizes after treating with FFA, while knockdown of ZNF143 or lncRNA NEAT1 reduced the lipid droplet formation (). FFA treatment increased the expression of lipid formation-related genes in vitro, including SREBP1, LXRα, SCD1, ACC1, FASN, and CD36, as expected, ZNF143 or lncRNA NEAT1 knockdown abolished the upregulation of these genes (, p < 0.01, and p < 0.001). These findings suggested that ZNF143 or lncRNA NEAT1 knockdown could alleviate the FFA-induced hepatocyte steatosis in vitro.
Figure 2. Silencing of ZNF143 or lncRNA NEAT1 alleviated FFA-induced lipid formation in HepG2 and Huh-7 cells. (a and b) the mRNA and protein levels of ZNF143 in HepG2 and Huh-7 cells transfected with shNC or shZNF143. (c) Relative level of lncRNA NEAT1 in cells transfected with shNC or shNEAT1. Cells were treated with FFA, FFA+shNC, FFA+shZNF143 or FFA+shNEAT1. (d) the TG levels of treated cells were measured by chloroform-methanol extraction method. (e) the intracellular fat of treated cells was analysed by Oil red O staining. (f-k) the levels of lipid formation-related genes, including SREBP1 (f), LXRα (g), FASN (h), SCD1 (i), ACC1 (j) and CD36 (k) were evaluated by Qrt-PCR. **p < 0.01, and ***p < 0.001.
The silencing of ZNF143 or lncRNA NEAT1 facilitated mitophagy in hepatocytes treated with FFA
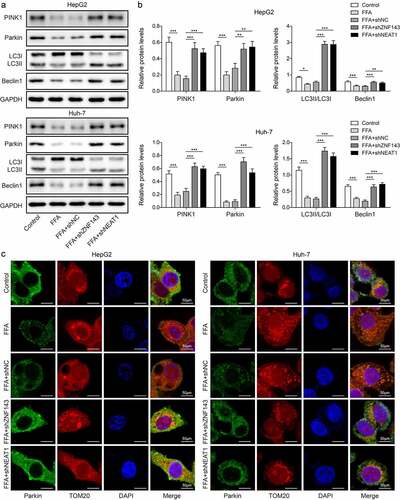
Next, we explored the effects of ZNF143 or lncRNA NEAT1 knockdown on mitochondria function of HepG2 and Huh-7 cells treated with FFA. PINK1, Parkin, Beclin1, and LC3II/I are the key proteins associated with autophagy. We therefore detected their levels, and observed that FFA treatment significantly repressed the expression of PINK1, Parkin, Beclin1, LC3II/I in vitro, while knockdown of ZNF143 or lncRNA NEAT1 could reverse the downregulation of these genes (, p < 0.01, and p < 0.001). In the confocal microscopy studies, we found that FFA treatment inhibited Parkin expression and its co-localization with mitochondrial marker TOM20, while knockdown of ZNF143 or lncRNA NEAT1 reversed this inhibiting effect (). Taken together, ZNF143 or lncRNA NEAT1 knockdown enhanced the mitophagy of hepatic cells treated with FFA, which might improve NAFLD in vitro.
Figure 3. Silencing of ZNF143 or lncRNA NEAT1 facilitated mitophagy in HepG2 and Huh-7 cells. Cells were treated withFFA, FFA+shNC, FFA+shZNF143 or FFA+shNEAT1. (a and b) PINK1, Parkin, Beclin1 and LC3 levels were measured by Western blotting. (c) Representative images of immunofluorescence labelling Parkin and TOM20. *p < 0.05, **p < 0.01, and ***p < 0.001.
Furthermore, we have performed additional tests on primary mouse hepatocytes to strengthen our findings. The expression of ZNF143 in primary hepatocytes was reduced by transfecting with shZNF143 (Figure S1A and S1B, p < 0.01). Meanwhile, we silenced lncRNA NEAT1 levels by transfecting with shNEAT1 (Figure S1C, p < 0.01). Subsequently, knockdown of ZNF143 or lncRNA NEAT1 decreased the high TG levels in primary hepatocytes caused by FFA treatment (Figure S1D, p < 0.001). FFA-induced lipid droplet formation in primary hepatocytes was also blocked by silencing ZNF143 or lncRNA NEAT1 (Figure S1E). As expected, knockdown of ZNF143 or lncRNA NEAT1 could reduce the high expression of lipid formation-related genes in primary hepatocytes treated with FFA (Figure S1F-S1K, p < 0.001). Moreover, we measured the levels of autophagy-related proteins to verify the function of ZNF143 or lncRNA NEAT1 knockdown on mitochondria function of primary hepatocytes treated with FFA. The inhibiting effect of FFA treatment on these protein expression was reversed by silencing ZNF143 or lncRNA NEAT1 (Figure S1L and S1M, p < 0.001). Therefore, knockdown of ZNF143 or lncRNA NEAT1 alleviated lipid formation and promoted mitophagy in primary hepatocytes treated with FFA.
ZNF143 promoted the transcriptional expression of lncRNA NEAT1 through binding to its promoter
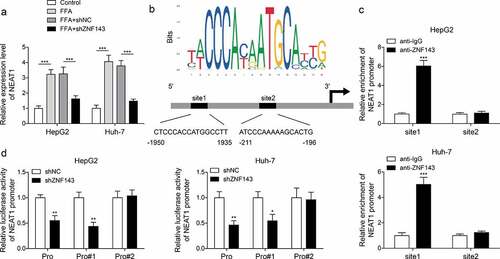
To evaluate the interplay of ZNF143/lncRNA NEAT1, we detected lncRNA NEAT1 levels in cells treated with shNC or shZNF143 in the presence of FFA. ZNF143 knockdown reduced the high expression of lncRNA NEAT1 induced by FFA treatment (, p < 0.001). Then, the data from JASPAR indicated that there are two binding sites between ZNF143 and lncRNA NEAT1 (). Then, ZNF143 antibody was found to enrich the site1 of lncRNA-ZFAS1 promoter, not site2 (, p < 0.001). Furthermore, transfected with shZNF143 could inhibit the luciferase activity of cells driven by Pro or Pro#1, but not Pro#2 (, p < 0.05, and p < 0.01). These findings confirmed the targeted regulatory relationship between ZNF143 and lncRNA NEAT1 in vitro.
Figure 4. ZNF143 promoted the transcriptional expression of lncRNA NEAT1 through binding to its promoter. (a) Relative lncRNA NEAT1 level in cells treated with shNC or shZNF143 in the presence of FFA. (b) the binding sites between ZNF143 and lncRNA NEAT1 were analysed by JASPAR database. (c and d) ChIP and dual-luciferase reporter assays were employed to further examine the interaction between ZNF143 and lncRNA NEAT1. *p < 0.05, **p < 0.01, and ***p < 0.001.
Overexpression of lncRNA NEAT1 reversed the effect of ZNF143 knockdown on the lipid formation in hepatocytes
In view of the function of ZNF143 and lncRNA NEAT1 in FFA-induced lipid formation and the interaction between ZNF143 and lncRNA NEAT1, we had reason to investigate the effect of ZNF143/lncRNA NEAT1 axis on the steatosis of hepatocytes. Firstly, the expression of lncRNA NEAT1 in cells was increased after transfecting with plasmid NEAT1 (, p < 0.001). Then, we investigated the effects of lncRNA NEAT1 overexpression on steatosis of NAFLD cells transfected with shZNF143. Overexpression of lncRNA NEAT1 increased the TG levels reduced by ZNF143 knockdown in FFA-treated hepatocytes (, p < 0.01, and p < 0.001). ZNF143 knockdown inhibited the formation of lipid droplets in NALFD cells, while overexpression of lncRNA NEAT1 abolished this inhibiting effect (). Furthermore, the downregulation of SREBP1, LXRα, SCD1, ACC1, FASN, and CD36 caused by silencing ZNF143 was increased after overexpressing lncRNA NEAT1 (, p < 0.05, p < 0.01, and p < 0.001). These findings suggested that ZNF143 regulated the lipid formation of FFA-treated hepatocytes via lncRNA NEAT1 in vitro.
Figure 5. Overexpression of lncRNA NEAT1 reversed the effect of ZNF143 knockdown on the lipid formation in HepG2 and Huh-7 cells. (a) Relative level of lncRNA NEAT1 in cells transfected with Vector or NEAT1. FFA-treated cells were transfected with shNC, shZNF143, shZnf143+vector or shZNF143+NEAT1. (b) the TG levels were measured by chloroform-methanol extraction method. (c) the intracellular fat of treated cells was examined by Oil red O staining. (d-i) QRT-PCR was used to detect the expression of lipid formation-related genes. *p < 0.05, **p < 0.01, and ***p < 0.001.
LncRNA NEAT1 activated the ROCK2 signalling pathway by targeting SND1 to increase the mRNA stability of ROCK2
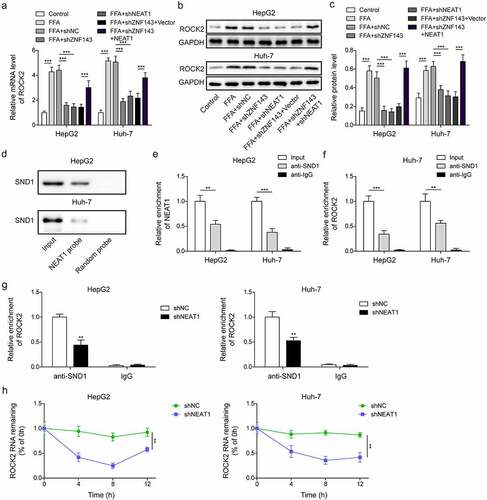
ROCK signalling pathway was demonstrated to promote the development of NAFLD. We found that FFA treatment significantly increased the expression of ROCK2 in HepG2 and Huh-7 cells, knockdown of ZNF143 or lncRNA NEAT1 downregulated ROCK2 expression, while overexpression of lncRNA NEAT1 could reverse the inhibiting effect (, p < 0.001), demonstrating the positive regulatory relationship between lncRNA NEAT1 and ROCK2. The data from StarBase showed that there was a binding site between lncRNA NEAT1/SND1 or SND/ROCK2. As shown in , lncRNA NEAT1 probe enriched SND1, verifying a targeted relationship between lncRNA NEAT1 and SND1. Furthermore, SND1 antibody could enrich lncRNA NEAT1 and ROCK2 (, p < 0.01, and p < 0.001). Meanwhile, knockdown of lncRNA NEAT1 significantly repressed the binding between SND1 and ROCK2 (, p < 0.01), as well as the stability of ROCK2 mRNA (, p < 0.01). Taken together, lncRNA NEAT1 activated ROCK2 signalling by targeting SND1 to increase the mRNA stability of ROCK2 in hepatocytes.
Figure 6. LncRNA NEAT1 activated the ROCK2 signalling pathway by targeting SND1 to increase the mRNA stability of ROCK2. HepG2 and Huh-7 cells were treated with FFA, FFA+shNC, FFA+shZNF143, FFA+shZNF143+Vector or FFA+shZNF143+NEAT1. (a-c) Relative mRNA and protein expression of ROCK2. (d) RNA pull-down was used to detect the interaction between lncRNA NEAT1 and SND1. (e-g) RIP assay was conducted to analyse the target relationship between lncRNA NEAT1 and SND1, or SND1 and ROCK2. (h) the stability of ROCK2 was examined in actinomycin D-treated cells transfected with shNC or shNEAT1 by Qrt-PCR. **p < 0.01, and ***p < 0.001.
The inhibitory impact of lncRNA NEAT1 knockdown on lipid formation in HepG2 and Huh-7 cells was reversed after overexpressing ROCK2
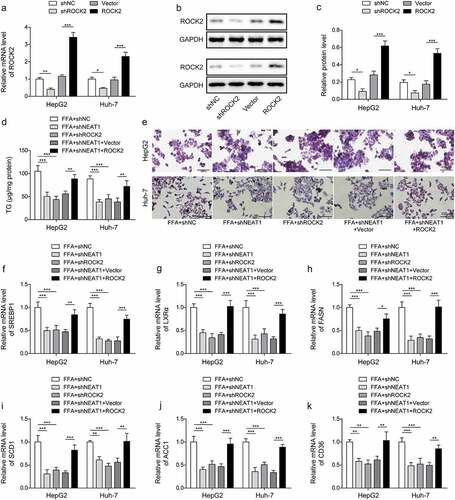
Next, we investigated the effect of lncRNA NEAT1-activated ROCK2 pathway on the lipid formation of HepG2 and Huh-7 cells. The transfection efficiencies of shROCK2 and ROCK2 were first measured. The results showed that ROCK2 levels were significantly reduced or increased after transfecting with shROCK2 or ROCK2, respectively (, p < 0.05, p < 0.01, and p < 0.001). Knockdown of lncRNA NEAT1 or ROCK2 inhibited the high TG levels induced by FFA treatment, while overexpression of ROCK2 could reverse the inhibiting effect of lncRNA NEAT1 knockdown (, *p < 0.01, and p < 0.001). As expected, overexpression of ROCK2 blocked the reduction of lipid droplets caused by silencing lncRNA NEAT1 or ROCK2 in FFA-treated cells (). LncRNA NEAT1 or ROCK2 knockdown downregulated the expression of SREBP1, LXRα, SCD1, ACC1, FASN, and CD36, while overexpression of ROCK2 reversed the effect (, p < 0.05, p < 0.01, and p < 0.001). These findings indicated that lncRNA NEAT1 promoted the steatosis of hepatocytes through regulating ROCK2 in vitro.
Figure 7. Overexpression of ROCK2 reversed the inhibiting effect of lncRNA NEAT1 knockdown on the lipid formation in HepG2 and Huh-7 cells. (a-c) the mRNA and protein levels of ROCK2 in cells transfected with shROCK2 or ROCK2. FFA-treated cells were transfected with shNC, shNEAT1, shROCK2, shNeat1+vector or shNEAT1+ROCK2. (d) the TG levels of treated cells. (e) the intracellular fat of treated cells of treated cells. (f-k) the expression of lipid formation-related genes. *p < 0.05, **p < 0.01, and ***p < 0.001.
The promoting effect on mitophagy caused by silencing lncRNA NEAT1 was abolished by overexpression of ROCK2 in vitro
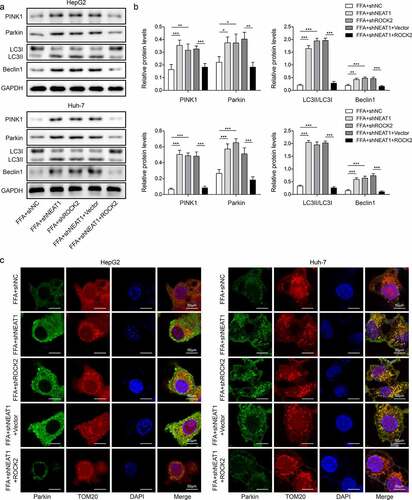
The function of lncRNA NEAT1/ROCK2 axis on the cell mitochondria function was evaluated. The results showed that knockdown of lncRNA NEAT1 or ROCK2 increased FFA-induced low expression of PINK1, Parkin, Beclin1, and LC3II/I, while co-transfected with ROCK2 could abolish the effect of lncRNA NEAT1 knockdown (, p < 0.05, p < 0.01, and p < 0.001). Knockdown of lncRNA NEAT1 or ROCK2 promoted the expression of Parkin in mitochondria, while simultaneous overexpression of ROCK2 significantly reversed this effect (). Taken together, lncRNA NEAT1 inhibited the mitophagy of hepatocytes through regulating ROCK2 in vitro.
Figure 8. Overexpression of ROCK2 reversed the promoting effect of lncRNA NEAT1 knockdown on mitophagy in HepG2 and Huh-7 cells. FFA-treated cells were transfected with shNC, shNEAT1, shROCK2, shNeat1+vector or shNEAT1+ROCK2. (a and b) the expression of PINK1, Parkin, Beclin1 and LC3. (a) Representative images of immunofluorescence labelling Parkin and TOM20. *p < 0.05, **p < 0.01, and ***p < 0.001.
Knockdown of ZNF143 or lncRNA NEAT1 inhibited hepatic steatosis in mice by regulating mitophagy mediated by the ROCK2 signalling
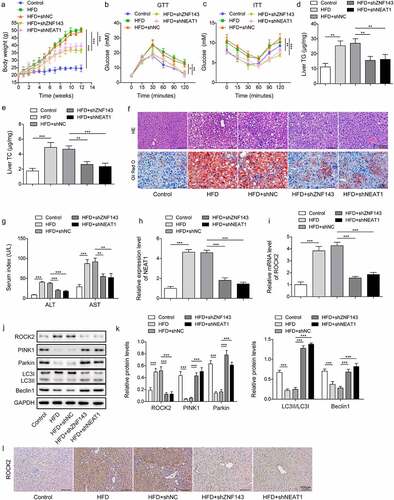
To further verify the role of ZNF143/lncRNA NEAT1/ROCK2 axis in vivo, we delivered shNC, shZNF143, or shNEAT1into NAFLD mouse model established by HFD-fed. We observed that the weight of mouse models was significantly increased compared to the control mice, while the body weight in the shZNF143 and shNEAT1 groups was repressed (). The results from GTT indicated that HFD-fed mice had clearly increased circulating glucose levels, while knockdown of ZNF143 or lncRNA NEAT1 was closely linked to a significant improvement in glycaemia during the GTT (). Insulin resistance is a key pathophysiological driver of NAFLD. Through ITT, we observed that the glucose levels of HFD-fed mice were higher than those of control mice after a similar insulin dose. ZNF143 or lncRNA NEAT1 knockdown would block the early impairment of insulin-mediated hypoglycaemia in HFD-fed mice (). TG and TC levels in liver tissues were observed to be upregulated in the HFD-fed mice, while injecting with shZNF143 or shNEAT1 significantly reduced these levels (, p < 0.01, and p < 0.001). As shown in , the liver tissues of HFD-fed mice exhibited obvious lipid vacuoles and droplets, while knockdown of ZNF143 or lncRNA NEAT1 could improve the steatosis of liver tissues. Consistently, the increased ALT levels in the blood of HFD-fed mice were reduced by knocking down ZNF143 or NEAT1 (, p < 0.001). The serum AST levels in HFD mice (87.22 U/L) were roughly two times higher than those in the control group (29.24 U/L), while silencing NEAT1 or ZNF143 significantly reduced serum AST levels (, p < 0.01, and p < 0.001). HFD-fed caused an upregulation of lncRNA NEAT1 and ROCK2 in the liver tissues, while knockdown of ZNF143 or lncRNA NEAT1 could reverse these changes ( and 9l, p < 0.001). Moreover, the downregulation of PINK1, Parkin, Beclin1, and LC3II/I in NAFLD mouse models was repressed after knocking down ZNF143 or lncRNA NEAT1 (, p < 0.001). These findings further validated the functional role of ZNF143/lncRNA NEAT1/ROCK2 axis in HFD-induced liver tissue damage in vivo.
Figure 9. Knockdown of ZNF143 or lncRNA NEAT1 inhibited hepatic steatosis in mice by regulating mitophagy mediated by the ROCK2 signalling. Mice fed with high fat diet (HFD) to establish NAFLD mice model. Mice were divided into 5 groups (n = 8): Control, HFD, HFD+shNC, HFD+shZNF143 and HFD+shNEAT1. shNC, shZNF143 or shNEAT1 plasmid was injected into the tail vein of the mice every 7 days. (a) the changes in body weight of mice in each group. (b and c) Glucose levels were measured after glucose and insulin injection at 0, 15, 30, 60, 90, 120 min. (d and e) TG and TC levels in liver tissues were measured by chloroform-methanol extraction method. (f) the HE and Oil red O stanning of liver tissues in each group. Scale bar: 100 μm. (g) the serum related indexes (ALT and AST levels) in each group were examined by their respectively kits. (h and i) the relative levels of NEAT1 and ROCK2 in liver tissues were measured by Qrt-PCR. (j and k) the protein expression of ROCK2, PINK1, Parkin, LC3 and Beclin1 was measured by Western blotting. (l) Immunohistochemistry was used to determine ROCK2 levels in liver tissues of mice in each group. *p < 0.05, **p < 0.01, and ***p < 0.001.
Discussion
Excessive accumulation of lipids leads to NAFLD, which is extremely harmful to the liver and may induce hepatic fibrosis, liver cirrhosis, and even hepatocellular carcinoma [Citation5]. Therefore, the treatment of NAFLD can effectively prevent the occurrence of malignant liver diseases and reduce the burden on patients and society. Herein, we have proved a novel mechanism by which ZNF143 promoted the transcriptional expression of lncRNA NEAT1 by binding to its promoter, thereby repressing mitophagy via activating the ROCK2 pathway, ultimately facilitating the development of NAFLD.
The current publications on the function of ZNF143 mainly focus on the development of multiple human tumours, including hepatocellular carcinoma. Zhang et al. indicated that ZNF143 was upregulated in the tissues of hepatocellular carcinoma and that ZNF143 could facilitate tumour cell growth [Citation26]. Furthermore, previous literature has reported the abnormal expression of ZNF143 in NAFLD. In 2016, ZNF143 was identified in NAFLD [Citation27]. Subsequently, Ge et al. demonstrated that ZNF143 was overexpressed in NAFLD patients [Citation16]. Here, we found that ZNF143 showed upregulation in cells treated with FFA and mice fed with HFD, and knockdown of ZNF143 inhibited the lipid accumulation, while promoting mitophagy in vitro and in vivo. Importantly, ZNF143 could bind to promoters and contribute to chromatin interaction [Citation28]. Our findings revealed that lncRNA NEAT1 promoted hepatic steatosis through targeting ZNF143.
The contribution of lncRNA NEAT1 to the development of NAFLD demonstrated in this study is consistent with several previous reports [Citation19,Citation29]. For instance, lncRNA NEAT1 facilitated the fibrosis, inflammatory, and lipid metabolism in NAFLD cell model through miR-506/GLI3 axis [Citation30]. Knockdown of lncRNA NEAT1 was suggested to reduce the TG levels and accumulated lipids in NAFLD cellular model [Citation31]. Our study demonstrated that lncRNA NEAT1 silencing not only inhibited steatosis in vivo and in vitro, but also promoted mitophagy, which served as one of the major mechanisms for mitochondrial repair [Citation32]. The promoting effect of lncRNA NEAT1 knockdown on mitophagy was also demonstrated in diabetic nephropathy [Citation20]. Moreover, lncRNAs were involved in posttranscriptional regulation through interaction with RNA-binding proteins by acting as scaffolds [Citation33–36]. LncRNA NEAT1 was suggested to regulate the stability of hnRNP A2 mRNA through the NEAT1-U2AF65 complex, thereby participating in the growth of hepatocellular carcinoma cells [Citation37]. Here, lncRNA NEAT1 was first reported to enhance the stability of ROCK2 mRNA by interacting with SND1 in HepG2 and Huh-7 cells.
ROCK2 is reported to be involved in the cytoskeleton, lipid metabolism, inflammation, and other biological activities [Citation38]. Hepatic inflammation has been shown to be closely related to activation of the RhoA/ROCK pathway [Citation39]. ROCK regulated the levels of TC, TG, and inflammatory cytokines in diabetic liver injury [Citation40]. In the study of NAFLD, Wang et al. suggested that RKI-1447 could repress ROCK2 level in HepG2 cells treated with oleic acid, and the inhibition of ROCK had beneficial effects in NAFLD [Citation12], while the specific mechanism remains to be solved. Here, ROCK2 knockdown inhibited the TG levels and lipid droplets in cells treated with FFA, indicating that the inhibition of ROCK2 might repress hepatic steatosis. Furthermore, ROCK2 overexpression reversed the inhibitory effect of lncRNA NEAT1 knockdown on hepatic steatosis.
Activation of mitophagy could alleviate the development of NAFLD and play a protective role [Citation9,Citation10]. PINK1 and Parkin are important mediators of a pathway that degrades damaged mitochondria [Citation41]. We observed that knockdown of ZNF143, lncRNA NEAT1, or ROCK2 facilitated the expression of PINK1 and Parkin in NAFLD, while overexpression of ROCK2 reversed this effect, indicating that the activation of ROCK2 might suppress the mitophagy in NAFLD. Actually, a previous study demonstrated a strategy by which ROCK inhibitors contribute to mitophagy through increasing the recruitment of a positive regulator of Parkin [Citation13]. As our best knowledge, we are the one to report that the inhibition of ROCK2 pathway promoted mitophagy, thereby improving NAFLD both in vitro and in vivo.
To strengthen our findings, we investigated the function of ZNF143 and lncRNA NEAT1 knockdown in primary mouse hepatocytes. The results further confirm their inhibitory effects on lipid formation and their promoting effects on mitophagy in vitro. However, we have not confirmed these results this aspect in the hepatocyte-specific ZNF143 and lncRNA NEAT1 knockdown mouse models. There is some room for further progress in determining the effects and mechanisms of ZNF143 and lncRNA NEAT1 on hepatic steatosis in vivo.
Conclusion
The upregulation of lncRNA NEAT1 induced by ZNF143 exacerbated steatosis, while repressing mitophagy in NAFLD through enhancing the stability of ROCK2 mRNA by binding to SND1. Our findings provided solid evidence for the involvement of ZNF143/lncRNA NEAT1/ROCK2 axis in the pathogenesis of NAFLD, not only promoting the understanding of NAFLD pathogenesis but also contributing to the development of target drugs for the disease.
Ethics approval and consent to participate
All animal experiments were approved by Institutional Animal Care and Use Committee of The First Affiliated Hospital, Department of Ultrasound Medicine, Hengyang Medical School, University of South China.
Availability of data and materials
The datasets generated during and/or analysed during the current study are available from the corresponding author on reasonable request.
Supplemental Material
Download Zip (18.1 MB)Disclosure statement
No potential conflict of interest was reported by the author(s).
Supplementary material
Supplemental data for this article can be accessed online at https://doi.org/10.1080/15592294.2023.2239592
Additional information
Funding
References
- Sakurai Y, Kubota N, Yamauchi T, et al. Role of insulin resistance in MAFLD. Int J Mol Sci. 2021;22(8):22. doi: 10.3390/ijms22084156
- Araujo AR, Rosso N, Bedogni G, et al. Global epidemiology of non-alcoholic fatty liver disease/non-alcoholic steatohepatitis: What we need in the future. Liver Int. 2018;38(Suppl 1):47–19. doi: 10.1111/liv.13643
- Petaja EM, Yki-Jarvinen H. Definitions of normal liver fat and the association of insulin sensitivity with acquired and genetic NAFLD—A Systematic Review. Int J Mol Sci. 2016;17(5):17. doi: 10.3390/ijms17050633
- Calzadilla Bertot L, Adams LA. The natural course of non-alcoholic fatty liver disease. Int J Mol Sci. 2016;17(5):17. doi: 10.3390/ijms17050774
- Nd AM. Non-alcoholic fatty liver disease, an overview. Integr Med (Encinitas). 2019;18(2):42–49.
- Ma X, McKeen T, Zhang J, et al. Role and mechanisms of mitophagy in liver diseases. Cells. 2020;9(4):9. doi: 10.3390/cells9040837
- Caldwell SH, Swerdlow RH, Khan EM, et al. Mitochondrial abnormalities in non-alcoholic steatohepatitis. J Hepatol. 1999;31(3):430–434. doi: 10.1016/S0168-8278(99)80033-6
- Yamada T, Murata D, Adachi Y, et al. Mitochondrial stasis reveals p62-mediated ubiquitination in parkin-independent mitophagy and mitigates nonalcoholic fatty liver disease. Cell Metab. 2018;28(4):588–604.e5. doi: 10.1016/j.cmet.2018.06.014
- Urbina-Varela R, Castillo N, Videla LA. Del campo a: impact of mitophagy and mitochondrial unfolded protein response as new adaptive mechanisms underlying old pathologies: sarcopenia and non-alcoholic fatty liver disease. Int J Mol Sci. 2020;21(20):21. doi: 10.3390/ijms21207704
- Zhou T, Chang L, Luo Y, et al. Mst1 inhibition attenuates non-alcoholic fatty liver disease via reversing Parkin-related mitophagy. Redox Biol. 2019;21:101120. doi: 10.1016/j.redox.2019.101120
- Hirooka Y, Shimokawa H. Therapeutic potential of rho-kinase inhibitors in cardiovascular diseases. Am J Cardiovasc Drugs. 2005;5(1):31–39. doi: 10.2165/00129784-200505010-00005
- Wang J, Jiang W. The effects of RKI-1447 in a mouse model of nonalcoholic fatty liver disease induced by a high-fat diet and in hepg2 human hepatocellular carcinoma cells treated with oleic acid. Med Sci Monit. 2020;26:e919220. doi: 10.12659/MSM.919220
- Moskal N, Riccio V, Bashkurov M, et al. ROCK inhibitors upregulate the neuroprotective Parkin-mediated mitophagy pathway. Nat Commun. 2020;11(1):88. doi: 10.1038/s41467-019-13781-3
- Ye B, Yang G, Li Y, et al. ZNF143 in chromatin looping and gene regulation. Front Genet. 2020;11:338. doi: 10.3389/fgene.2020.00338
- Izumi H, Wakasugi T, Shimajiri S, et al. Role of ZNF143 in tumor growth through transcriptional regulation of DNA replication and cell-cycle-associated genes. Cancer Sci. 2010;101(12):2538–2545. doi: 10.1111/j.1349-7006.2010.01725.x
- Ge J, Bai Y, Tang B, et al. The gene signature associated with hepatocellular carcinoma in patients with nonalcoholic fatty liver disease. J Oncol. 2021;2021:1–9. doi: 10.1155/2021/6630535
- Chen X, Tan XR, Li SJ, et al. LncRNA NEAT1 promotes hepatic lipid accumulation via regulating miR-146a-5p/ROCK1 in nonalcoholic fatty liver disease. Life Sci. 2019;235:116829. doi: 10.1016/j.lfs.2019.116829
- Wang X. Down-regulation of lncRNA-NEAT1 alleviated the non-alcoholic fatty liver disease via mTOR/S6K1 signaling pathway. J of Cell Biochem. 2018;119(2):1567–1574. doi: 10.1002/jcb.26317
- Hu MJ, Long M, Dai RJ. Acetylation of H3K27 activated lncRNA NEAT1 and promoted hepatic lipid accumulation in non-alcoholic fatty liver disease via regulating miR-212-5p/GRIA3. Mol Cell Biochem. 2022;477(1):191–203. doi: 10.1007/s11010-021-04269-0
- Yang DY, Zhou X, Liu ZW, et al. LncRNA NEAT1 accelerates renal tubular epithelial cell damage by modulating mitophagy via miR-150-5p–DRP1 axis in diabetic nephropathy. Exp Physiol. 2021;106(7):1631–1642. doi: 10.1113/EP089547
- Ferre F, Colantoni A, Helmer-Citterich M. Revealing protein–lncRNA interaction. Brief Bioinform. 2016;17(1):106–116. doi: 10.1093/bib/bbv031
- Garcia-Arcos I, Rueda Y, Gonzalez-Kother P, et al. Association of SND1 protein to low density lipid droplets in liver steatosis. J Physiol Biochem. 2010;66(1):73–83. doi: 10.1007/s13105-010-0011-0
- Del Rio-Moreno M, Alors-Perez E, Gonzalez-Rubio S, et al. Dysregulation of the splicing machinery is associated to the development of nonalcoholic fatty liver disease. J Clin Endocrinol Metab. 2019;104(8):3389–3402. doi: 10.1210/jc.2019-00021
- Tanaka Y, Shimanaka Y, Caddeo A, et al. LPIAT1/MBOAT7 depletion increases triglyceride synthesis fueled by high phosphatidylinositol turnover. Gut. 2021;70(1):180–193. doi: 10.1136/gutjnl-2020-320646
- Zhang Z, Zong C, Jiang M, et al. Hepatic HuR modulates lipid homeostasis in response to high-fat diet. Nat Commun. 2020;11(1):3067. doi: 10.1038/s41467-020-16918-x
- Zhang L, Huo Q, Ge C, et al. ZNF143-mediated H3K9 trimethylation upregulates CDC6 by activating MDIG in hepatocellular carcinoma. Cancer Res. 2020;80(12):2599–2611. doi: 10.1158/0008-5472.CAN-19-3226
- Lake AD, Chaput AL, Novak P, et al. Transcription factor binding site enrichment analysis predicts drivers of altered gene expression in nonalcoholic steatohepatitis. Biochem Pharmacol. 2016;122:62–71. doi: 10.1016/j.bcp.2016.11.006
- Bailey SD, Zhang X, Desai K, et al. ZNF143 provides sequence specificity to secure chromatin interactions at gene promoters. Nat Commun. 2015;6(1):6186. doi: 10.1038/ncomms7186
- Fu X, Zhu J, Zhang L, et al. Long non-coding RNA NEAT1 promotes steatosis via enhancement of estrogen receptor alpha-mediated AQP7 expression in HepG2 cells. Artif Cells Nanomed Biotechnol. 2019;47(1):1782–1787. doi: 10.1080/21691401.2019.1604536
- Jin SS, Lin XF, Zheng JZ, et al. lncRNA NEAT1 regulates fibrosis and inflammatory response induced by nonalcoholic fatty liver by regulating miR-506/GLI3. Eur Cytokine Netw. 2019;30(3):98–106. doi: 10.1684/ecn.2019.0432
- Jin SS, Lin CJ, Lin XF, et al. Silencing lncRNA NEAT1 reduces nonalcoholic fatty liver fat deposition by regulating the miR-139-5p/c-Jun/SREBP-1c pathway. Ann Hepatol. 2021;27(2):100584. doi: 10.1016/j.aohep.2021.100584
- Sinha RA, Yen PM. Thyroid hormone-mediated autophagy and mitochondrial turnover in NAFLD. Cell Biosci. 2016;6(1):46. doi: 10.1186/s13578-016-0113-7
- Haq S, Das S, Kim DH, et al. The stability and oncogenic function of LIN28A are regulated by USP28. Biochim Biophys Acta Mol Basis Dis. 2019;1865(3):599–610. doi: 10.1016/j.bbadis.2018.12.006
- Chen R, Zhang X, Wang C. LncRNA HOXB-AS1 promotes cell growth in multiple myeloma via FUT4 mRNA stability by ELAVL1. J Cell Biochem. 2020;121(10):4043–4051. doi: 10.1002/jcb.29573
- Feng Y, Gao L, Cui G, et al. LncRNA NEAT1 facilitates pancreatic cancer growth and metastasis through stabilizing ELF3 mRNA. Am J Cancer Res. 2020;10(1):237–248.
- Guttman M, Donaghey J, Carey BW, et al. Lander ES: lincRnas act in the circuitry controlling pluripotency and differentiation. Nature. 2011;477(7364):295–300. doi: 10.1038/nature10398
- Mang Y, Li L, Ran J, et al. Long noncoding RNA NEAT1 promotes cell proliferation and invasion by regulating hnRNP A2 expression in hepatocellular carcinoma cells. Onco Targets Ther. 2017;10:1003–1016. doi: 10.2147/OTT.S116319
- Tang X, Guo D, Lin C, et al. hCLOCK causes rho-kinase-mediated endothelial dysfunction and NF-kappaB-Mediated inflammatory responses. Oxid Med Cell Longev. 2015;2015:671839. doi: 10.1155/2015/671839
- Hu X, Yu D, Zhuang L, et al. Geniposide improves hepatic inflammation in diabetic db/db mice. Int Immunopharmacol. 2018;59:141–147. doi: 10.1016/j.intimp.2018.03.035
- Xue W, Fan Z, Li Y, et al. Alkannin inhibited hepatic inflammation in diabetic Db/Db mice. Cell Physiol Biochem. 2018;45(6):2461–2470. doi: 10.1159/000488264
- Eiyama A, Okamoto K. Pink1/parkin-mediated mitophagy in mammalian cells. Curr Opin Cell Biol. 2015;33:95–101. doi: 10.1016/j.ceb.2015.01.002