
ABSTRACT
DNA methylation has been extensively utilized to study epigenetic patterns across many diseases as well as to deconvolve blood cell type proportions. This study builds upon previous studies examining methylation patterns in paediatric patients with varying stages of Crohn’s disease to extend the immune profiling of these patients using a novel deconvolution approach. Compared with control subjects, we observed significantly decreased levels of CD4 memory and naive, CD8 naive, and natural killer cells and elevated neutrophil levels in Crohn’s disease. In addition, Crohn’s patients had a significantly elevated neutrophil-to-lymphocyte ratio. Using an epigenome-wide association approach and adjusting for potential confounders, including cell type, we observed 397 differentially methylated CpG (DMC) sites associated with Crohn’s disease. The top genetic pathway associated with the DMCs was the regulation of arginine metabolic processes which are involved in the regulation of T cells.
Background
Crohn’s disease, a type of inflammatory bowel disease, is caused by a complex combination of genetic and environmental factors, and studies have shown that child-onset Crohn’s disease differs from adult-onset Crohn’s disease [Citation1–4]. Additionally, paediatric patients diagnosed with Crohn’s disease are more likely to experience severe and aggressive progression of the disease [Citation5]. Biomarkers of Crohn’s disease have been investigated for diagnostic purposes, for determining the effect of a treatment, and for possible prediction of relapse. C reactive protein (CRP) was found to be a biomarker of inflammation and correlates with Crohn’s disease activity [Citation6]. Although a good indicator of inflammation [Citation7,Citation8], CRP is less useful as a biomarker for the activity of ileal Crohn’s disease compared to those with ileocolonic or colonic Crohn’s [Citation9,Citation10].
DNA methylation is an important epigenetic mark that regulates gene expression and cellular lineage commitment. Altered DNA methylation profiles have been observed in association with the development and progression of many complex diseases, including Crohn’s disease. Studies of inflammatory bowel disease (IBD), such as Crohn’s and ulcerative colitis, have found associations of peripheral blood DNA methylation with IBD compared with healthy controls using epigenome-wide association study (EWAS) investigating Crohn’s disease [Citation11–13]. A recent study from Somineni et al. identified 1,189 CpG sites whose methylation was significantly associated with Crohn’s disease and were shown to be correlated with CRP levels, a marker of inflammation [Citation11]. Upon treatment, the methylation associated with acute inflammation in patients with Crohn’s disease returned to normal levels. However, methylation was found to be a consequence of inflammation rather than a cause of Crohn’s disease. While the EWAS models used by Somineni et al. to investigate the methylome in Crohn’s disease adjusted for immune cell composition, the authors did not test associations of immune cell proportions derived from DNA methylation with disease status or follow-up. Since the original work from Somineni was published, significant advances have been developed to infer immune cell type proportions from DNA methylation array data [Citation14]. Building on prior work [Citation15–17], the new extended cell deconvolution library discerns 12 immune cell types, including neutrophils, monocytes, natural killer cells, naive B-cells, memory B-cells, naive CD4 T-cells, memory CD4 T-cells, naive CD8 T-cells, memory CD8 T-cells, regulatory T-cells, basophils, and eosinophils. In this work, we leverage data from Somineni et al. and new immune deconvolution methods of greater resolution to investigate the association of immune cell profiles with Crohn’s disease status and on follow-up compared with baseline. We also aim to identify cell type independent methylation signatures of the whole blood of paediatric Crohn’s patients.
Methods
Study population
This study population consists of 164 paediatric Crohn’s disease patients from a five-year study in North America with repeated measures and 74 non-inflammatory bowel disease (non-IBD) controls (4). The participants were enrolled in the Risk Stratification and Identification of Immunogenetic and Microbial Markers of Rapid Disease Progression in Children with Crohn’s Disease study. Subjects were enrolled from 28 different sites in the United States and Canada. Patients were followed for 5 years with a sample taken at diagnosis and again 1–3 years later whereas paired measurements were not taken for controls. The behaviour of the Crohn’s was classified according to the Montreal Classification system [Citation18] with stages B1 (non‐stricturing, non‐penetrating) and B2 (stricturing) included in this dataset. Patients with Crohn’s disease underwent treatment between the time of diagnosis and the time of follow-up. Treatments taken were biologics (n = 76), immunomodulators (n = 26), biologics and immunomodulators (n = 43), 5-aminosalicylic acid, steroids, and/or antibiotics (n = 11), and the remaining eight patients had missing medication data. However, the treatment type was not controlled for because individual treatment data for individual patients was not included in the publicly available dataset.
Target DNA methylation dataset
We derived and investigated cell type proportions from the published DNA methylation dataset from NCBI’s GEO Query, series number GSE112611. This dataset was a case – control EWAS of Crohn’s disease in paediatric patients. The dataset contained beta values and detection p-values derived from peripheral blood samples of the participants.
Immune cell type proportion estimation
Estimation of immune cell type proportions was performed in two main steps: (i) filtering out poor-quality CpG sites and (ii) deconvoluting the cell types of the blood samples. CpG sites were filtered on measurement quality where sites that had more than ten percent of their detection p-values above 0.0001 were removed. The samples originally contained 807,511 CpG sites per sample but 69,266 were filtered out due to poor detection-p values for a total of 738,245 CpG sites. No samples required filtering due to poor data quality. The projectCellType_CP function from the FlowSorted.BloodExtended.EPIC R package [Citation14] was used to deconvolve the 12 cell type proportions (). This package deconvolves following cell types: neutrophils, monocytes, natural killer cells, naive B-cells, memory B-cells, naive CD4 T-cells, memory CD4 T-cells, naive CD8 T-cells, memory CD8 T-cells, regulatory T-cells, basophils, and eosinophils. Due to the detection p-value filtering, the blood cell deconvolution library contained 1,165 of the 1,200 CpG sites (97.1%) in the FlowSorted.BloodExtended.EPIC.compTable were used as GSE112611 did not contain the original IDAT files, only beta values, and therefore had already been filtered. The neutrophil to lymphocyte ratio (NLR) was calculated by dividing the neutrophil proportion by the sum of the proportions of natural killer cells, B-cells, and T-cells.
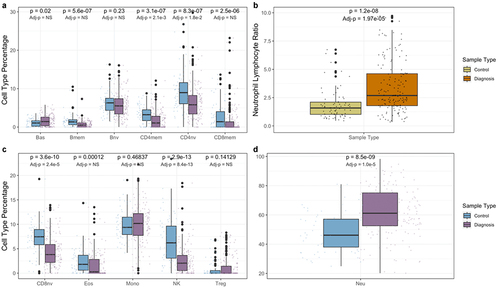
Figure 1. Blood immune cell type proportions in controls and Crohn’s patients at diagnosis. Panels a, c, and d compare cell type proportions between diagnosis and control. Panel b compares neutrophil to lymphocyte ratios. Univariate p-values are displayed on top, while p-values adjusted for age and sex, are displayed below. NS signifies a non-significant (>0.05) p-value.
Epigenome-wide association study
To identify differentially methylated CpG sites between treatment-naive Crohn’s patients at diagnosis and non-IBD controls we performed an EWAS. M-values for each CpG site were regressed linearly on disease (ie. diagnosis v. control) with adjustment for age and sex only; age, sex, and the six cell type proportions (neutrophils, monocytes, natural killer cells, B-cells, CD4 T-cells, CD8 T-cells) from the IDOLOptimizedCpGs.compTable in FlowSorted.Blood.EPIC [Citation15] and age, sex, and extended cell type proportions. Multiple comparisons were then corrected for using a false discovery rate (FDR) of five percent. This EWAS was performed on 238 study participants: 74 non-IBD controls and 164 samples from patients at diagnosis.
Statistical analyses of the cell type proportions and clinical outcomes
Univariate t-tests were employed comparing cell type proportions between cases at diagnosis and controls, cases at diagnosis and at follow-up, and stage one and two patients at diagnosis. Cell types with significant associations were then used to fit multivariable logistic regression models with adjustment for potential confounders such as age and sex.
Downstream analyses
Genomic-context enrichment analysis was performed on the differentially methylated CpG sites using IlluminaHumanMethylationEPICanno.ilm10b4.hg19 [Citation19]. A genetic analysis was then performed to map the CpG sites to specific genes using biomaRt [Citation20] and to look at the genetic pathways associated with Crohn’s disease using missMethyl [Citation21].
Results
The Risk Stratification and Identification of Immunogenetic and Microbial Markers of Rapid Disease Progression in Children with Crohn’s Disease study data from 164 paediatric patients with Crohn’s disease and 74 controls was accessed from GSE112611 for this analysis. Study subjects were from North America and Crohn’s disease patients had repeated blood draws with DNA methylation measures [Citation11]. Samples for the Crohn’s cases were taken at diagnosis and again 1–3 years later. Treatment approaches between baseline and follow-up samples varied among patients. Study subject demographics and clinical characteristics are provided in .
Table 1. Study population demographic and disease characteristics.
Immune cell proportions were quantified using blood DNA methylation data for all samples and subjects with the FlowSorted.BloodExtended.EPIC R package [Citation14]. A univariate comparison for each of the 12 cell types between treatment-naive Crohn’s patients at diagnosis and controls revealed that basophil and neutrophil levels were significantly elevated in Crohn’s patients (PBas = 0.02 and PNeu = 8.05 × 10⁻⁹). In addition, memory B-cells, memory and naive CD4 cells, memory and naive CD8 cells, eosinophils, and natural killers cells were all significantly lower in Crohn’s patients at diagnosis when compared with controls (PBmem = 5.6 × 10⁻⁷, PCD4mem = 3.1 × 10⁻⁷, PCD4nv = 8.3 × 10⁻⁷, PCD8mem = 2.5 × 10⁻⁶, PCD8nv = 3.6 × 10⁻¹⁰, PEos = 1.2 × 10⁻⁴, PNK = 2.9 × 10⁻¹³) (). After adjusting for patient age and sex, using a multivariable logistic regression model, the proportions of basophils, memory B-cells, CD4 memory and naive, CD8 memory and naive, eosinophils, neutrophils, and natural killer cells in cases remained statistically different from controls (PBas = 5.82 × 10⁻³, PBmem = 4.53 × 10⁻⁵, PCD4mem = 1.85 × 10⁻⁵, PCD4nv = 3.56 × 10⁻⁵, PCD8mem = 2.24 × 10⁻², PCD8nv = 6.35 × 10⁻⁸, PEos = 2.03 × 10⁻², PNeu = 1.69 × 10⁻⁷, PNK = 9.41 × 10⁻¹⁰).
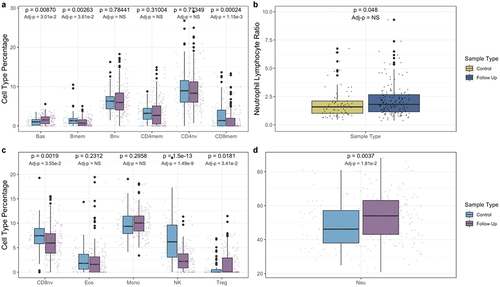
Next, we compared immune cell proportions in Crohn’s cases by disease stage at diagnosis (Supplementary Figure S1) and at follow-up (Supplementary Figure S2). No statistically significant differences were observed for cell type proportions or NLR in cases by disease stage at baseline or follow-up. A univariate comparison of Crohn’s patients at follow-up and controls revealed that basophil, regulatory T-cell, and neutrophil levels were significantly elevated in Crohn’s patients (PBas = 8.70 × 10⁻³, PTreg = 1.81 × 10⁻², PNeu = 3.7 × 10⁻³), while memory B-cell, memory and naive CD8 cell, and natural killer cell levels were all significantly lower when compared with controls (PBmem = 2.63 × 10⁻³, PCD8mem = 2.4 × 10⁻⁴, PCD8nv = 1.9 × 10⁻³, PNK = 1.5 × 10⁻¹³) (). After adjusting for patient age and sex, using a multivariable logistic regression model, the proportions of basophil, regulatory T-cell, neutrophil, memory B-cell, memory and naive CD8 cell, and natural killer cell in patients at follow-up remained statistically different from controls (PBas = 3.01 × 10⁻², PTreg = 3.41 × 10⁻², PNeu = 1.81 × 10⁻², PBmem = 3.61 × 10⁻², PCD8mem = 1.15 × 10⁻³, PCD8nv = 3.55 × 10⁻², PNK = 1.49 × 10⁻⁹). Naive B-cell, memory and naive CD4 cell, eosinophil, and monocyte levels in the Crohn’s patients were not significantly different from controls.
Figure 2. Blood immune cell type proportions in controls and Crohn’s patients at follow-up. Panels a, c, and d compare cell type proportions between controls and patients at follow-up. Panel b compares neutrophil to lymphocyte ratios. Univariate p-values are displayed on top, while p-values adjusted for age and sex, are displayed below. NS signifies a non-significant (>0.05) p-value.
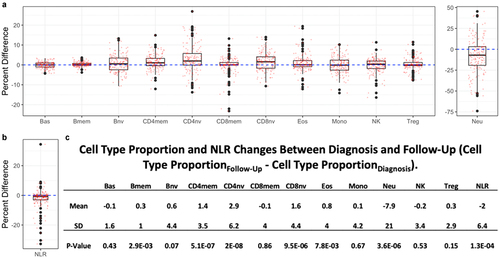
Paired sample t-tests were performed to investigate the change in cell type proportion between patients at diagnosis and at follow-up (). It was found that memory B-cell, naive B-cell, memory CD4 cell, naive CD4 cell, naive CD8 cell, and eosinophil proportions significantly increased in patients at follow-up while neutrophil proportions and the NLR significantly decreased. Paired differences in patients who progressed from B1 at diagnosis to B2 at follow-up and patients who were B1 at diagnosis and remained B1 at follow-up were also examined. Patients who progressed to B2 at follow-up had increases in memory B-cell, memory CD4 cell, Naive CD4 cell, and Naive CD8 cell proportions, and decreases in neutrophil proportions and the NLR that were significant (Supplementary Figure S3). Patients who remained B1 at follow-up saw the same increases and decreases to be significant, in addition to the increase in eosinophils (Supplementary Figure S4).
Figure 3. Paired changes in cell type proportions (CTP) and neutrophil lymphocyte ratio (NLR) between diagnosis and follow-up (CTPFollow-Up - CTPDiagnosis). a positive difference indicates an increase in the proportion of a cell type from baseline to follow-up whereas a negative difference indicates a decrease in the proportion.
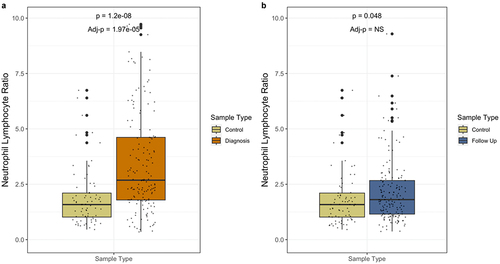
At diagnosis, the neutrophil-to-lymphocyte ratio (NLR) was significantly higher in Crohn’s disease patients than in the controls (). However, after treatment in the follow-up samples we observed significant attenuation of the NLR in cases where levels were similar to those observed in controls (). After adjusting for patient age and sex using a multivariable logistic regression model, the NLR of patients at diagnosis remained statistically significantly different from controls (P = 1.97 × 10⁻⁵). The difference between control and follow-up did not remain significantly different after adjusting for age and sex.
Figure 4. Neutrophil lymphocyte ratios in controls, patients at diagnosis, and patients at follow-up. Univariate p-values are displayed on top, while p-values adjusted for age and sex, are displayed below. NS signifies a non-significant (>0.05) p-value.
The epigenome-wide association analysis revealed 397 CpG sites that were associated with Crohn’s disease at diagnosis from the blood when using an FDR cut-off of 0.05. This analysis was performed using 74 non-IBD controls and 164 patients at diagnosis and was corrected for age, sex, neutrophils, monocytes, natural killer cells, naive B-cells, memory B-cells, naive CD4 T-cells, memory CD4 T-cells, naive CD8 T-cells, basophils, and eosinophils. When compared to a model that only uses the six cell type proportions, the extended cell type model results in fewer CpG sites associated with Crohn’s disease. Of the 397 CpG sites, 219 are hypermethylated and 178 are hypomethylated. Additionally, 296 intersect with the 1189 sites found by Somineni et al., 67% of which were hypermethylated, and 101 are novel, 37% of which are hypermethylated.
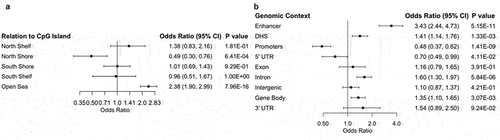
The genomic context enrichment analysis demonstrates that CpGs associated with Crohn’s disease are more likely to be in open sea regions (OR = 2.38, P = 7.96 × 10⁻¹⁶), enhancers (OR = 3.43, P = 5.15 × 10⁻¹¹), DNase I hypersensitive sites (OR = 1.41, P = 1.33 × 10⁻³), introns (OR = 1.60, P = 5.84 × 10⁻⁶), and gene bodies (OR = 1.35, P = 3.07 × 10⁻³), and less likely to be located in north shores (OR = 0.49, P = 6.41 × 10⁻⁴), promoters (OR = 0.48, P = 1.41 × 10⁻⁹), and 5’ untranslated regions (OR = 0.70, P = 4.11 × 10⁻²). CpG islands with the highest number of DMCs mapped to SOC3, FKBP5, and INPP5A. Methylation status of these islands as well as the surrounding regions can be viewed in Supplementary Figure S5. To view the details of the genomic-context enrichment analysis of the Crohn’s – associated CpGs, see Supplementary Table S1. The CpGs mapped to 226 distinct genes, 45 of which intersect with those mapped by Somineni et al. We replicated some of the findings and found that SBNO2 and RPS6KA2 were associated with Crohn’s [Citation13]. However, it was not found to be associated with others that were previously reported such as VMP1, ITGB2, TXK, TNF, JAK3, IL12B, IL23A, IL1R1 [Citation11,Citation13]. To view the details of the genetic context of the Crohn’s – associated CpGs, see Supplementary Table S2. Looking at genetic pathways associated with Crohn’s the only pathway to approach significance after FDR correction is the regulation of arginine metabolic processes. To view the details of the genetic pathway GO terms associated with Crohn’s, see .
Table 2. Top 20 gene ontology pathways. BP denotes biological process while MF denotes molecular function.
Discussion
Using a novel cell type deconvolution approach for detailed immune profiling we observed significant differences in baseline Crohn’s disease patient immune profiles compared with control subjects. Crohn’s patients had elevated neutrophil levels and decreased levels of CD4 memory and naive, CD8 naive, and natural killer cells. From the pathophysiology point of view, the dysregulation of lymphocytes and innate immunity is followed by migration of neutrophils generating microabscesses in the bowel wall and giving origin to fistulas [Citation22]. Neutrophils are then an indicator of disease activity and inflammation [Citation23]. Additionally, it was found that NLR was significantly higher in treatment-naive patients at diagnosis when compared to the controls. This aligns with recent studies that have found an elevated NLR to be a biomarker of inflammatory diseases including Crohn’s disease [Citation24,Citation25]. After treatment, the NLR decreases to levels not significantly different than that of the non-IBD controls, illustrating the efficacy of the anti-inflammatory drugs used to treat Crohn’s disease [Citation11]. While found in tissue instead of blood, decreased CD8+ T-cells have been found in the intestinal epithelium and lamina propria of adult Crohn’s patients [Citation26]. Further study of natural killer cell populations in paediatric blood is needed to elucidate the cause and effect of depressed natural killer levels. Decreased natural killer cell populations have not previously been reported in Crohn’s disease.
For our EWAS approach we compared models with and without adjustment for cell type using traditional and newly extended cell type profiling approaches. In the original work from Somineni et al. (2019) the EWAS model adjusted for cell types using data for six immune cell types from the traditional Houseman method [Citation15,Citation17]. These results were recreated in and revealed 132,024 differentially methylated CpG (DMC) sites associated with Crohn’s disease. In our EWAS with the extended 12 immune cell type adjustment (), we observed 397 DMCs associated with Crohn’s disease that mapped to 226 unique genes representing a large decrease in the number of DMCs associated with Crohn’s disease. The decrease in CpG sites is attributed to the correction of additional immune cell types in our extended EWAS. Basophils, memory B-cells, memory CD8 T-cells, naive CD8 T-cells, and regulatory T-cells were all found to have significant differences in cell type proportion between patients with Crohn’s disease and healthy controls. Additionally, in the six-cell deconvolution model used by Somineni et al. (2019), basophils were not included in the while memory B-cells, memory CD8 T-cells, naive CD8 T-cells, and regulatory T-cells were all condensed into less granular subtypes. Through the use of the novel extended cell type deconvolution [Citation14], we narrowed the scope of disease-associated CpG sites. Different immune cell types have different phenotypes and perform different functions, therefore the DNA methylation patterns for different cell types are highly individualized [Citation27]. Therefore, without correcting for cell type when identifying DMCs between cases and controls, the cell type will confound the results of the EWAS. Even with some adjustment for cell type proportions, residual confounding from cell type may remain. Using Salas et al.’s (2022) extended deconvolution library to provide a more granular measurement of the immune profiles, the model was able to correct for additional potentially confounding variables. This extended correction provides a more succinct list of DMCs that, in addition to the genes they mapped to, are independent of immune cell type and attributable to Crohn’s disease. From this list of DMCs the top genetic pathway found was the regulation of arginine metabolic processes. It is known that myeloid derived suppressor cells (MDSCs) are known for producing arginase to metabolize arginine, which is important to the function of the T cell, therefore inhibiting proper T cell function [Citation28,Citation29]. It is also known that patients with Crohn’s disease have altered spatial distribution of T cell subsets in inflamed tissues when compared to healthy controls [Citation30]. Therefore, methylation of genes in the metabolism of arginine could contribute to the dysregulation of T cells in Crohn’s disease; however, further work would be needed to elucidate the exact role of myeloid derived suppressor cells and arginine metabolism in Crohn’s disease. While investigating the individual genes found to be associated with Crohn’s disease, the only results to be replicated were SBNO2 and RPS6KA2, while others, such as IL12B, IL23A, IL1R1, were not replicated. This could be because adjusting for more immune cell types removed these confounding immune-related genes. There are some limitations to our approach. We were unable to recreate the exact EWAS model used in Somineni et al. (2019), which utilized genotype-based principal components as covariates due to lack of genotype data. However, as shown in , utilizing the extended over the six cell types significantly improves the results. This study illustrates the benefits of correcting for the extended cell type deconvolution library when performing EWAS on blood samples and establishes a more confounding-adverse methodology when performing EWAS studies.
Figure 5. Crohn’s disease at diagnosis is associated with 397 CpG sites in blood. All 738,245 CpG sites are shown with those with an FDR < 0.05 shown in red. FDR < 0.05 shown above blue line and FDR < 0.01 shown above red line. Panel a was only adjusted for age and sex. Panel b was adjusted for age, sex, and the basic cell types deconvolved from the Houseman library. Panel c was adjusted for age, sex, neutrophils, monocytes, natural killer cells, naive B-cells, memory B-cells, naive CD4 T-cells, memory CD4 T-cells, naive CD8 T-cells, basophils, and eosinophils.
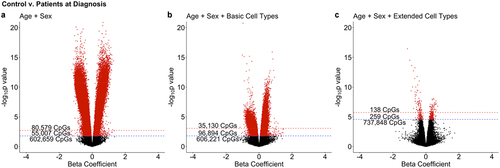
Figure 6. Genomic context and relation to CpG islands of CpGs associated with crohn’s disease.
Ethics approval and consent to participate
This study was previously approved in the Somineni et al. (2019) paper, and the data was reused in this study.
Authors’ contributions
SR analysed and interpreted the data and wrote the manuscript. BC helped with the experimental design. LS contributed to the deconvolution analysis. JC assisted in calculating the log-odds ratios. All authors read and approved the final manuscript.
-)Supplementary Table 1.xls
Download MS Excel (93.5 KB)Supplementary Figures.docx
Download MS Word (1.3 MB)-)Supplementary Table 2.xls
Download MS Excel (96.5 KB)Disclosure statement
Dr. Christensen is an advisor to Guardant Health which had no role in this work.
Data availability statement
The datasets analysed during the current study are available under the National Center for Biotechnology’s Gene Expression Omnibus repository with the accession ID – GSE112611. https://www.ncbi.nlm.nih.gov/geo/query/acc.cgi?acc=GSE112611
Supplementary material
Supplemental data for this article can be accessed online at https://doi.org/10.1080/15592294.2023.2289786
Correction Statement
This article has been republished with minor changes. These changes do not impact the academic content of the article.
Additional information
Funding
References
- Limbergen JV, Russel RK, Drummond HE, et al. Definition of phenotypic characteristics of childhood-onset inflammatory bowel disease [Internet]. Science Direct. Gastroenterology; 2008 [cited 2022 Nov 22]. Available from: https://www.sciencedirect.com/science/article/pii/S0016508508012018
- Gupta N, Bostrom AG, Kirschner BS, et al. Presentation and disease course in early- compared to later-onset pediatric crohn’s disease [Internet]. U.S. National Library Of Medicine. The American Journal Of Gastroenterology; 2008 [cited 2022 Nov 22]. Available from: https://www.ncbi.nlm.nih.gov/pmc/articles/PMC3258513/
- Kim J, Ye BD Successful transition from pediatric to adult care in inflammatory bowel disease: what is the key? [Internet]. U.S. National Library of Medicine. Pediatric Gastroenterology, Hepatology & Nutrition; 2019 [cited 2022 Nov 22]. Available from: https://www.ncbi.nlm.nih.gov/pmc/articles/PMC6333582/
- Ostrowski J, Paziewska A, Lazowska I, et al. Genetic architecture differences between pediatric and adult-onset inflammatory bowel diseases in the Polish population [Internet]. Nature Publishing Group. Nature Communications; 2016 [cited 2022 Nov 22]. Available from: https://www.nature.com/articles/srep39831
- Ruel J, Ruane D, Mehandru S, et al. IBD across the age spectrum—is it the same disease? [Internet]. Nature Reviews Gastroenterology & Hepatology. Nature Reviews Gastroenterology & Hepatology; 2014 [cited 2022 Nov 22]. Available from: https://www.nature.com/articles/nrgastro.2013.240
- Vermeire S, Asscheg V, Rutgeerts P Laboratory markers in IBD: useful, magic, or unnecessary toys? [Internet]. National Center for Biotechnology Information. Gut; 2006 [cited 2022 Nov 22]. Available from: https://www.ncbi.nlm.nih.gov/pmc/articles/PMC1856093/
- Mendoza JL, Abreu MT Biological markers in inflammatory bowel disease: practical consideration for clinicians [Internet]. Elsevier Masson. Gastroentérologie Clinique et Biologique; 2009 [cited 2022 Nov 22]. Available from: https://www.sciencedirect.com/science/article/pii/S0399832009731513
- Vermeire S, Assche GV, Rutgeerts P C-Reactive protein as a marker for inflammatory bowel disease [Internet]. Oxford Academic. Inflammatory Bowel Diseases; 2004 [cited 2022 Nov 22]. Available from: https://academic.oup.com/ibdjournal/article/10/5/661/4718266
- Yang DH, Yang SK, Park SH, et al. Usefulness of C-reactive protein as a disease activity marker in crohn’s disease according to the location of disease [Internet]. U.S. National Library of Medicine. Gut and liver; 2015 [cited 2022 Nov 22]. Available from: https://www.ncbi.nlm.nih.gov/pmc/articles/PMC4282861/
- Chen P, Zhou G, Lin J, et al. Serum biomarkers for inflammatory bowel disease [Internet]. U.S. National Library of Medicine. Frontiers in Medicine; 2020 [cited 2022 Nov 22]. Available from: https://www.ncbi.nlm.nih.gov/pmc/articles/PMC7188783/
- Somineni HK, Venkateswaran S, Kilaru V, et al. Blood-derived DNA methylation signatures of crohn’s disease and severity of intestinal inflammation [Internet]. U.S. National Library of Medicine. Gastroenterology; 2019 [cited 2022 Nov 22]. Available from: https://www.ncbi.nlm.nih.gov/pmc/articles/PMC6529254/
- Taman H, Fenton CG, Hensel IV, et al. Genome-wide DNA methylation in treatment-naïve ulcerative colitis [Internet]. U.S. National Library Of Medicine. Journal Of Crohn’s & Colitis; 2018 [cited 2022 Nov 22]. Available from: https://www.ncbi.nlm.nih.gov/pmc/articles/PMC6236200/
- Ventham NT, Kennedy NA, Adams AT, et al. Integrative epigenome-wide analysis demonstrates that DNA methylation may mediate genetic risk in inflammatory bowel disease [Internet]. Nature Communications. Nature Publishing Group; 2016 [cited 2022 Nov 22]. Available from: https://www.nature.com/articles/ncomms13507
- Salas LA, Zhang Z, Koestler DC, et al. Enhanced cell deconvolution of peripheral blood using DNA methylation for high-resolution immune profiling [Internet]. Nature Communications. Nature Publishing Group; 2022 [cited 2022 Nov 22]. Available from: https://www.nature.com/articles/s41467-021-27864-7#citeas
- Salas LA, Koestler DC, Butler RA, et al. An optimized library for reference-based deconvolution of whole-blood biospecimens assayed using the illumina HumanMethylationEPIC beadarray [Internet]. Genome Biology. BioMed Central; 2018 [cited 2022 Nov 22]. Available from: https://genomebiology.biomedcentral.com/articles/10.1186/s13059-018-1448-7
- Koestler DC, Jones MJ, Usset J, et al. Improving cell mixture deconvolution by identifying optimal DNA methylation libraries (idol) [Internet]. BMC Bioinformatics. BioMed Central; 2016 [cited 2022 Nov 22]. Available from: https://bmcbioinformatics.biomedcentral.com/articles/10.1186/s12859-016-0943-7
- Houseman EA, Accomando WP, Koestler DC, et al. DNA methylation arrays as surrogate measures of cell mixture distribution [Internet]. BioMed Bioinformatics. BioMed Central; 2012 [cited 2022 Nov 22]. Available from: https://bmcbioinformatics.biomedcentral.com/articles/10.1186/1471-2105-13-86
- Satsangi J, Silverberg MS, Vermeire S, et al. The Montreal classification of inflammatory bowel disease: controversies, consensus, and implications [Internet]. Gut. U.S. National Library of Medicine; 2006 [cited 2023Jan24]. Available from: https://www.ncbi.nlm.nih.gov/pmc/articles/PMC1856208/
- Hansen KD Illuminahumanmethylationepicanno.ilm10b4.hg19 [Internet]. Bioconductor. Bioconductor; 2017 [cited 2022 Nov 22]. Available from: https://bioconductor.org/packages/release/data/annotation/html/IlluminaHumanMethylationEPICanno.ilm10b4.hg19.html
- Durinck S, Spellman PT, Birney E, et al. Mapping Identifiers For The Integration Of Genomic Datasets With The R/Bioconductor Package Biomart [Internet]. Nature Protocols. Nature Publishing Group; 2009 [cited 2022 Nov 22]. Available from: https://www.nature.com/articles/nprot.2009.97
- Phipson B, Maksimovic J, Oshlack A missMethyl: an R package for analyzing data from Illumina’s HumanMethylation450 platform [Internet]. Oxford Academic. Bioinformatics; 2016 [cited 2022 Nov 22]. Available from: https://academic.oup.com/bioinformatics/article/32/2/286/1744111?login=false
- Petagna L, Antonelli A, Ganini C, et al. Pathophysiology of crohn’s disease inflammation and recurrence [Internet]. Biology Direct. BioMed Central; 2020 [cited 2022 Nov 22]. Available from: https://biologydirect.biomedcentral.com/articles/10.1186/s13062-020-00280-5
- Rosales C. Neutrophil: a cell with many roles in inflammation or several cell types? [Internet]. U.S. National Library of Medicine. Frontiers in physiology; 2018 [cited 2022 Nov 22]. Available from: https://www.ncbi.nlm.nih.gov/pmc/articles/PMC5826082/
- Langley BO, Guedry SE, Goldenberg JZ, et al. Inflammatory bowel disease and neutrophil–lymphocyte ratio: a systematic scoping review. J Clin Med. 2021;10(18):4219. doi: 10.3390/jcm10184219
- Gao SQ, Huang LD, Dai RJ, et al. Neutrophil-lymphocyte ratio: a controversial marker in predicting Crohn’s disease severity. Int J Clin Exp Pathol. 2015;8(11):14779–11.
- Jaeger N, Gamini R, Cella M, et al. Single-cell analyses of Crohn’s disease tissues reveal intestinal intraepithelial T cells heterogeneity and altered subset distributions. Nat Commun. 2021;12(1):1921.
- Ziller MJ, Gu H, Müller F, et al. Charting a dynamic DNA methylation landscape of the human genome [Internet]. Nature. Nature Publishing Group; 2013 [cited 2022 Nov 22]. Available from: https://www.nature.com/articles/nature12433
- Peranzoni E, Zilio S, Marigo I, et al. Myeloid-derived suppressor cell heterogeneity and subset definition [Internet]. Science Direct. Current Opinion In Immunology; 2010 [cited 2022 Nov 22]. Available from: https://www.sciencedirect.com/science/article/pii/S0952791510000221?via%3Dihub
- Gabrilovich DI, Nagaraj S Myeloid-derived suppressor cells as regulators of the immune system [Internet]. Nature Reviews Immunology. Nature Publishing Group; 2009 [cited 2022 Nov 22]. Available from: https://www.nature.com/articles/nri2506
- Jaeger N, Gamini R, Cella M, et al. Single-cell analyses of crohn’s disease tissues reveal intestinal intraepithelial T cells heterogeneity and altered subset distributions [Internet]. Nature Communications. Nature Publishing Group; 2021 [cited 2022 Nov 22]. Available from: https://www.nature.com/articles/s41467-021-22164-6