
ABSTRACT
This research investigates the intricate dynamics of DNA methylation in the hours following CD8+ T cell activation, during a critical yet understudied temporal window. DNA methylation is an epigenetic modification central to regulation of gene expression and directing immune responses. Our investigation spanned 96-h post-activation and unveils a nuanced tapestry of global and site-specific methylation changes. We identified 15,626 significant differentially methylated CpGs spread across the genome, with the most significant changes occurring within the genes ADAM10, ICA1, and LAPTM5. While many changes had modest effect sizes, approximately 120 CpGs exhibited a log2FC above 1.5, with cell activation and proliferation pathways the most affected. Relatively few of the differentially methylated CpGs occurred along adjacent gene regions. The exceptions were seven differentially methylated gene regions, with the Human T cell Receptor Alpha Joining Genes demonstrating consistent methylation change over a 3kb window. We also investigated whether an inflammatory environment could alter DNA methylation during activation, with proliferating cells exposed to the oxidant glycine chloramine. No substantial differential methylation was observed in this context. The temporal perspective of early activation adds depth to the evolving field of epigenetic immunology, offering insights with implications for therapeutic innovation and expanding our understanding of epigenetic modulation in immune function.
Introduction
Epigenetic modifications such as DNA methylation play crucial roles in regulating gene expression by influencing the accessibility of DNA to transcriptional machinery [Citation1]. T cell activation and proliferation are modulated by epigenetic mechanisms that shape the development of the adaptive response, however, comprehensive studies elucidating the precise changes in T cell epigenetic profiles are still required [Citation2]. DNA methylation is an epigenetic modification that involves the addition of a methyl group to the DNA, typically at the cytosine residues of CpG dinucleotides and contributes a central role in directing the functionality of immune cells [Citation3]. Unravelling the dynamic interplay between T cell activation and DNA methylation can provide transformative potential for therapeutic interventions and in immune-related disorders, and in understanding the regulatory mechanisms shaping cellular behaviours.
During CD8+ T cell activation, the immune system responds to a pathogen or other stimuli, leading to the proliferation and differentiation of CD8+ T cells into effector cells that can eliminate infected or aberrant cells [Citation4,Citation5]. The activation and proliferation of CD8+ T cells is a highly regulated immune response beginning with the T cell receptor (TCR) on their surface binding to the presented antigens. The interaction between the TCR and the antigen-MHC class I complex (Major Histocompatibility Complex class I) is a key step in activation. Co-stimulatory signals are required to fully activate CD8+ T cells, and include molecules like CD28 on the T cell surface interacting with B7 molecules on antigen-presenting cells [Citation6]. Without co-stimulation, T cells may become tolerant to the antigen. Upon antigen recognition and co-stimulation, intracellular signalling pathways are activated within the CD8+ T cell. This leads to the production of various cytokines and the upregulation of cell surface molecules involved in effector function [Citation7]. Activated CD8+ T cells undergo clonal expansion, where a small number of antigen-specific T cells rapidly proliferate into a large population of effector cells. This amplification is crucial for building an army of T cells capable of responding to the infection [Citation8]. During clonal expansion, CD8+ T cells differentiate into effector cells with specific functions. This includes cytotoxic T cells, which directly kill infected cells, and memory T cells, which persist in circulation poised to proliferate, providing long-term protection against the encountered pathogen [Citation9]. Epigenetic regulation, including DNA methylation, is known to be involved in CD8+ T cell differentiation [Citation10], response to tumours [Citation11] and exhaustion [Citation12]; however, the initial changes that occur following cell activation have not been widely investigated.
It is known that altered epigenetic patterns correlate with the malfunction of effector T cells in tumours [Citation13–16]. Bian et al. have demonstrated that methionine metabolism in CD8+ T cells is disrupted in the tumour microenvironment resulting in lowered intracellular methionine levels. Methionine depletion resulted in lowered levels of the methyl donor S-adenosylmethionine (SAM) and the loss of histone methylation [Citation17]. During the inflammatory response, neutrophils, and to some extent macrophages, will produce hypochlorous acid (HOCl) by means of the haem-containing enzyme myeloperoxidase (MPO) [Citation18]. HOCl, a cytotoxic oxidant, is a short-lived species in biological systems due to its high reactivity with extracellular methionine, and with amines to form chloramines [Citation19]. Chloramines are cell-permeable, longer-lived oxidants that are likely to be present at sites of infection or inflammation. Chloramines react readily with thiol groups and free methionine to cause cell damage and enzyme inactivation [Citation20–23]. We have previously observed that glycine chloramine (GlyCl) directly inhibits DNA methyltransferase 1 (DNMT1) activity and oxidizes methionine, leading to depletion of the methyl donor SAM [Citation22,Citation24]. This resulted in a global decrease in the maintenance of 5-methylcytosine in proliferating cells without significantly impacting cell viability and was associated with site-specific alterations in DNA methylation and subsequent gene expression. We hypothesized that GlyCl exposure during CD8+ T cell activation may have a similar effect on directing DNA methylation, with relevance to the biological processes that occur in the inflammatory microenvironment of the tumour.
Our investigation assesses the resulting DNA methylation changes of CD8+ T cells between 48 and 96 hours post activation, a pivotal period often overlooked in the existing literature. The effect of GlyCl on directing cell fate by altered DNA methylation was also investigated using this paired sample approach.
Materials and methods
Blood collection and separation of CD8+ T cells
Peripheral blood mononuclear cells (PBMCs) were isolated from 50 ml of heparinized blood obtained by venepuncture from eight healthy female volunteers aged 21–25 years with no current infection or history of inflammatory disease. Since immune cell methylation becomes more variable with age we chose to include participants that were close in age. We used women to allow retention of all chromosomes in DNA methylation analyses. Primary CD8+ T cells were isolated from fresh PMBCs by immunomagnetic negative selection using the EasySep™ Human CD8+ T Cell isolation kit (StemCell Technologies), according to the manufacturer’s protocols. This negative selection process involves labelling unwanted cells with antibody complexes and magnetic particles, which are magnetically separated from the untouched cells. The purity of CD8+ T cells was verified by flow cytometry staining with anti-CD8-PE antibody (Beckman Coulter) and was consistently >98%. Red blood cells and monocytes were the major contaminating cell types. Ethical approval for analysis of blood, DNA and DNA methylation from healthy donors was obtained through the University of Otago Ethics Committee (Ref H22/013).
Glycine chloramine preparation
Glycine chloramine (GlyCl) was prepared as previously described [Citation24]. Briefly, hypochlorous acid was added dropwise to a 10 mM excess of glycine in an equivalent volume of PBS while gently vortexing. The concentration of GlyCl was determined using 5-thio-2-nitrobenzoic acid (TNB) by measuring the change in absorbance at 412 nm, using the molar extinction coefficient for TNB (14; 100 M–1 cm−1) and adjusting for the 1:2 stoichiometry of the reaction (GlyCl:TNB).
CD8+ lymphocyte activation and oxidant exposure
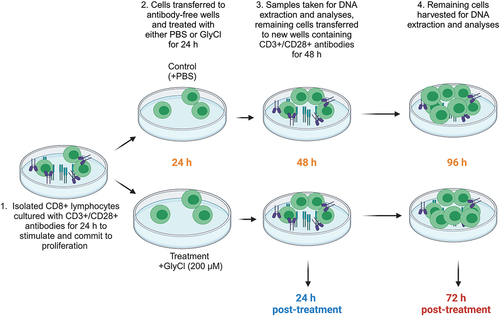
Isolated CD8+ T cells were cultured in RPMI 1640 + 2 mM L-glutamine + 10% foetal bovine serum (FBS) and 1% penicillin/streptomycin (all from Gibco, Life Technologies), and incubated in 5% CO2 at 37°C. Cells were seeded at 106/ml and activated with anti-CD3 (Clone UCHT1), and anti-CD28 (Clone CD28.2) antibodies (Beckman Coulter) for 24 h in 96 well U-bottom tissue culture treated plates (Corning). After initial stimulation, cells were transferred to adjacent wells containing no stimulatory antibodies and media was refreshed so that any change in proliferation or activation could not be attributed to oxidative damage sustained to the CD3/CD28 antibodies as previously described [Citation25]. The cells then received either 200 μM of GlyCl (treatment) or the volumetric equivalent of PBS (control). Twenty-four hours after treatment, samples from each condition were counted and analysed for viability and proliferation. Supernatants and cell pellets were snap frozen and stored at −80º C. The remaining lymphocytes were transferred to adjacent wells containing anti-CD3 and anti-CD28 antibodies and fresh media and were left to proliferate for a further 48 h (72 h post-treatment and 96 h after initial stimulation) (). After incubation, the remaining lymphocytes were assessed for viability, growth and proliferation and supernatants and cell pellets were frozen for DNA extraction and subsequent analyses.
Figure 1. Experimental design.
Cell viability and proliferation
Cell viability was assessed using flow cytometry prior to initial stimulation and then at 24 and 72 h post treatment. The percentage of viable cells was assessed by the exclusion of PI. Growth rate after treatment was determined by live cell counts 24 and 72 h post treatment and expressed as a percent growth (current day count – previous day count)/previous day count x100).
DNA isolation and bisulfite conversion
DNA was extracted from cell samples using a GeneJet DNA extraction kit (ThermoFisher Scientific, USA) according to the manufacturer’s instructions. Sodium bisulphite treatment of genomic DNA was performed on 1000 ng of DNA using the Zymo Research EZ DNA methylation kit (Zymo Research, Irvine, CA), according to the manufacturer’s recommended protocol for use on the Illumina Infinium MethylationEPIC 850K array (Illumina, Inc., San Diego, CA, USA). Genome-wide DNA methylation profiles were assayed with the Illumina Infinium MethylationEPIC 850k array, at AgResearch Ltd (Invermay, New Zealand). Analysis was performed on all samples in a single batch.
DNA methylation detection and bioinformatic analysis of DNA methylation
DNA methylation profiles were assessed using the Illumina methylationEPIC v1.0 bead chip array. Methylated and non-methylated values were determined using the minfi pipeline [Citation26], within R. Probes were annotated against the Infinium MethylationEPIC v1.0 B5 Manifest File, which includes genomic coordinates for hg38 and gene regulatory features from Gencode. Data analyses were performed using the Minfi and Limma [Citation27] Bioconductor software packages within the R statistical program (www.R-project.org). All packages, programs and pipelines used in these analyses are freely available, and the workflow was based upon published scripts [Citation28]. Any additional scripts are available from the authors on request. All samples passed quality control together using Subset-quantile Within Array Normalization (SWAN) [Citation29] and variance-stabilizing transformation [Citation30,Citation31]. Probes containing detection p-values >0.05 for 1% or more samples were excluded from further analysis. One sample failed to pass the quality control criteria, and both replicates were removed from the analysis. Because the cell samples were of the same sex (female), all chromosomes were retained; however, probes identified as having polymorphic hybridizing potential and homology to common SNPs [Citation32] were removed. The final data frame contained 808,953 probes available for analysis. Multidimensional scaling of the top 1000 methylation values was performed using pairwise distance method for gene selection, and normalized, filtered methylation values. Hierarchical clustering was performed on a ‘minkowski’ distance matrix calculated using the β-values for all probes, regardless of significance [Citation27].
The methylation status of each probe was calculated using normalized probe signals represented as methylation values (M-values) and β-values. M-values were generated within Minfi as the log2 ratio of the signal intensities of methylated probe divided by the unmethylated probe. Unless stated otherwise, statistical analyses were performed using the M-values. β-values (average DNA methylation level for each probe) were used for data visualization and range from 0 (unmethylated) to 1 (methylated). β-values were generated by dividing the methylated probe signal with the sum of the methylated and unmethylated probe signals [Citation33]. Normalized β-values and M-values were manually assessed for fit (Additional file 1: Figure S1).
Differentially methylated positions which are correlated with treatment were identified using a linear regression model within the Limma package, with adjustment for multiple testing. To control for interindividual DNA methylation, paired samples were used from the same participants at both time points and replicate was incorporated as a factor into the statistical design. DNA methylation profiles from the 48 h cell aliquots were subtracted from the 96 h samples. This analysis did not include the cells exposed to GlyCl. The top most significant, differentially methylated CpG positions were identified by significance and were also assessed using a log2FC <1.5 in Limma’s topTable algorithm. Adjustment for multiple correction was performed using the ‘Benjamini, Hochberg’ method within Limma and Quantile – Quantile plots for the linear regression model were assessed at each time point using the observed against expected – log10(p-value) (Additional file 2: Figure S1). The observed data show a minor inflation of p-values smaller than expected by chance.
Pathway analysis was performed by comparison gene ontology database (GO) using the Gometh algorithm within the missMethyl R package, with correction for probe bias [Citation34]. Pathway analysis was performed on significant CpG positions that mapped to the regions located from −1500 to −200 base pairs upstream of the transcription start site, and within the first gene exon. The output from the gene ontology analysis was then assessed using the Navigo online algorithm [Citation35], with Resnik semantic similarity-based scoring [Citation36].
Differentially methylated regions
Differentially methylated regions were interrogated within the Minfi package using the statistical package DMRcate [Citation37]. A methylation differential cut-off of 10 across 5 or more adjacent CpGs was used, and significance was determined using a false discovery rate (FDR) of 0.05.
Results
T cell activation and proliferation is associated with DNA methylation change
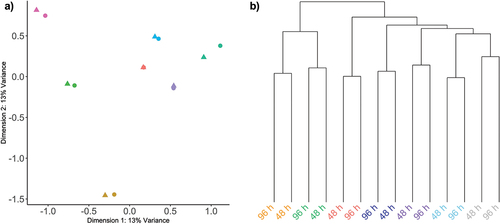
Principle component and hierarchical clustering analysis demonstrated that after 48 h relatively minor DNA methylation changes were observed, and as expected the predominant sources of variation corresponded with interindividual variation (). In both instances, DNA methylation profiles were correctly paired with samples from the same participants.
Figure 2. Unsupervised assessment of data variability.
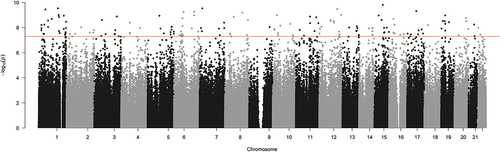
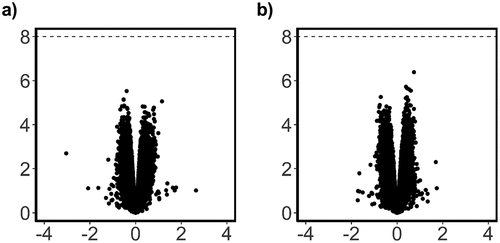
There was no significant global change in the relative level of DNA methylation across all probes on the array (p = 0.06, data not shown). Previous analysis indicated that the largest source of variation in DNA methylation was associated with interindividual variation (). This was accounted for in our statistical design, which controlled for replication of participants’ samples, and contrasted DNA methylation changes between paired samples at the two time points. There were 15,626 CpGs that demonstrated a significant change between the 48 h and 96 h time points, of which 11,693 were associated with an increase in methylation and 3,933 were associated with a decrease in methylation (). The majority of these changes had a relatively small effect size, with only 126 probes demonstrating an effect size greater than a log2 fold change of 1.5. The relative average change in DNA methylation at these 15,626 CpG positions was associated with a significant increase in methylation equivalent to 2.8% between the 48 h and 96 h time points (p=0.0005, t = 4.7) (). To summarize the results, each probe was mapped to the corresponding genomic region and unadjusted significance was plotted across the whole genome as a Manhattan plot. This analysis demonstrated that the significant changes appeared to be concentrated at specific locations across the genome ().
Figure 3. Global DNA methylation (β-values) for all probes.
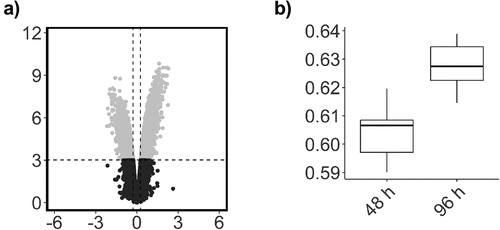
Figure 4. Scatterplot of probe significance ordered by genomic location for all probes across the array, calculated using M-Values.
The top 20 significantly differentially methylated positions in order of significance are presented in , which all corresponded with an increase in methylation. To visualize the corresponding change in methylation the raw β-values of the top six most significant CpGs were visualized in and demonstrated an increase in methylation approximately equivalent to 25%.
Figure 5. Box plots showing representative β-values at each time point.
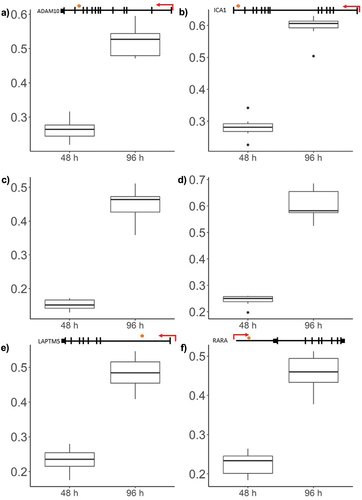
Table 1. The top 20 most significant differentially methylated positions, ordered by significance*.
Top differentially methylated gene regions
We next investigated if multiple probes mapping to the same genomic loci demonstrated consistent methylation changes. We limited this analysis to differentially methylated regions (DMRs) that contained five or more adjacent significant CpGs, with an average change in methylation larger than 10%. Under these parameters, we detected seven significant DMRs that differed between the two time points (), of which six corresponded with annotated gene regions. In contrast with the general trend observed for differentially methylated CpGs, most DMRs demonstrated a decrease in methylation between the 48 and 96 h time points ().
Figure 6. Topmost significant genomic regions displaying differential methylation, across adjacent probe loci.
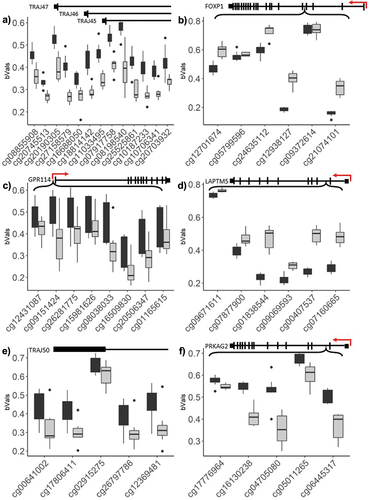
Table 2. Significant DMRs between 48 h and 96 h time points.
Gene pathway analysis
The genes corresponding to the topmost significant CpGs were assessed for biological relevance by pathway analysis within the GO databases. This analysis was performed on genes that mapped within gene promoters or the first exon and returned 256 significant molecular pathways. The top pathways for each ontology type are presented in . When the top most significant CpG sites with a log2FC above 1.5 were assessed there were no significant associations with GO terms detected (data not shown). This suggests that relatively small and widespread changes may contribute substantially towards biological outcomes.
Table 3. GO pathway terms associated with each ontology type for the genes that demonstrated a significant DNA methylation change, and mapped to promoter regions.
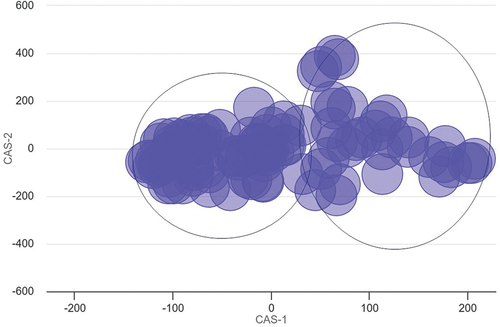
To summarize the large number of influenced pathways, the top 100 most significant biological processes were investigated for functional similarity and their co-occurrence association [Citation35]. This approach demonstrated that the pathway results approximately separated into two groups (). There was a higher density of pathways defined by those that correspond with activation and proliferation, compared against those that correspond with cell signalling and immune response.
Figure 7. Multidimensional scaling (MDS) plot of top 100 significant pathways.
Effect of glycine chloramine on DNA methylation
Our previous work with T-lymphoma cells demonstrated that exposure to glycine chloramine (GlyCl) corresponded with large genome-wide changes in DNA methylation [Citation24]. We hypothesized that subjecting CD8+ T cells to oxidative stress, akin to that observed during inflammation, could potentially modify DNA methylation patterns during replication. For each participant, the cells were separated into treatment and control samples and exposed to glycine chloramine or PBS. DNA was harvested 24 and 72 h after treatment, and DNA methylation was assessed by comparing the paired treatment and control samples at each time point.
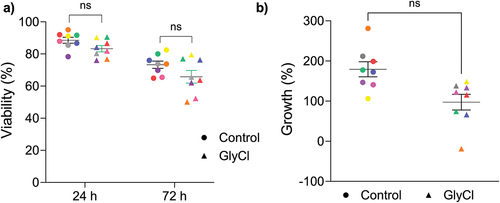
T cell viability was assessed at 24 and 72 h after treatment by calculating the percentage of cells negative for propidium iodide (PI) by flow cytometry. GlyCl treatment resulted in a small but statistically insignificant decrease in the percentage of live cells at each time point (). GlyCl treatment did not appreciably decrease the percentage growth compared to control at either time point ().
Figure 8. T cell viability and growth.
We did not detect substantial DNA methylation changes associated with GlyCl changes at either time point, after adjustment for multiple correction (). At 24 h, the top most significant probes had an adjusted p value of approximately 0.4 and were not investigated further. At the 72 h time point the top probe was associated with the TRPC6 gene and demonstrated a LogFC of 0.7 (adj p = 0.3) (data not shown).
Figure 9. Analysis of overall DNA methylation change due to GlyCl treatment.
Discussion
Our analysis used a paired sample design to investigate the DNA methylation changes that occurred during primary CD8+ T cell activation and proliferation. The CD3/CD28 antibody activation assay used in this study is a common approach used to stimulate lymphocyte proliferation in vitro, yet studies that have explored temporal changes in DNA methylation after activation are rare. Based on published literature [Citation17] and our prior research [Citation24,Citation38] we hypothesized that an inflammatory cellular environment may alter the processes of DNA methylation. DNA methylation analysis was performed using the Illumina EPIC850K array, with a robust statistical design that used paired samples at each time point, and accounted for participant replication. Our experimental design used paired samples from seven participants, after one complete experimental replicate was removed after failing quality control. Removing one replicate substantially decreased our statistical power, however, it did not alter the study outcomes.
When comparing T cells 48 and 96 hours after stimulation, there was a general trend of increased methylation following activation, where the top most significant differentially methylated CpGs contribute a significant increase in methylation of ~3%. This effect was spread over 15,626 CpG positions, including only seven DMRs of five or more adjacent CpGs. The resulting DNA methylation levels appeared to be relatively constrained, with no detectable difference in global DNA methylation across the array. In contrast to the trend exhibited by differentially methylated CpGs, most DMRs demonstrated decreased methylation, which is generally associated with the relaxation of the DNA backbone and active transcription. The identification of top differentially methylated genes provides a glimpse into the genomic landscape most responsive to T cell activation. The top methylation changes corresponded to significant increased methylation and occurred at genes including ADAM10, ICA1, and LAPTM5, which have known roles in immune regulation of T-cells. Increased methylation at these sites may have led to decreased expression of these genes that would likely result in an increase in the cytotoxic capacity of the CD8+ T cell. For example, ADAM10 codes for ‘a disintegrin and metalloprotease’ (ADAM) protease that modulates the cell membrane expression of the Fas ligand, a major effector molecule of cytotoxic T lymphocytes [Citation39]. ADAM10 cleavage of the Fas ligand has been shown to counter the killing activity of T cells [Citation40]. LAPTM5 is involved in the lysosomal degradation of the CD3 receptor which negatively affects activation in both T cells and B cells [Citation41,Citation42]. ICA1 codes for auto-antigen and is most highly expressed in T regulatory cells, suggesting that activation in our model shifted DNA methylation profiles towards a phenotype with effector T cell attributes [Citation43].
The top most significant biological processes all related to T cell activation and proliferation, interestingly the changes of largest effect size were not strongly associated with known biological processes. The seemingly modest effect sizes of methylation changes underscore the importance of nuanced epigenetic modifications in directing immune responses and the precision with which T cell activation orchestrates epigenetic modifications. The non-random distribution of these changes across the genome warrants further investigation. These findings bear significant implications for our understanding of immune regulation, hinting at a targeted and context-dependent nature of DNA methylation alterations during T cell activation. These results posit that even small and widespread changes in DNA methylation might wield considerable influence over biological outcomes and in shaping the immune landscape.
CD8+ lymphocytes were treated with a sublethal dose of glycine chloramine 24 h after initial stimulation to target the time point when the cells would be rapidly replicating and remethylating their DNA prior to first cell division. It was surprising that GlyCl treatment did not result in a significant reduction in proliferation in these cells, which has previously been observed in a similar experimental system using activated neutrophils [Citation44]. We also did not observe any DNA methylation changes unique to GlyCl exposure, which suggests that once the CD8+ T-cells have committed to proliferation, early events may occur in the cell that protect against mild oxidative stress and methionine depletion. T cells possess robust mechanisms to guard against disruptions by environmental stressors. Upon stimulation, T cells undergo rapid upregulation of the methionine transporter Slc7a5, which imports methionine for use in protein synthesis and can be converted into SAM [Citation45]. It is possible that the T cells in our model were able to increase methionine uptake more rapidly than expected, such that depletion of extracellular methionine through exposure to GlyCl was ineffective at sufficiently reducing methionine levels within the cell [Citation45]. Our previous work in T-lymphoma cells demonstrated that GlyCl can also impair DNA methylation by directly inhibiting DNMT1 activity [Citation22,Citation24] and other studies have shown that DNMT activity is a requirement for murine CD8+ T cell proliferation and effector phenotype differentiation [Citation46]. We therefore speculate that the concentration of GlyCl in our system was insufficient to both deplete methionine and inhibit DNMT activity in CD8+ T cells at the time points analysed. More extensive investigations of the impact of GlyCl on CD8+ T cells is warranted. Despite T cells being stimulated at the same time, our previous work was performed on cell cycle synchronized T-lymphoma cells which allows for more confidence about the timing of DNA replication. Our hypothesis was partially based on previous work that demonstrated methionine depletion through co-culture with tumour cells had a significant effect on histone methylation in CD8+ T cells [Citation17], however histone methylation was not assessed in our study. It is feasible that chromatin conformational changes at our chosen time points rendered the DNA inaccessible during GlyCl exposure. Investigating histone methylation changes in the context of chloramine exposure or in a neutrophil co-culture model may be a more important aspect of the epigenetic response in CD8+ T cells under inflammatory conditions.
Epigenetic processes are central to T cell lineage decisions but most studies have focussed on the impact of histone modifications in disease and infection models [Citation47,Citation48] and DNA methylation studies of CD8+ T cell activation using CD3/CD28 stimulation models have been conducted primarily in mice [Citation46,Citation49]. Our study has a unique emphasis on the dynamics of DNA methylation during the critical early hours of T cell activation. This novel temporal perspective adds a layer of complexity to the understanding of epigenetic regulation in the context of immune responses.
Conclusion
Our investigation into CD8+ T cell activation and DNA methylation dynamics presents new insights into the epigenetic events steering stimulatory responses. The activation of CD8+ T cells through CD28 and CD3 antibodies instigates a cascade of significant alterations in DNA methylation profiles. The observed changes, though subtle, may orchestrate important downstream effects in the immune response. Understanding the epigenetic regulation of T cells soon after activation contributes valuable insights to the broader field of immunology and opens avenues for future investigations into the development of targeted therapies that can recalibrate immune responses in the context of various diseases.
Author contributions
ARS and AJS designed and carried out the experiments and wrote the manuscript. OD aided with bioinformatic analyses and MBH aided in experimental design and edited the manuscript.
Supplementary_File1_S1.xlsx
Download MS Excel (27 KB)Supplementary_File_S2.xlsx
Download MS Excel (303.9 KB)Additional_File_2_Fig.1_qq_Activation.jpg
Download JPEG Image (823.4 KB)
Additional_file_1_Fig1_.pdf
Download PDF (419.6 KB)Acknowledgments
We would like to thank the Health Research Council of New Zealand (AJS) and the Canterbury Medical Research Foundation (ARS) for funding this research. We are grateful to Dr Judith Mackenzie and Dr Barry Hock of the University of Otago, Christchurch for assistance with flow cytometry and experimental design.
Disclosure statement
No potential conflict of interest was reported by the author(s).
Data availability statement
The authors confirm that the analysed data supporting the findings of this study are available within the article [and/or] its supplementary materials. Request for raw data files can be made available from the corresponding author AJS upon reasonable request; however, these represent private data and are not available for public use.
Supplementary material
Supplemental data for this article can be accessed online at https://doi.org/10.1080/15592294.2024.2367385
Additional information
Funding
References
- Reik W. Stability and flexibility of epigenetic gene regulation in mammalian development. Nature. 2007;447(7143):425–14. doi: 10.1038/nature05918
- Dutta A, Venkataganesh H, Love PE. New insights into epigenetic regulation of T cell differentiation. Cells. 2021 Dec;10(12):3459. doi: 10.3390/cells10123459
- Probst AV, Dunleavy E, Almouzni G. Epigenetic inheritance during the cell cycle. Nat Rev Mol Cell Biol. 2009;10(3):192–206. doi: 10.1038/nrm2640
- Zhang N, Bevan MJ. CD8(+) T cells: foot soldiers of the immune system. Immunity. 2011 Aug;35(2):161–168. doi: 10.1016/j.immuni.2011.07.010
- Sigal LJ. Activation of CD8 T lymphocytes during viral infections. Encycl Immunobiol. 2016:286–290. doi:10.1016/B978-0-12-374279-7.14009-3.
- Pardigon N, Bercovici N, Calbo S, et al. Role of co-stimulation in CD8+ T cell activation. Int Immunol. 1998 May;10(5):619–630. doi: 10.1093/intimm/10.5.619
- Barber A. Costimulation of effector CD8+ T cells: which receptor is optimal for immunotherapy? MOJ Immunol. 2014;1(2):42–44. doi: 10.15406/moji.2014.01.00011
- Curtsinger JM, Johnson CM, Mescher MF. CD8 T cell clonal expansion and development of effector function require prolonged exposure to antigen, costimulation, and signal 3 cytokine. J Immunol. 2003 Nov;171(10):5165–5171. doi: 10.4049/jimmunol.171.10.5165
- Martin MD, Badovinac VP. Defining memory CD8 T cell. Front Immunol. 2018;9:2692. doi: 10.3389/fimmu.2018.02692
- Sellars M, Huh JR, Day K, et al. Regulation of DNA methylation dictates Cd4 expression during the development of helper and cytotoxic T cell lineages. Nat Immunol. 2015 Jul;16(7):746–754. doi: 10.1038/ni.3198
- Yang R, Cheng S, Luo N, et al. Distinct epigenetic features of tumor-reactive CD8+ T cells in colorectal cancer patients revealed by genome-wide DNA methylation analysis. Genome Biol [Internet]. 2019;21(1):2. doi: 10.1186/s13059-019-1921-y
- Wong WK, Yin B, Lam CYK, et al. The interplay between epigenetic regulation and CD8(+) T cell differentiation/exhaustion for T cell immunotherapy. Front Cell Dev Biol. 2021;9:783227. doi: 10.3389/fcell.2021.783227
- Pauken KE, Sammons MA, Odorizzi PM, et al. Epigenetic stability of exhausted T cells limits durability of reinvigoration by PD-1 blockade. Science. 2016;354(6316):1160–1165. doi: 10.1126/science.aaf2807
- Philip M, Fairchild L, Sun L, et al. Chromatin states define tumour-specific T cell dysfunction and reprogramming. Nature. 2017 May;545(7655):452–456. doi: 10.1038/nature22367
- Sen DR, Kaminski J, Barnitz RA, et al. The epigenetic landscape of T cell exhaustion. Science. 2016;354(6316):1165–1169. doi: 10.1126/science.aae0491
- Wherry EJ. T cell exhaustion. Nat Immunol. 2011 Jun;12(6):492–499. doi: 10.1038/ni.2035
- Bian Y, Li W, Kremer DM, et al. Cancer SLC43A2 alters T cell methionine metabolism and histone methylation. Nature [Internet]. 2020;585(7824):277–282. doi: 10.1038/s41586-020-2682-1
- Winterbourn CC, Kettle AJ, Hampton MB. Reactive oxygen species and neutrophil function. Annu Rev Biochem. 2016;85(1):765–792. doi: 10.1146/annurev-biochem-060815-014442
- Winterbourn CC. Reconciling the chemistry and biology of reactive oxygen species. Nat Chem Biol. 2008;4(5):278–286. doi: 10.1038/nchembio.85
- Peskin AV, Midwinter RG, Harwood DT, et al. Chlorine transfer between glycine, taurine, and histamine: reaction rates and impact on cellular reactivity. Free Radic Biol Med. 2005;38(3):397–405. doi: 10.1016/j.freeradbiomed.2004.11.006
- Peskin AV, Winterbourn CC. Histamine chloramine reactivity with thiol compounds, ascorbate, and methionine and with intracellular glutathione. Free Radic Biol Med. 2003;35(10):1252–1260. doi: 10.1016/S0891-5849(03)00502-1
- O’Connor KM, Das AB, Winterbourn CC, et al. Inhibition of DNA methylation in proliferating human lymphoma cells by immune cell oxidants. J Biol Chem. 2020 Jun;295(23):7839–7848. doi: 10.1074/jbc.RA120.013092
- Pullar JM, Vissers MCM, Winterbourn CC. Living with a killer: the effects of hypochlorous acid on mammalian cells. IUBMB Life. 2000;50(4–5):259–266. doi: 10.1080/15216540051080958
- Seddon AR, Das AB, Hampton MB, et al. Site-specific decreases in DNA methylation in replicating cells following exposure to oxidative stress. Hum Mol Genet. 2022;32(September):1–17.
- Hock BD, Mckenzie JL. Suppression of CD3/CD28 antibody stimulated responses by human granulocytic myeloid-derived suppressor cells: fact or artefact? Immunol Lett [Internet]. 2013 May [cited 2013 Sep 28];152(2):151–152. doi: 10.1016/j.imlet.2013.05.009
- Aryee MJ, Jaffe AE, Corrada-Bravo H, et al. Minfi: a flexible and comprehensive bioconductor package for the analysis of infinium DNA methylation microarrays. Bioinformatics. 2014 May;30(10):1363–1369. doi: 10.1093/bioinformatics/btu049
- Ritchie ME, Phipson B, Wu D, et al. limma powers differential expression analyses for RNA-sequencing and microarray studies. Nucleic Acids Res [Internet]. 2015 Apr 20;43(7):e47–e47. doi: 10.1093/nar/gkv007
- Maksimovic J, Phipson B, Oshlack A. A cross-package bioconductor workflow for analysing methylation array data. F1000Res. 2017;5:1–51. doi: 10.12688/f1000research.8839.3
- Maksimovic J, Gordon L, Oshlack AS. SWAN: Subset-quantile within array normalization for illumina infinium HumanMethylation450 BeadChips. Genome Biol. 2012;13(6):1–12. doi: 10.1186/gb-2012-13-6-r44
- Shi W, Oshlack A, Smyth GK. Optimizing the noise versus bias trade-off for illumina whole genome expression BeadChips. Nucleic Acids Res. 2010;38(22):e204–e204. doi: 10.1093/nar/gkq871
- Lin SM, Du P, Huber W, et al. Model-based variance-stabilizing transformation for Illumina microarray data. Nucleic Acids Res. 2008;36(2):1–9. doi: 10.1093/nar/gkm1075
- Pidsley R, Zotenko E, Peters TJ, et al. Critical evaluation of the illumina MethylationEPIC BeadChip microarray for whole-genome DNA methylation profiling. Genome Biol [Internet]. 2016;17(1):1–17. doi: 10.1186/s13059-016-1066-1
- Du P, Zhang X, Huang CC, et al. Comparison of Beta-value and M-value methods for quantifying methylation levels by microarray analysis. BMC Bioinf [Internet]. 2010;11(1):587. doi: 10.1186/1471-2105-11-587
- Phipson B, Maksimovic J, Oshlack A. missMethyl: an R package for analyzing data from illumina’s HumanMethylation450 platform. Bioinformatics. 2016;32(2):286–288. Oxford University Press. doi: 10.1093/bioinformatics/btv560
- Wei Q, Khan IK, Ding Z, et al. NaviGO: interactive tool for visualization and functional similarity and coherence analysis with gene ontology. BMC Bioinf [Internet]. 2017;18(1):177. doi: 10.1186/s12859-017-1600-5
- Schlicker A, Domingues FS, Rahnenführer J, et al. A new measure for functional similarity of gene products based on gene ontology. BMC Bioinf [Internet]. 2006;7(1):302. doi: 10.1186/1471-2105-7-302
- Peters TJ, Buckley MJ, Eagleson GK, et al. De novo identification of differentially methylated regions in the human genome. Epigenetics Chromatin. 2015;8(1):6. doi: 10.1186/1756-8935-8-6
- Seddon AR, Liau Y, Pace PE, et al. Genome-wide impact of hydrogen peroxide on maintenance DNA methylation in replicating cells. Epigenet Chromatin. 2021;14(1):1–16. doi: 10.1186/s13072-021-00388-6
- Ebsen H, Lettau M, Kabelitz D, et al. Subcellular localization and activation of ADAM proteases in the context of FasL shedding in T lymphocytes. Mol Immunol. 2015 Jun;65(2):416–428. doi: 10.1016/j.molimm.2015.02.008
- Schulte M, Reiss K, Lettau M, et al. ADAM10 regulates FasL cell surface expression and modulates FasL-induced cytotoxicity and activation-induced cell death. Cell Death Differ. 2007 May;14(5):1040–1049. doi: 10.1038/sj.cdd.4402101
- Kawai Y, Ouchida R, Yamasaki S, et al. LAPTM5 promotes lysosomal degradation of intracellular CD3ζ but not of cell surface CD3ζ. Immunol Cell Biol. 2014;92(6):527–534. doi: 10.1038/icb.2014.18
- Ouchida R, Kurosaki T, Wang J-Y. A role for lysosomal-associated protein transmembrane 5 in the negative regulation of surface B cell receptor levels and B cell activation. J Immunol. 2010;185(1):294–301. doi: 10.4049/jimmunol.1000371
- Höllbacher B, Duhen T, Motley S, et al. Transcriptomic profiling of human effector and regulatory T cell subsets identifies predictive population signatures. ImmunoHorizons. 2020 Oct;4(10):585–596. doi: 10.4049/immunohorizons.2000037
- Hock BD, Taylor KG, Cross NB, et al. Effect of activated human polymorphonuclear leucocytes on T lymphocyte proliferation and viability. Immunology. 2012 Nov;137(3):249–258. doi: 10.1111/imm.12004
- Sinclair LV, Rolf J, Emslie E, et al. Control of amino-acid transport by antigen receptors coordinates the metabolic reprogramming essential for T cell differentiation. Nat Immunol. 2013;14(5):500–508. doi: 10.1038/ni.2556
- Chappell C, Beard C, Altman J, et al. DNA methylation by DNA methyltransferase 1 is critical for effector CD8 T cell expansion. J Immunol. 2006;176(8):4562–4572. doi: 10.4049/jimmunol.176.8.4562
- Araki K, Turner AP, Shaffer VO, et al. mTOR regulates memory CD8 T-cell differentiation. Nature [Internet]. 2009;460(7251):108–112. doi: 10.1038/nature08155
- Crompton JG, Narayanan M, Cuddapah S, et al. Lineage relationship of CD81 T cell subsets is revealed by progressive changes in the epigenetic landscape Joseph. Cell Mol Immunol [Internet]. 2015;13(4):502–513. doi: 10.1038/cmi.2015.32
- Scharer CD, Barwick BG, Youngblood BA, et al. Global DNA methylation remodeling accompanies CD8 T cell effector function. J Immunol. 2013;191(6):3419–3429. doi: 10.4049/jimmunol.1301395