
ABSTRACT
Elevated temperatures critically impact crop growth, development, and yield, with photosynthesis being the most temperature-sensitive physiological process in plants. This study focused on assessing the photosynthetic response and genetic adaptation of two different heat-resistant jujube varieties ‘Junzao’ (J) and ‘Fucuimi’ (F), to high-temperature stress (42°C Day/30°C Night). Comparative analyses of leaf photosynthetic indices, microstructural changes, and transcriptome sequencing were conducted. Results indicated superior high-temperature adaptability in F, evidenced by alterations in leaf stomatal behavior – particularly in J, where defense cells exhibited significant water loss, shrinkage, and reduced stomatal opening, alongside a marked increase in stomatal density. Through transcriptome sequencing 13,884 differentially expressed genes (DEGs) were identified, significantly enriched in pathways related to plant-pathogen interactions, amino acid biosynthesis, starch and sucrose metabolism, and carbohydrate metabolism. Key findings include the identification of photosynthetic pathway related DEGs and HSFA1s as central regulators of thermal morphogenesis and heat stress response. Revealing their upregulation in F and downregulation in J. The results indicate that these genes play a crucial role in improving heat tolerance in F. This study unveils critical photosynthetic genes involved in heat stress, providing a theoretical foundation for comprehending the molecular mechanisms underlying jujube heat tolerance.
1. Introduction
Rising global temperatures have intensified heat stress, a major limiting factor in global crop cultivation and yield.Citation1 Plants have evolved multiple strategies to combat high temperatures at the cellular, physiological, and molecular levels to effectively reduce the negative effects of high-temperature stress on crop growth and development.Citation2,Citation3 Photosynthesis is one of the most sensitive physiological processes in plants to temperature change.Citation4 The increasing adaptability of plants to high-temperature stress is related to the production of various hormones, and antioxidants, as well as dynamic membrane regulation and stomatal closure.Citation5,Citation6 Heat stress reduces leaf stomatal conductance, thus controlling the transpiration rate and photosynthetic rate.Citation7 When the temperature is within the range required for plant growth, warming can increase stomatal conductance and intercellular CO2 concentration, thereby promoting photosynthesis. However, when the temperature exceeds the range required for plant growth, it leads to a decrease in net photosynthetic rate and water use efficiency.Citation8
High-temperature stress not only harms the external morphology of the plant body but also affects the microstructure of plant cells. Under continuous high-temperature stress, mass wall separation will appear in most parts of plant cells and even lead to the rupture and disintegration of the vacuole membrane; the chloroplast will be destroyed; The outer mitochondrial membrane ruptures and gradually disintegrates, and its function is disrupted.Citation9 Heat stress, at the molecular level, mainly changes the way genes participate in signaling pathways but also changes the transcriptional regulation and expression of genes in various pathways at the molecular level.Citation10 Previous studies have found that gene expression levels induced by heat stress are regulated by transcription factors (TFs).Citation11 High-temperature stress inhibits the photosynthetic process by reducing the enzyme activity of chloroplast protein complexes.Citation12 For example, ribulose 1,5-diphosphate carboxylase and Rubisco-activase are high-temperature-sensitive enzymes.Citation13,Citation14 Disruption of high-temperature stress-mediated photosynthesis leads to the accumulation of reactive oxygen species (ROS), which leads to the oxidation of proteins, lipids, carbohydrates, and DNA, ultimately acting together to kill plant cells.Citation15,Citation16
Jujube (Ziziphus jujuba Mill.) belongs to the family Rhamnaceae and is a traditional tree native to China.Citation17 The planting area of China is approximately 3.25 million hectares.Citation18 It is widely cultivated in many arid and semi-arid marginal lands in China because of its superior drought resistance, salt and alkali resistance and barren resistance, and is an important source of income for nearly 20 million farmers in China.Citation19 In recent years, high temperature stress has obviously affected the growth of jujube and has attracted people’s attention. Some differentially expressed genes responsive to high temperature stress were identified.Citation20 The expression of ZjALDHCitation21 and ZjBAMCitation22 gene families in response to high temperature stress was analyzed. The elevated temperature (1.5–2.5°C than normal temperature) can increased the fruit sugar content, sugar-acid ratio, anthocyanins, flavonoids and carotenoids content.Citation23 However, little is known about the gene expression related to photosynthesis in jujube under high temperature stress. In this study, two different heat-resistant jujube varietiesCitation24 that we reported were used as experimental materials to comparing their phenotypes, photosynthetic physiology, and transcriptional changes under high temperature stress. The aim was to analyze and study the expression changes of relevant differential genes in the photosynthetic pathway in response to high-temperature stress in jujube, and to tap into potential heat-stressed photosynthesis-related genes and transcription factors. This study contributes to a better understanding of the defense mechanisms associated with heat tolerance in jujube.
2. Materials and methods
2.1. Experimental materials
The test materials were 2-year-old J(Junzao, a heat sensitive variety) and F(Fucuimi, a heat-resistant variety) jujube-grafted potted seedlings, and the planting containers were 10 L plastic flowerpots with good management. The tree height was 80 cm, the crown width was 50 ~ 75 cm, and the trunk circumference was 6 cm. During heat stress, 400 ml of water per pot was provided at 20:00 per day, and 200 ml of Hoagland nutrient solution was provided every other day. Potted seedlings were placed in the culture room installed with an intelligent temperature control heater, the temperature was controlled within 42 ± 2°C, high temperature (42℃) stress treatment was carried out for 13 hours from 8 to 21 o ‘clock every day, The remaining 11 hours were spent on night culture at a temperature of 30°C. The photosynthetically effective radiation (PAR) was set to the average jujube light saturation point of 1520 μmol m−2 s−1. Real-time monitoring during the test using LUGER L95–6 temperature and humidity logger, Measurement of air temperature (Ta°C), relative humidity of air (RH%) in the greenhouse at 10 min intervals.
2.2. Sample Collection
Random J and F plants were selected to determine jujube growth potential. For each tree, including the control (0 d), sampling took place at 1 d, 3 d, 5 d, and 7 d after high-temperature stress treatment, and the sampling time was 14:00 each day. Leaves from the central lateral secondary branches (2 ~ 5) with mature function were collected and wiped with dust paper to clean the leaf surface of impurities. Sections with diameters of 6 mm were taken from both sides of the main vein leaves and placed into FAA solution (70% ethanol) in a 4℃refrigerator for preservation for electron scanning observation.
Furthermore, two leaves of the same position at each time point (n = 3) were collected, and the surface impurities of the leaves were washed with precooled distilled water. Then, the samples were cut into small pieces on dust-free paper, loaded into a liquid nitrogen precooled chilled storage tube, frozen in liquid nitrogen for 5 min, and stored in a −80°C refrigerator for transcriptome sequencing.
2.3. Observation of photosynthetic index and microstructure
The leaf photosynthetic indexes of 0 d, 1 d, 3 d, 5 d, and 7 d were determined by a Li100 6400XT portable gas exchange analyzer at the time point of high-temperature stress (n = 5). The change in chlorophyll content under different treatments was determined by a hand-held chlorophyll analyzer.
After dehydration, the blades being used to observe microstructure were freeze-dried to the critical point with an alcohol dilution series and then glued to the loading platform with conductive tape. Samples were coated with a Pt film using an ion sputtering instrument (Hitachi E-1045), and a SUPRA 55VP scanning electron microscope (Zeiss, German) was used for observation of leaves at an accelerating voltage of 2.00 Kv.
2.4. Transcriptome sequencing and data analysis
Leaves of two varieties from each treatment time (n = 3) were taken and total RNA was extracted using the RNA prep Pure polysaccharide polyphenol plant total RNA extraction kit. The purity of the extracted RNA was assessed by a Nano Drop 1000 spectrophotometer (Thermo Fisher Scientific, Wilmington, DE, USA). RNA concentration was determined by using a Qubit® 2.0 Flurometer (Life Technologies, Carlsbad, CA, USA). RNA integrity was assayed using the RNA Nano 6000 Assay Kit for the Agilent Bioanalyzer 2100 system (Agilent Technologies, Santa Clara, CA, USA). Then cDNA libraries were constructed, and after the library check was qualified, different libraries were pooled according to the target downstream data volume, and 30 cDNA libraries were sequenced using Illumina. High-quality clean reads were filtered from the raw reads and then sequence aligned with the reference genome: GCF_000826755.1. Sequence alignment maps were generated by TopHat2 and transcripts were assembled by Cufflinks (http://cufflinks.cbcb.umd.edu/).Citation25 DEGs from different libraries were analyzed using the FPKM (fragments per kilobase transcribed per million mapped reads) method and screened for DEGs using edgeR_DESeq2 software.Citation26 DEGs were identified based on differential fold change (FC ≥ 2) and false discovery rate (FDR ≤0.01). We also performed KEGG significance enrichment analysis of differential genes (p < 0.05) to obtain the functional clustering and metabolic pathways of differential genes in J and F jujube under high-temperature stress and demonstrated the differences in expression patterns of J and F jujube through heatmaps, and performed WGCNA analysis of the sequencing data.
2.5. Quantitative real-time PCR (qRT-PCR) validation
To verify the reliability of the transcriptome sequencing data, qRT‒PCR was used to verify the screened DEGs, referring to the Bu method.Citation27 Gene sequences were obtained from NCBI (http://www.ncbi.nlm.nih.gov/genome/), Primer 3 software (http://frodo.wi.mit.edu/) was used to design primers, ZjActin was used as an internal primer,Citation28 and all sequence primers are shown in Table S1. The same RNA samples used for transcriptome sequencing were used for qRT‒PCR validation. Fluorescence quantitative PCR was performed according to the SYBR® Green PCR Master Mix kit (Applied Biosystems, GA, USA), and the reaction system was 20 μl with the following PCR procedure: initial incubation at 95°C for 15 min, denaturing at 95°C for 10 s, annealing at 55°C for 20 s, and extension at 72°C for 30 s; 40 cycles were performed. The relative gene expression was calculated by the 2−ΔΔCt method.Citation29
2.6. Statistical analysis
SPSS 20.0 statistical software (SPSS, IL, USA) was used for one-way analysis of variance (ANOVA). Duncan’s multiple test was used to analyze the differences between the mean values, and the results were considered significant when the p-value ≤0.05. Data plotting was performed using GraphPad Prism 8.
3. Results
3.1. Environmental changes within the chamber before and after high-temperature treatment
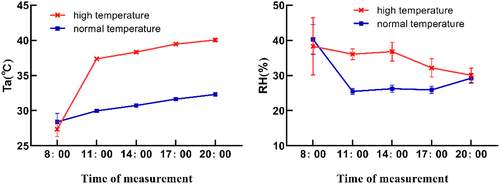
Light intensity in the greenhouse before and after the high-temperature treatment was 500 μmol m−2 s−1. The daily variation of temperature and humidity in the culture room before and after high temperature treatment and the growth environment of date seedlings during the test period are shown in . The daily variation curve of inter-incubation temperature Ta (°C) showed a gradual increasing trend, Maximum temperature of 32.5°C before treatment and 41.1°C after treatment. Both reach their maximum at 20:00. The daily change curves of air relative humidity RH/% in the incubation room before and after treatment were completely different, The relative humidity of the air was maximum at 33.93% at 8:00 a.m. before the treatment and then showed a sharp downward trend. The minimum value of 24.88% was reached at 11:00, and the relative humidity of the air kept increasing with the prolongation of light time, The daily trend of air relative humidity in the observed time period after heating was: decreasing, then increasing, and then gradually decreasing, reaching a peak of 36.8% at 14:00, and decreasing to a minimum value of 29.3% at 20:00.
Figure 1. Diurnal change of temperature and humidity before and after high temperature treatment.
3.2. Phenotypic and photosynthetic responses of two varieties to continuous high-temperature stress
According to the genetic characteristics of the plants, different leaves of the same tree were different in structure, thickness, and chlorophyll content.Citation30 shows that F exhibited no significant phenotypic changes under high temperature for 7 days. In contrast, J showed leaf wilting and curling with prolonged heat exposure, leading to complete leaf wilting, curling, and shedding after 7 days. As shown in , during high-temperature stress, the intercellular CO2 concentration of the leaves of F was always lower than that of J (–), and the stomatal conductivity of F was greater than that of J (–); therefore, the stomata of F leaves may not completely close and still undergo gas exchange, indicating CO2 utilization is high, water utilization is also relatively high(), and the photosynthetic function is satisfactory, making F photosynthesis stronger than J photosynthesis(). In the absence of high-temperature stress, the leaf transpiration rates of two varieties were equal and minimal, With the extension of heat stress time F was always higher than J. This may be due to transpiration lowering the temperature of the tree, so that F receives less heat damage(–), The higher transpiration rate carries away some of the heat, so during high-temperature stress F leaf temperature is always lower than J(–), that the chlorophyll content of F decreased sharply to the lowest level when the heat stress lasted for 1 d and then increased continuously with the increase in the number of days of heat stress, while the chlorophyll content of J always decreased with the increase in the number of days of heat stress(–).
Figure 2. Photosynthetic response to high-temperature stress: (a) Phenotypes under dynamic high-temperature stress in F and J. (b) Photosynthetic parameters under high-temperature stress in F and J. The error bars represent standard error.
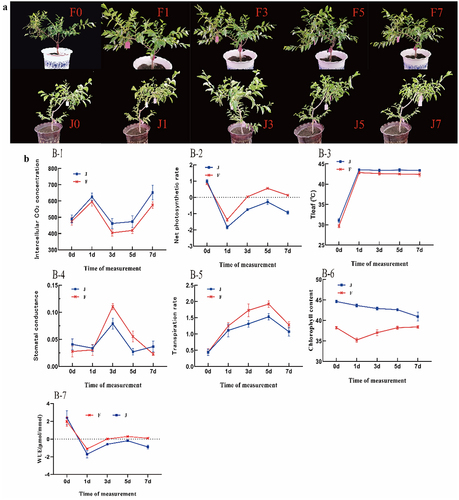
Figure 3. SEM results of two varieties leaves under high-temperature stress.
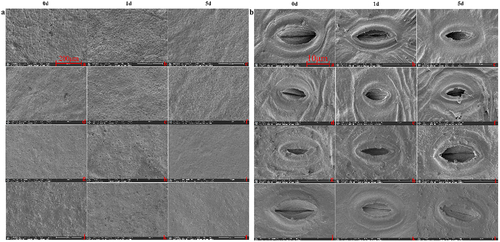
Figure 4. Comparison of transcriptome data of two varieties under different high temperature treatments. (a) PCA analysis. (b,c) Venn diagram of DEGs in different comparison groups. (d) Statistical bar chart of the number of DEGs by comparing F0 vs J0, F1 vs J1, F3 vs J3, F5 vs J5, and F7 vs J7. Blue represents the number of upregulated DEGs, while red stands for downregulated DEGs.
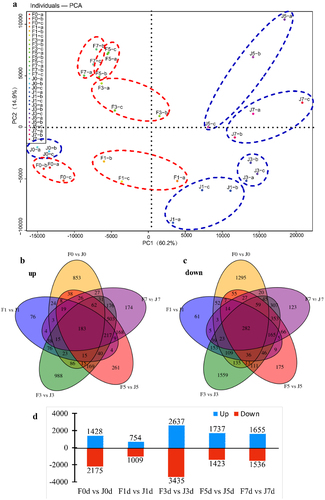
Figure 5. Comparative transcriptomic analysis. (a) Clustering analysis of WGCNA co-expressed genes. (b) Comparison of F1 vs J1 and F3 vs J3 volcano plots, with green dots representing down-regulated genes and red dots representing up-regulated genes. (c) Comparison of F1 vs J1 and F3 vs J3 KEGG-enriched top 20 pathways.
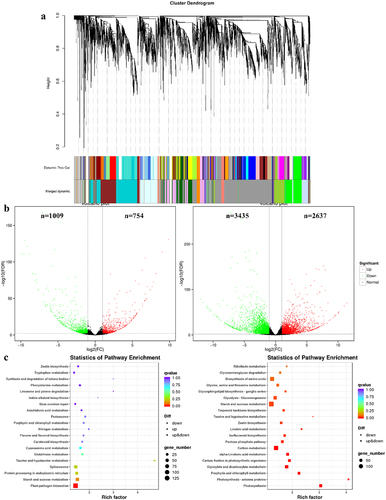
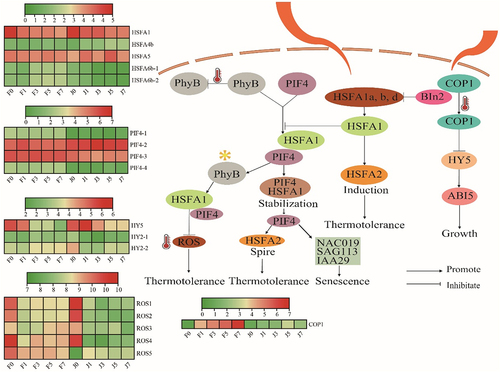
Figure 6. Expression analysis of the photosynthesis pathway and its core genes and transcription factors. HSFA, heat shock transcription factor; PIF4, phytochrome interacting factor 4; ROS, reactive oxygen species; COP1, constitutive photomorphogenic1; HY, elongated hypocotyl; phyB, phytochrome B; BIN2, brassinosteroid insensitive 2; ABI5, abscisic acid-insensitive 5; NAC019, N-Acetyl cysteine019; SAG113, surface antigen 113; IAA29, indole acetic acid 29. The colors of squares indicate the fold changes of the DEGs (red is upregulated and green is downregulated).
3.3. Effects of high temperature stress on microstructure of leaves
Utilizing 200× and 3500× magnification, the study captured the stomatal characteristics of these varieties over 0, 1, and 5 days of high-temperature exposure. These detailed observations are comprehensively presented in . The analysis reveals a variety-specific response to thermal stress. J exhibited more pronounced changes than its counterpart, characterized by significant stomatal closure and guard cell deformation, as evidenced by the diminishing stomatal opening rate.
F maintained a stable stomatal density, akin to the unstressed control group, while J showed an increase, particularly after one day of stress exposure (). Additionally, the stomatal opening rates in both declined as the stress duration increased, with F showing a slight recovery at the five days mark, unlike the steady decline observed in J (). These findings not only distinguish the stress responses between F and J, but also provide crucial insights into their stomatal adaptation strategies under prolonged heat stress.
Table 1. Effects of high-temperature stress on the stomatal properties of jujube leaves.
3.4. Transcriptomic analysis of two varieties under high-temperature stress
To unravel the transcriptomic responses of jujube varieties to high-temperature stress, an extensive RNA-Seq analysis was conducted over periods of 0, 1, 3, 5, and 7 days. This rigorous study included three biological replicates at each interval, culminating in the creation of 30 RNA-Seq cDNA libraries. Principal component analysis (PCA) validated the reproducibility among replicates and highlighted distinct transcriptional changes under varying degrees of heat stress, as illustrated in .
The Number of DEGs in different sample comparisons show in Table S2. The study primarily focused on identifying DEGs between the J and F varieties under equivalent stress conditions (). Findings revealed that in the initial comparison (F0d vs. J0d), there were 1,428 genes upregulated and 2,175 downregulated. As stress duration increased, the number of regulated genes fluctuated, with 754 upregulated and 1009 downregulated genes noted in F1d compared to J1d. The trend continued with significant gene expression variations observed in subsequent comparisons (F3d vs. J3d, F5d vs. J5d, and F7d vs. J7d). The Venn diagram analysis pinpointed 183 DEGs consistently upregulated and 282 consistently downregulated across all treatments, suggesting a core stress response mechanism. The differential expression patterns underscore the varietal distinction in temperature tolerance, particularly highlighting F resilience.
Furthermore, a unique set of 174 upregulated and 123 downregulated genes emerged after 7 days of stress, displaying no overlap with earlier stress responses. This specificity indicates complex gene regulation dynamics at play, contributing to the distinct adaptive strategies of F and J under prolonged heat exposure.
3.5. Comparative analysis of DEGs between two varieties
WGCNA analysis categorized 13,884 DEGs into 21 major modules (). A total of 224.58Gb Clean Data was obtained from transcriptome sequencing, and the Clean Data of each sample reached 5.74Gb (Table S3). Physiological metrics-based assays analyzed transcriptome data only for 1 d and 3 d of high temperature. The number of DEGs identified in the different groups was 1763 and 6072 by comparative analysis of F1 vs. J1 and F3 vs. J3, respectively. The volcano plot shows the clustering of up-and down-regulated DEGs, with 1009 down-regulated genes and 754 up-regulated genes in J1 compared to F1, and 3435 down-regulated genes and 2637 up-regulated genes in J3 compared to F3, respectively (). KEGG pathways were enriched for DEGs under high-temperature stress for these two days, and the 20 pathways with the highest degree of enrichment were extracted. The results showed significant enrichment in the pathways plant-pathogen interactions, amino acid biosynthesis, starch and sucrose metabolism and carbon metabolism (), It was shown that these DEGs were closely related to the changes in various indicators of photosynthesis under high-temperature stress. Among them, starch and sucrose metabolism and carbon metabolism are closely related to photosynthesis. F0 vs J0, F5 vs J5, F7 vs J7, KEGG enrichment analysis and gene expression distribution maps in Fig. S1-S6.
3.6. Identification of key genes in the photosynthetic pathway
The efficiency of photosynthesis is critical to plant adaptation. More efficient photosynthesis leads to better plant adaptation.Citation31 The results in shows that high-temperature conditions during the daytime lead to a shift of phyB to an inactive form, while on the one hand high temperature induces a large accumulation ofHSFA1s proteins in the light, On the other hand, high-temperature-induced COP1 entry into the nucleus to inhibit the binding of BIN2 to HSFA1s, thereby promoting the entry of HSFA1s into the nucleus. However, extremely high temperatures at 42°C inhibit the activity of COP1, which in turn stabilizes HY5 and directly induces the expression of ABI5 to inhibit growth and development, The heatmap showed that the expression of COP1 was significantly higher in F than in J with the high-temperature stress increased. In the nucleus, HSFA1s prevent PIF4 degradation by photoactivated phyB by forming a stabilizing protein complex with PIF4. This promotes the thermal morphogenesis process in the light, and the light-activated transcription factor PIF4 directly induces the expression of HSFA2, which makes the new leaves thermotolerant. In contrast, PIF4 also triggers the expression of senescence-related genes (NAC019, SAG113, and IAA29) in old leaves, thereby inducing leaf senescence. In addition, HSFA1s can also directly induce HSFA2 expression under high daytime temperatures, resulting in plants acquiring strong high-temperature stress tolerance. Meanwhile, light-activated phyB induces the expression of the reactive oxygen species scavenging enzyme gene APX2 by regulating the transcription factor HSFA1, which mediates the de-oxidation of ROS and thus enhances the heat tolerance of plants. In summary, HSFA1s, as the core regulatory elements, control the processes of thermal morphogenesis and response to heat stress.
3.7. qRT-PCR validation
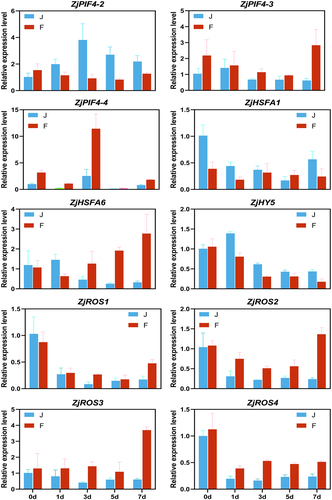
To confirm the validity of the RNA-seq data, 10 genes with significant differences in the photosynthetic pathway were selected for qRT-PCR validation. The results showed consistent expression patterns between qRT-PCR and RNA-seq data ().
Figure 7. Results of qRT-PCR validation. Each column represents the average of three biological replicates, with standard errors indicated by vertical bars.
4. Discussion
The photosynthesis indexes showed that the influence of high-temperature stress on the heat-sensitive variety J was more obvious than that on the heat-resistant variety F. During high-temperature stress, the intercellular CO2 concentration of F leaves was always lower than that of J, and the stomatal conductivity of F was higher than that of J. It was speculated that the leaves of F were still undergoing gas exchange because their stomata were not completely closed, timely replenishment of CO2 consumed by photosynthesis of F, so the CO2 utilization rate was higher. In addition, the water utilization rate was relatively high, meeting the requirements of photosynthesis and making the photosynthesis of F stronger than that of J, which is consistent with the research results of Pakdel et al..Citation32 When there was no high-temperature stress, the transpiration rate of two varieties was the same and the lowest. With the increase of high-temperature stress time, the change curve of the two varieties showed a bi-peak shape, and F was always higher than J, while leaf temperature was lower than that of J, suggesting that higher transpiration rates helped to reduce leaf temperature in F, thereby maintaining the physiological activity of its leaf cells and enabling it to maintain normal growth, The opposite is true for J, a speculation that is corroborated by the phenotype (). By studying the differences in photosynthetic parameters between J and F, the influence of photosynthesis on the two jujube varieties under the same cultivation and management conditions are clearer. Chlorophyll is an important pigment related to photosynthesis and exists in all photosynthetic organisms.Citation33 The results of this experiment showed that the chlorophyll content of F decreased sharply to the lowest level at 1 d of high-temperature stress and then increased with the increase in the number of high-temperature stress days, while the chlorophyll content of J always decreased with the increase in high-temperature stress days, indicating that the effect of high-temperature stress on the chlorophyll content of J was significantly higher than that of F. Chlorophyll absorbs energy from light and is then used to convert carbon dioxide into carbohydrates for plant growth, so it may be that the reduction in chlorophyll content reduces the photosynthetic rate of J, while F is almost unaffected.
Stomata are the main channels for water and CO2 exchange between plants and the outside world.Citation34 By regulating the amount of gas through the opening and closing of guard cells, pore size directly affects crop photosynthesis and transpiration,Citation35 which has an extremely important physiological role. The changes in stomata are closely related to changes in the external environment.Citation36 In this study, with the increase of heat stress time, the stomatal characteristics of both varieties were affected, and the effect on J was more significant, which was mainly manifested as shrinking and drying of guard cells and a significant decrease in stomatal opening rate. The results indicated that J leaves suffered great damage under high-temperature stress, and the normal physiological effects were greatly inhibited. This is consistent with the results of rice leaves.Citation37 When exposed to high-temperature stress, plants generally optimize gas exchange efficiency by changing the stomatal size, density, openness and opening rate of leaves.Citation38 However, some researchers believe that high temperatures will not cause changes in stomatal density and other characteristics of plant leaves.Citation39 In this study, with the extension of high-temperature stress time, compared with jujube trees growing in parallel without stress treatment, the stomatal density of F showed no significant change, while that of J increased significantly, especially after 1 d of high-temperature stress. This may be because the stomatal opening rate of the heat-resistant variety F did not change significantly under high-temperature stress and therefore did not affect the normal gas exchange, while the stomatal opening rate of J continued to decline with the increase in the number of days of high-temperature stress. So the transpiration rate F is always higher than J. Higher transpiration reduces the temperature of the tree, so the leaf temperature of F is always lower than J during high temperature stress (), and therefore F suffers less heat damage and is more tolerant to high temperatures.
To further explore the mechanism of heat tolerance stress in jujube trees at the molecular level, transcriptome sequencing analysis was carried out in this study, and the differences in gene expression between the heat-resistant variety F and the heat-sensitive variety J were revealed. A good correlation of the three biological replicates for each sample was verified by PCA analysis (), This supports the reproducibility of the transcriptome data and the significant difference in transcript levels between the two varieties in response to high-temperature stress. Based on the observation of phenotypic and physiological indexes of the two varieties under high-temperature stress, the comparative analysis of transcriptome data at 1 d and 3 d showed that the number of differential genes increased significantly at heat stress 3 d. Previous studies have found that there are significant differences in the expression of heat- resistant and heat-sensitive laver varieties under high-temperature stress.Citation40,Citation41 The results of KEGG enrichment analysis showed significant enrichment in the pathways of “plant-pathogen interactions”, “amino acid biosynthesis”, “starch and sucrose metabolism” and “carbon metabolism” under high-temperature stress. This is similar to the results of our identification of photosynthetic complex genes in two other jujube varieties with different heat resistance.Citation20 Therefore, it is hypothesized that although J initiated individual genes compatible with high temperature under sustained high-temperature stress, but it does not or rarely synthesizes new proteins during stress, thus lacking the ability to withstand high temperature stress.
The transcription factor HSFA, as a central regulatory element in the photosynthetic pathway in response to high-temperature stress, controls both thermal morphogenesis and heat stress response. High-temperature stress inhibits the photosynthetic process by reducing the activity of chloroplast protein complex enzymes.Citation12 The main reason is that high temperature inhibits photosynthesis and leads to the accumulation of ROS, which leads to the oxidation of proteins, lipids, carbohydrates, and DNA and ultimately to the death of plant cells,Citation15,Citation16 This is consistent with the results of this study. These results may help to explain why F is more tolerant to high-temperature stress than J and aid in the exploration of its heat resistance mechanism. In addition, PsaK and PsaG are also important core proteins in PSI and play an important role in the phototrapping complex of PSI.Citation42,Citation43 Under salt and alkali stress, six proteins related to photosynthesis, such as PsaK, were significantly upregulated in malonia, and these proteins could act as regulators of the PSI repair system.Citation44 A total of 10 DEGs and transcription factors in photosynthesis in response to high-temperature stress were identified in this study, including three PIF4 transcription factors, two HSFA transcription factors, four ROS genes, and one HY5 gene, and their expression was upregulated in F after high-temperature stress, However, downregulated expression of these genes was also observed in J (). It was suggested that high temperature stress induced the expression of these genes, which helped to stabilize the structure of PSII and PSI from being damaged by high temperature. Therefore, it is hypothesized that up-regulated photosynthesis-related genes play an important role in heat tolerance of jujube.
5. Conclusions
In summary, our study investigated the responses of two jujube varieties J and F to continuous high-temperature stress, revealing notable distinctions in phenotypic, photosynthetic, and molecular aspects. F exhibited enhanced heat tolerance, maintaining stable phenotypic characteristics, higher photosynthetic efficiency, and unique transcriptomic responses. Chlorophyll content dynamics and detailed leaf microstructure observations further emphasized the differential adaptive strategies of two varieties. Transcriptomic analysis identified key genes, with WGCNA highlighting modular gene expression patterns. Notably, F demonstrated higher expression of COP1 in the photosynthetic pathway, indicative of its potential contribution to improved heat tolerance. qRT-PCR validation confirmed the reliability of our findings. Overall, these insights deepen our understanding of the mechanisms governing heat tolerance in jujube, laying the foundation for future exploration of genetic and physiological factors influencing plant responses to environmental stress.
Supplementary_tables.docx
Download MS Word (21.3 KB)Disclosure statement
The funders had no role in the design of the study; in the collection, analyses, or interpretation of data; in the writing of the manuscript; or in the decision to publish the results.
Data availability statement
The raw sequence data reported in this paper have been deposited in the Genome Sequence Archive (Genomics, Proteomics & Bioinformatics 2021) in National Genomics Data Center (Nucleic Acids Res 2022), China National Center for Bioinformation/Beijing Institute of Genomics, Chinese Academy of Sciences (BioProject ID: PRJCA016517) that are publicly accessible at https://ngdc.cncb.ac.cn/.
Supplementary material
Supplemental data for this article can be accessed online at https://doi.org/10.1080/15592324.2024.2357367
Additional information
Funding
References
- Rashmi E, Kalpna E, Harsh E, Kalpna E. Temperature stress and redox homeostasis in agricultural crops. Front Environ Sci. 2015;3:3. doi:10.3389/fenvs.2015.00011.
- Ron M, Andrija F, Pierre G. How do plants feel the heat? Trends Biochem Sci. 2012;37(3):118–12. doi:10.1016/j.tibs.2011.11.007.
- Guihur A, Rebeaud ME, Goloubinoff P. How do plants feel the heat and survive? Trends Biochem Sci. 2022;47(10):824–838. doi:10.1016/j.tibs.2022.05.004.
- Qu YC, Mueller CO, Yamori W, Carmo-Silva E. Improving plant heat tolerance through modification of rubisco activase in C3 plants to secure crop yield and food safety in a future warming world. J Exp Bot. 2022;74(2):591–599. doi:10.1093/jxb/erac340.
- Almeselmani M, Deshmukh PS, Sairam RK, Kushwaha SR, Singh TP. Protective role of antioxidant enzymes under high temperature stress. Plant Sci. 2006;171(3):382–388. doi:10.1016/j.plantsci.2006.04.009.
- Hasanuzzaman M, Nahar K, Alam MM, Mirza H, Kamrun N. Physiological, biochemical, and molecular mechanisms of heat stress tolerance in plants. Int J Mol Sci. 2013;14(5):9643–9684. doi:10.3390/ijms14059643.
- Aroua A, Ben AL, Mohamed G, Mars M. (Ficus carica L.) vulnerability to climate change: Combined effects of water stress and high temperature on ecophysiological behaviour of different cultivars. S Afr J Bot. 2022;147:482–492. doi:10.1016/j.sajb.2022.02.014.
- Huang R, Meng W, Zhu K, Liu D, Zhao Z, Lu C, Sun Z, Tang K, Zhou J, Cheng Y. Responses of physiology photosynthetic characteristics and leaf surface micromorphology of berberis poiretii schneid to drought stress. Acta Agrestia Sinica. 2023;31:1386–1392.
- Zhang C, Liu H, Xi D, Chi D, Luo H, Pei J, Huang K, Ruan R, Lai M, Fan H. Effects of high temperature on leaf physiological indexes of sweet cherry summit seedlings. Guoshu Xuebao. 2023;40:712–723.
- Wang WX, Vinocur B, Shoseyov O, Arie A. Role of plant heat-shock proteins and molecular chaperones in the abiotic stress response. Trends Plant Sci. 2004;9(5):244–252. doi:10.1016/j.tplants.2004.03.006.
- Naohiko O, Hikaru S, Kazuo S, Kazuko YS. Transcriptional regulatory network of plant heat stress response. Trends Plant Sci. 2017;22(1):53–65. doi:10.1016/j.tplants.2016.08.015.
- Hu SS, Ding YF, Zhu C. Sensitivity and responses of chloroplasts to heat stress in plants. Front Plant Sci. 2020;11:375. doi:10.3389/fpls.2020.00375.
- Maestri E, Klueva N, Perrotta C, Gulli M, Nguyen HT, Marmiroli N. Molecular genetics of heat tolerance and heat shock proteins in cereals. Plant Mol Biol. 2002;48(5/6):667–681. doi:10.1023/A:1014826730024.
- Todorov DT, Karanov EN, Smith AR, Hall MA. Chlorophyllase activity and chlorophyll content in wild and mutant plants of Arabidopsis thaliana. Biol Plant. 2003;46(1):125–127. doi:10.1023/A:1022355525907.
- Sachin K, Jane L, Ung L, Pascal VKD, Elizabeth V, Klaus DS. Complexity of the heat stress response in plants. Curr Opin Plant Biol. 2007;10(3):310–316. doi:10.1016/j.pbi.2007.04.011.
- Wahid A, Gelani S, Ashraf M, Foolad MR. Heat tolerance in plants: An overview. Environ Exp Bot. 2007;61(3):199–223. doi:10.1016/j.envexpbot.2007.05.011.
- Liu MJ, Wang J, Liu P. Historical achievements and frontier advances in the production and research of Chinese jujube (Ziziphus jujuba) in China. Yuan Yi Xue Bao. 2015;9(11):1683–1698. doi:10.1007/s10114-015-4669-7.
- Bai TC, Zhang NN, Chen YQ, Mercatoris B. Assessing the performance of the WOFOST model in simulating jujube fruit tree growth under different irrigation regimes. Sustainability. 2019;11(5):1466. doi:10.3390/su11051466.
- Liu MJ, Wan J, Wang L, Liu P, Zhao J, Zhao Z, Yao S, Stănică F, Liu Z, Wang L. The historical and current research progress on jujube–a superfruit for the future. Horticul Res. 2020;1(1):1259–1275. doi:10.1038/s41438-020-00346-5.
- Jin J, Yang L, Fan DY, Liu X, Hao Q, Shelden EA. Comparative transcriptome analysis uncovers different heat stress responses in heat-resistant and heat-sensitive jujube cultivars. PLoS One. 2020;15(9):e0235763–e0235763. doi:10.1371/journal.pone.0235763.
- Li LL, Yang L, Fan DY, Jin J, Xiaokelaiti S, He YJ, Hao Q. Genome-wide analysis of ALDH gene family in jujube and identification of ZjALDH3F3 for its important role in high-temperature tolerance. Plant Physiol Biochem: PPB. 2023;205:108196–108196. doi:10.1016/j.plaphy.2023.108196.
- Ma YP, Han YR, Feng XR, Gao HD, Cao B, Song LH. Genome-wide identification of BAM (β-amylase) gene family in jujube (Ziziphus jujuba Mill.) and expression in response to abiotic stress. BMC Genomics. 2022;23(1):438–438. doi:10.1186/s12864-022-08630-5.
- Jiang WQ, Li N, Zhang DP, Meinhardt L, Cao B, Li YJ, Song LH, Huang Y. Elevated temperature and drought stress significantly affect fruit quality and activity of anthocyanin-related enzymes in jujube (Ziziphus jujuba Mill. cv. ‘Lingwuchangzao’). PLoS One. 2020;15(11):e0241491–e0241491. doi:10.1371/journal.pone.0241491.
- Yang XJ, Jin J, Zhang DY, Fan H, Geng Q, Hao WJ, Yang L, Geng WJ. Effects of extreme high temperature environment on photosynthetic characteristics of ‘Junzao’ and ‘Fucuimi’. ISHS Pro V Int Jujube Symp. 2022;1350(1350):223–230. doi:10.17660/ActaHortic.2022.1350.26.
- Trapnell C, Williams BA, Pertea G, Mortazavi A, Kwan G, Baren MJ, Salzberg SL, Barbara WJ, Pachter L. Transcript assembly and quantification by RNA-Seq reveals unannotated transcripts and isoform switching during cell differentiation. Nat Biotechnol. 2010;28(5):511–515. doi:10.1038/nbt.1621.
- Wang LK, Feng ZX, Wang X, Wang XW, Zhang XG. DEGseq: an R package for identifying differentially expressed genes from RNA-seq data. Bioinform (Oxford, England). 2010;26(1):136–138. doi:10.1093/bioinformatics/btp612.
- Bu JD, Zhao J, Liu MJ, Pang X. Expression stabilities of candidate reference genes for RT-qPCR in Chinese Jujube (Ziziphus jujuba Mill.) under a variety of conditions. PLoS One. 2017;11(4):e0154212. doi:10.1371/journal.pone.0154212.
- Zhang CM, Huang J, Li XG. Identification of appropriate reference genes for RT-qPCR analysis in Ziziphus jujuba Mill. Sci Hortic (Amsterdam). 2015;197:166–169. doi:10.1016/j.scienta.2015.09.026.
- Kumar V, Sharma V, Trivedi PC, Vyas GK, Khandelwal V. Traditional and novel references towards systematic normalization of qRT-PCR data in plants. Aust J Crop Sci. 2011;5:1455–1468.
- Yang HB, An SQ, Sun OJX, Shi ZM, She XS, Sun QY, Liu SR. Seasonal variation and correlation with environmental factors of photosynthesis and water use efficiency of Juglans regia and Ziziphus jujuba. J Integr Plant Biol. 2008;2(2):210–220. doi:10.1111/j.1744-7909.2007.00391.x.
- Shekhawat K, Almeidatrapp M, Garcíaramírez GX, Hirt H. Beat the heat: plant- and microbe-mediated strategies for crop thermotolerance. Trends Plant Sci. 2022;27(8):802–813. doi:10.1016/j.tplants.2022.02.008.
- Pakdel H, Hassani SB, Ghotbi RAA, Bernard F. Contrasting the expression pattern change of polyamine oxidase genes and photosynthetic efficiency of maize (Zea mays L.) genotypes under drought stress. J Biosci. 2020;45(1):2198–2230. doi:10.1007/s12038-020-00044-3.
- Baniasadi F, Saffari VR. Effects of GA3, BA, thiamine and ascorbic acid on some morphological and biochemical characteristics of periwinkle (Catharanthus roseus L.). Majallah-i ̒Ulum-i Bāghbānī. 2016;29:556–563.
- Hetherington AM, Woodward FL. The role of stomata in sensing and driving environmental change. Nature. 2003;424(6951):901–908. doi:10.1038/nature01843.
- Casson S, Gray JE. Influence of environmental factors on stomatal development. New Phytol. 2008;178(1):9–23. doi:10.1111/j.1469-8137.2007.02351.x.
- Pitaloka MK, Caine RS, Hepworth C, Harrison EL, Sloan J, Chutteang C, Phunthong C, Nongngok R, Toojinda T, Ruengphayak S. et al. Induced genetic variations in stomatal density and size of rice strongly affects water use efficiency and responses to drought stresses. Front Plant Sci. 2022;13:801706. doi:10.3389/fpls.2022.801706.
- Zhou W, Qiang X, Wang S, Jiang J, Wei W. Mechanism of drought and salt tolerance of OsLPL2/PIR gene in rice. Acta Agronom Sin. 2022;48(6):1401–1415. doi:10.3724/SP.J.1006.2022.12032.
- Hu J, Yang QY, Huang W, Zhang SB, Hu H. Effects of temperature on leaf hydraulic architecture of tobacco plants. Planta. 2014;240(3):489–496. doi:10.1007/s00425-014-2097-z.
- Kouwenberg LR, Kürschner WM, Mcelwain JC. Stomatal frequency change over altitudinal gradients: prospects for paleoaltimetry. Rev Mineral Geochem. 2007;66(1):215–241. doi:10.2138/rmg.2007.66.9.
- Wang W, Lin Y, Teng F, Ji D, Xu Y, Chen C, Xie C. Comparative transcriptome analysis between heat tolerant and sensitive Pyropia haitanensis strains in response to high temperature stress. Algal Res. 2018;29:104–112. doi:10.1016/j.algal.2017.11.026.
- Venkateswarlu Y, Chandramouli M, Rajagopal S. Protein–protein interactions by molecular modeling and biochemical characterization of PSI-LHCI supercomplexes from Chlamydomonas reinhardtii. Mol Biosyst. 2011;7(11):3143–3151. doi:10.1039/c1mb05218g.
- Jensen PE, Gilpin M, Knoetzel J, Scheller HV. The PSI-K subunit of photosystem I is involved in the interaction between light-harvesting complex I and the photosystem I reaction center core. J Biol Chem. 2000;275(32):24701–24708. doi:10.1074/jbc.M000550200.
- Jia XM, Zhu YF, Hu Y, Zhang R, Cheng L, Zhu ZL, Zhao T, Zhang XY, Wang YX. Integrated physiologic, proteomic, and metabolomic analyses of Malus halliana adaptation to saline–alkali stress. Horticul Res. 2019;6(1):1–19. doi:10.1038/s41438-019-0172-0.
- Tan WR, Chen JH, Yue XL, Chai SL, Liu W, Li CL, Yang F, Gao YF, Gutiérrez R, Resco DV. et al. The heat response regulators HSFA1s promote Arabidopsis thermomorphogenesis via stabilizing PIF4 during the day. Sci Adv. 2023;9(44):eadh1738. doi:10.1126/sciadv.adh1738.