
 ?Mathematical formulae have been encoded as MathML and are displayed in this HTML version using MathJax in order to improve their display. Uncheck the box to turn MathJax off. This feature requires Javascript. Click on a formula to zoom.
Abstract
An all fiber Mach–Zehnder interferometric (MZI) sensor for measuring temperature and refractive index (RI) is proposed and experimentally demonstrated. The proposed sensor is fabricated with a coreless–few mode–coreless fiber structure. Variations in ambient temperature and RI cause changes in phase differences between the fundamental mode and the higher-order modes, leading to shifts in interference spectrum. The two resonance dips shifts within the wavelength spectrum are used to investigate the temperature and RI characteristics of the sensor. Experimental results show that the two dips have different responses to temperature and RI, indicating that the sensor can realize simultaneous measurement of temperature and RI; the maximum sensing sensitivities are 0.0739 nm/°C and −25.29 nm/RIU, respectively. The proposed sensor has potential applications in physical, biological, and chemical sensing owing to its low cost, good linearity, and simple fabrication.
1. Introduction
Optical fiber sensors have attracted extensive attention because of their high sensitivity, anti-electromagnetic interference, electrical insulation, corrosion resistance, and fast response. Numerous optical fiber sensors based on various structures have been proven to be capable of measuring several parameters in recent years. Among these parameters, temperature and RI are the most important in many applications. A variety of optical fiber temperature or RI sensors, such as optical fiber interferometer sensor,[Citation1–4] surface plasmon resonance optical fiber sensor,[Citation5] and optical fiber grating sensor[Citation6–11] have been developed. Among these temperature and RI sensors, optical fiber sensors based on different coupling structures, such as single–mode fiber (SMF)–multimode fiber (MMF)–SMF structure,[Citation12,Citation13] SMF–tapered Bragg grating–SMF,[Citation14] special optical fiber cascaded,[Citation15] fiber transverse offset splicing,[Citation16] and combined structures,[Citation17–19] have attracted increasing attention in frontier fields, such as biology and chemistry. The simultaneous measurement of multiple parameters using optical fiber sensors is widely used in complex environmental monitoring. To eliminate the cross effects of temperature and RI, researchers have proposed and extensively studied simultaneous measurements of two parameters. Zheng et al. developed a sensor composed of a few-mode fiber (FMF) and two spherical structures. The spherical structure acts as a coupler that can excite high-order modes and couple back high-order modes into the fiber.
Nomenclature
The sensor can measure temperature and RI at the same time. Within the ranges of 25 °C–80 °C and 1.335–1.398, the sensitivities of temperature and RI are 0.054 nm/°C and 27.77 nm/RIU, respectively.[Citation18] Although the sensor can measure temperature and RI simultaneously, the manufacturing repeatability of spherical coupling structure is poor, which is not conducive to the future practical engineering application. Dong et al. devised a D-type fiber structure combined with fiber Bragg grating (FBG) for measuring temperature and RI. The sensitivities of temperature and RI are 0.028 nm/°C and 31.79 nm/RIU, respectively.[Citation19] The sensor structure reported in this paper is fabricated in series with MZI and FBG, which will increase the size of the sensor and is not suitable for miniaturization measurement. Shi et al. proposed a Sagnac ring based on long-period grating (LPG) and polarization-maintaining fiber to simultaneous measurement of temperature and RI. The temperature and RI sensitivity of the LPG is 0.201 nm/°C and 8.36 nm/RIU, respectively, as well as the temperature and RI sensitivity of the Sagnac ring is 1.06 nm/°C and 23.068 nm/RIU, respectively.[Citation20] Although the sensor has high temperature sensitivity, the extinction ratio of interference dip formed by LPG is relatively low. When the interference noise is large, the measurement accuracy will be affected. The linearity of the fitting curve in this paper is poor. In addition, tapered stretching and bending techniques have been used in many sensor structures in recent years to achieve high-sensitivity measurement.[Citation21,Citation22] However, tapered optical fiber sensors are considerably fragile. Thus, the use of these sensors in practical applications is difficult.
In this paper, an optical fiber sensor with simple structure and easy fabrication is proposed; its temperature and RI characteristics are analyzed theoretically and verified experimentally. Both ends of FMF are spliced with two segments of coreless fiber (CLF), the CLF is used to excite and couple back higher-order modes. When the fundamental mode and the higher-order modes are couple back to the SMF, an interference spectrum is generated. Due to the different effects of temperature and ambient RI on the fundamental mode and the higher-order modes, the interference spectrum will shift when the ambient environmental parameters change. The experimental results show that the temperature sensitivity is 0.0739 nm/°C in the range of 30 °C–80 °C, and the RI sensitivity is −25.29 nm/RIU in the range of 1.3424–1.3813. Although the sensitivity of the sensor is not higher than that of the previous paper, the advantages of the sensor are simple structure, strong robustness and low price.
2. Fabrication and working principle
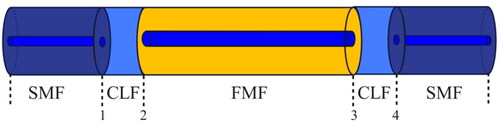
The schematic of the sensor is shown in . A section of the FMF (YOFC Optical Fiber Company), which has a length of 30 mm, is spliced between two pieces of CLF (YOFC Optical Fiber Company), which has a diameter of 125 µm and a length of 2.9 mm. Both ends of the CLF are fused with the SMF, with a core and cladding diameter of 8.2 and 125 µm, respectively (Corning Optical Fiber Company), as the input and output fibers. When light is launched into the CLF through the lead-in SMF at the spliced CLF-FMF point, due to the mismatch between SMF and CLF mode field, higher-order modes are excited. Then some higher-order modes are transmitted in the FMF cladding, the fundamental mode is transmitted in the FMF core. Similarly, at the spliced CLF–SMF point, the higher-order modes are coupled back to the SMF. These modes with different effective RI and transmission path interfere at the output of the sensor. As the effective RI of higher-order modes depends on the ambient RI, the change of ambient RI will affect the phase difference between these modes, which leads to the spectral shift of the transmission spectrum. The fibers are all fusion-spliced with the AUTO MODE in the splicer menu. Although the splicing method is easy to perform, it still needs careful cleaving and fusion splicing procedures. Splicing loss could reduce coupling ratio, which influences the fringe visibility and transmission loss of the interference spectrum.
Figure 1. Diagram of sensor structure.
To verify the role of CLF in high-order mode excitation, SMF-FMF-SMF and SMF-CLF-FMF-CLF-SMF structures are numerically analyzed using Rsoft BeamPROP BPM tool. The diameter of the SMF core and the cladding is set to 8.2 and 125 µm, respectively, and the RI of the fiber core and the cladding is set to 1.4681 and 1.4628, respectively. The simulated length is 3 mm. The CLF has a diameter of 125 µm, with an RI of 1.444 and a length of 3 mm. The structure and RI distribution of the FMF are shown in . The simulated length is 30 mm. The simulation results are shown in .
Figure 2. Cross section and refractive index distribution of FMF.
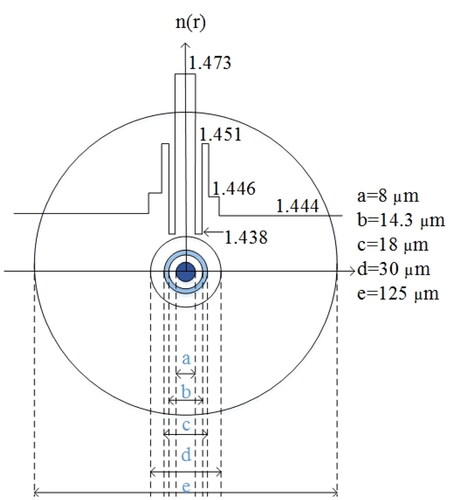
Figure 3. Simulate the distribution of light field intensity and display it on the X-Z plane, and the normalized power of LP01 in the core: (a) SMF-FMF-SMF, (b) SMF-CLF-FMF-CLF-SMF. (X (µm): Fiber diameter; Monitor Value (a. u.): Normalized power; Z (µm): Optical transmission direction).
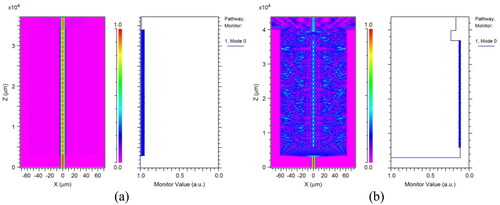
The simulation results are shown in . does not contain CLF, and contains CLF. It can be seen from that when CLF is not added, the main mode of transmission in the few mode fiber is still fundamental mode, which is LP01, and its normalized power has only a small change, and no high-order mode is excited in the cladding. After the CLF is included in the structure, the simulation result in is shown that a large number of high-order modes are excited in the CLF due to the mode field mismatch between SMF and CLF. When the light is transmitted to the FMF, the power of the fundamental mode in the FMF core is decreases, and the power of the high-order modes in the FMF cladding increases.
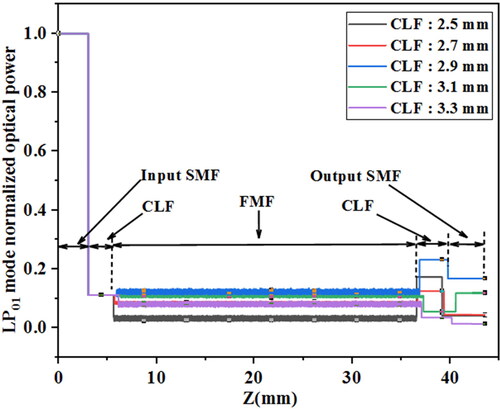
The mode field diameter of the CLF is considerably larger than that of SMF. Therefore, mode mismatch occurs at the fusion points 1 and 4 of the SMF and the CLF, which excites and couples higher-order modes. CLF plays the role of coupling. If the length is too long, the sensing structure will be too large, which is not conducive to miniaturization measurement. If the length is too short, it will increase the difficulty of making the sensor. Sensors with CLF lengths of 2.5 mm, 2.7 mm, 2.9 mm, 3.1 mm and 3.3 mm were numerically simulated and to select the most appropriate CLF length. The normalized optical power of LP01 mode transmitted in the optical fiber core is shown in . As can be seen from , When the CLF length is 2.9 mm, the normalized optical power of LP01 mode in FMF is about 10%, and the normalized optical power of LP01 mode in output SMF is about 15%. About 5% of higher-order modes are coupled back to output SMF. Compared with sensing structures containing other lengths of CLF, the optical power values of the fundamental mode and higher-order mode are close, and the visibility of interference fringes is good. Thus, CLF length of 2.9 mm is selected.
Figure 4. The normalized optical power of LP01 mode in optical fiber sensing structures with different length of CLF.
When the light is transmitted into the FMF, the fundamental mode is transmitted in the FMF core, and high-order modes excited by the CLF are transmitted in the FMF cladding. Under the action of the second CLF, the high-order modes are coupled back to the SMF to form an interference spectrum. The simulated light field intensity distribution can be seen from . When the light is coupled back to the SMF, the fundamental mode and high-order modes interfere to form an interference spectrum. The effective RI of the fundamental mode in the core is not affected by the ambient RI, the effective RIs of the high-order modes are affected by the ambient RI, so the phase differences between the fundamental mode and high-order modes are affected by the change of ambient RI, leading to the spectral shift of the transmission spectrum.
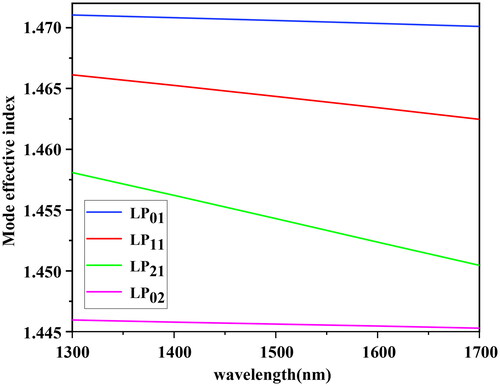
In order to analyze the mode transmitted in FMF, the mode effective indexes of the guided modes supported in the FMF are calculated using the Rsoft BeamPROP BPM tool. The results are shown in .
Figure 5. The mode effective index of the guided modes supported in the FMF.
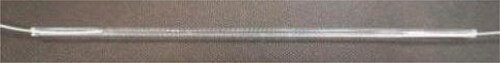
During the experiment, the sensor is simply packaged to prevent the bending and vibration of the optical fiber from affecting the measurement performance. Place the fabricated sensor in the slotted quartz tube, and fix both ends of the sensor with UV glue. The encapsulated sensor is shown in .
Figure 6. Encapsulated sensor.
Assuming only two mode components interfere with each other, after the transmitted light passes through the sensor, the transmission intensity can be expressed as:[Citation23]
(1)
(1)
where
and
are the strength of the fundamental mode and the high-order mode, respectively; and
is the phase difference between the fundamental mode and the high-order mode, and it can be expressed as
(2)
(2)
where λ0 is the central wavelength;
and
are the effective RI of the fundamental mode and the high-order mode, respectively;
is the effective RI difference between the fundamental mode and the high-order mode; and
is the length of the sensing unit. When
is (2
+1) π, the interference is minimal, and the dip wavelength of the
-th order is
(3)
(3)
When the ambient temperature and RI change, and
would change with the ambient parameters. Two dips are selected from the interference spectrum as the characteristic wavelengths (dip 1 and dip 2). The relationships between the wavelength change and the ambient parameters are as follows:
(4)
(4)
where
and
are the temperature and RI sensitivity coefficients of dip1,
and
are the temperature and RI sensitivity coefficients of dip2,
and
are the wavelength changes of dip1 and dip2, and
and
are the changes of temperature and RI. By solving EquationEquation (4)
(4)
(4) , we can obtain:
(5)
(5)
where D =
and
3. Experimental results and analysis
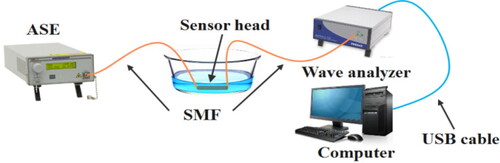
Schematic diagram of experimental system is shown in . The two ends of the sensor are connected to an amplified spontaneous emission source (ASE) with a wavelength range of 1510–1590 nm and a wave analyzer (1500S wave analyzer, Finisar Company) with a spectral resolution of 0.01 nm. The interference spectrum of the sensor is collected by the wave analyzer, and displayed, stored and analyzed by a computer.
Figure 7. Schematic diagram of experimental system.
3.1. Temperature experiment and analysis
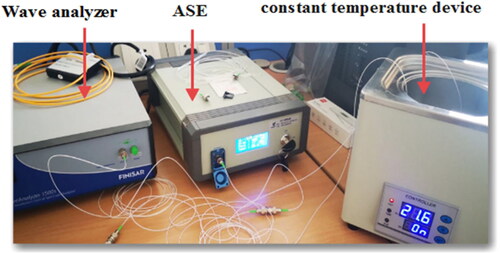
The temperature sensitivity of the sensor is investigated by putting it into a constant temperature device whose temperature can be adjusted. The accuracy of the device is 0.1 °C. The photo of experimental system is shown in .
Figure 8. Photo of experimental system.
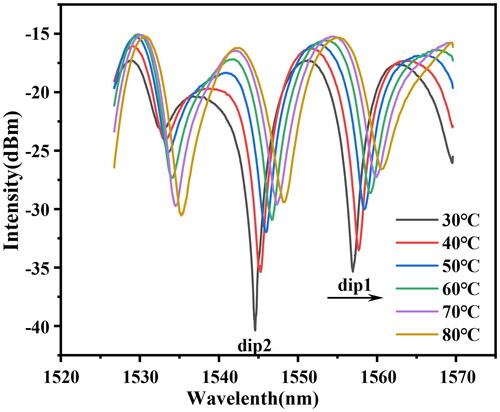
The temperature is raised from 30 °C to 80 °C, and the data are recorded every 10 °C. In order to ensure the accuracy of measurement, the data are recorded after the temperature reaches the set value for 5 min. Transmission spectra at different temperatures are shown in . With the increase of temperature, the spectral shape and interference modes of transmission spectra remain unchanged. The whole spectrum moves towards the long wavelength direction.
Figure 9. Transmission spectra at different temperatures.
In order to analyze the origin and intensity distribution of interference modes, the transmission spectra in are Fourier transformed to get the spatial frequency spectra, and the result is shown in . The dominant intensity peak at zero relates to the fundamental mode. The spatial frequency spectrum has a peak at 0.0691 nm−1, which is the main higher-order mode interfering with the fundamental mode. also contains some other higher-order modes, which interferes with the fundamental mode. The wavelength separation between two interference minima, known as free spectral range (FSR), can be approximated as:[Citation24]
(6)
(6)
Figure 10. Spatial spectral analysis.
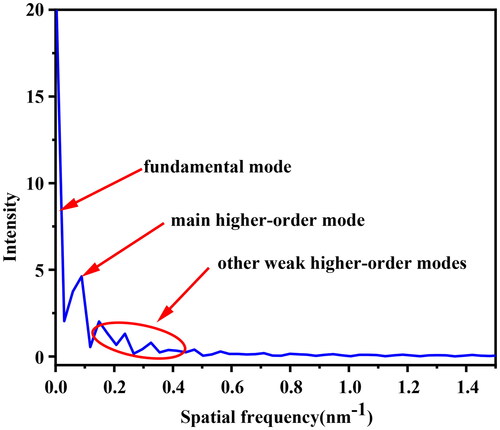
It can be seen from that the difference between the effective refractive index of LP01 mode and LP11 mode in FMF is about 0.006589. By EquationEquation (6)(6)
(6) , it can be obtained that FSR is equal to 12.5 nm, which is close to the fringe spacing between dip 1 and dip2 in the interference spectrum. The small difference between the FSR experiment and simulation results is due to the influence of other higher-order modes in the FMF. The main interference modes in the sensing structure are LP01 and LP11 modes
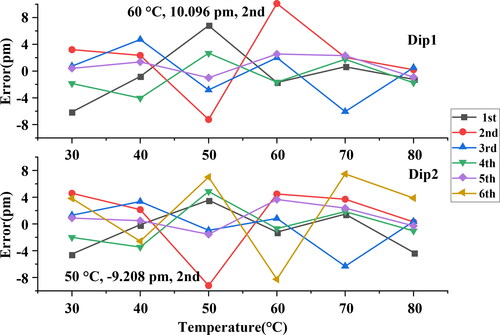
The temperature experimental process was repeated 6 times. After averaging the results of 6 measurements, the average was subtracted from each measurement to calculate the repeatability error. The results are shown in . It marks each dip fluctuation with a maximum repeatability error of 10.096 pm.
Figure 11. Repeatability error of dips in the process of temperature change.
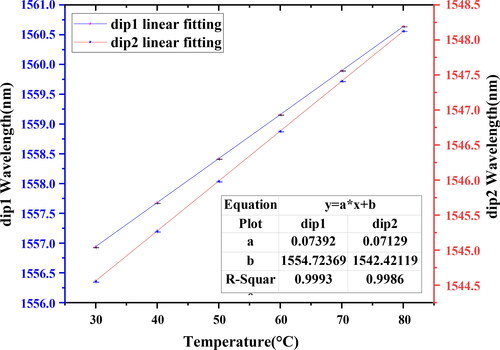
It can be seen from that the interference spectrum of the sensor contains multiple dips, and the measurement sensitivity and linearity are comprehensively considered. Choosing dip1 and dip2 as characteristic wavelengths, the sensitivity and linearity are analyzed. The relationships between temperature and wavelength are shown in . The dip1 and dip2 wavelengths have good linear relationships with temperature. The fitted temperature sensitivities of dip 1 and dip 2 are = 0.0739 nm/°C and
= 0.0713 nm/°C, respectively.
Figure 12. Relationships between temperature and wavelength.
3.2. RI experiment and analysis
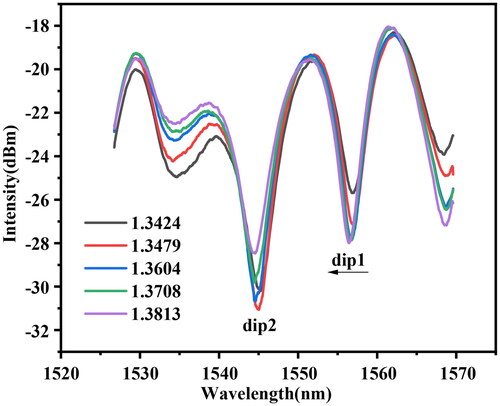
The performance of the sensor in measuring RI is evaluated by immersing it in five concentrations of NaCl solutions with the RI ranging from 1.3424 to 1.3813. In accordance with the empirical formula of NaCl solution,[Citation25] NaCl solutions with concentrations of 5%, 9.1%, 16.7%, 20%, and 25% are prepared at a room temperature of 25 °C, and their corresponding RI is 1.3424, 1.3479, 1.3604, 1.3708, and 1.3813, respectively. The sensing unit is cleaned before each NaCl solution is replaced to restore the sensing spectrum to its original state. The transmission spectra of the sensor in different concentrations of NaCl solution are measured and shown in . With the increase of the ambient RI, the spectral shape and interference modes of transmission spectra remain unchanged. The whole spectrum moves towards the short wavelength direction.
Figure 13. Transmission spectra at different RIs.
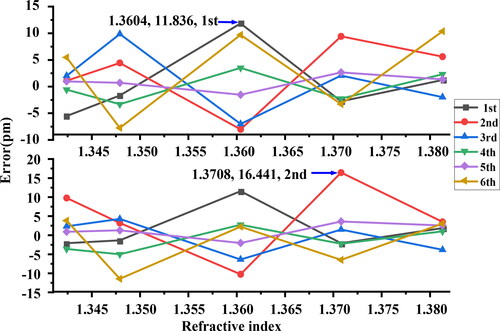
Similarly, the RI experimental process was repeated 6 times. After averaging the results of 6 measurements, the average was subtracted from each measurement to calculate the repeatability error. The results are shown in . It marks each dip fluctuation with a maximum repeatability error of 16.441 pm. The repeatability error of some measured values is slightly larger, which is caused by a certain change in room temperature during the experiment.
Figure 14. Repeatability error of dips in the process of RI change.
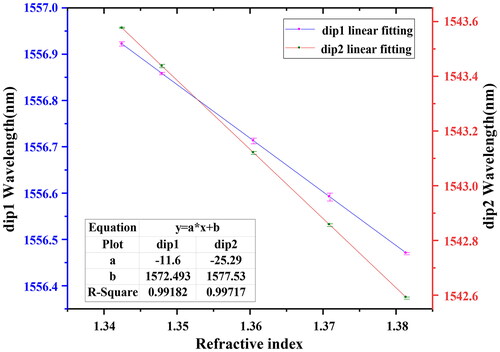
The relationships between RI and wavelength are shown in . The dip1 and dip2 wavelengths have good linear relationships with ambient RI within the range of 1.3424–1.3813. The RI sensitivities of dip1 and dip2 are = −11.60 nm/RIU and
= −25.29 nm/RIU, respectively.
Figure 15. Relationships between RI and wavelength.
In accordance with EquationEquation (5)(5)
(5) , the sensitivity matrix is
(7)
(7)
In the actual measurement process, according to the wavelength changes of two dips, the temperature and RI changes can be obtained by EquationEquation (7)(7)
(7) . The RI sensitivity of the sensor can be improved by properly thinning the cladding thickness of the FMF, such as taper or etching the cladding, but it will also lead to the fragile structure of the sensor. In practical engineering applications, it is necessary to select appropriate methods to improve the sensitivity of the sensor according to the actual use condition, and design the protective structure for the sensor.
4. Conclusions
In this paper, a MZI sensor is proposed to measure the temperature and RI simultaneous. The sensor is composed of SMF–CLF–FMF–CLF–SMF structure. The role of CLF in exciting higher-order modes and the coupling effect at different lengths are simulated and analyzed. The temperature and RI sensing characteristics of the sensor are theoretically analyzed and experimentally demonstrated. The experimental results show that the sensitivities of temperature and RI are 0.074 nm/°C and −25.29 nm/RIU, respectively. The sensor has good linearity, inexpensive, and can be easily fabricated. Thus, it is suitable for physical, biological, and chemical sensing applications.
Disclosure statement
No potential conflict of interest was reported by the author(s).
Additional information
Funding
References
- Guzmán-Sepúlveda, J.R.; Guzmán-Cabrera, R.; Castillo-Guzmán, A.A. Optical sensing using fiber-optic multimode interference devices: A review of nonconventional sensing schemes. Sensors 2021, 21, 1862. DOI: 10.3390/s21051862.
- Liu, T.; Wang, J.; Liao, Y.; Yang, L.; Wang, S. Splicing point tapered fiber Mach-Zehnder interferometer for simultaneous measurement of temperature and salinity in seawater. Opt. Express. 2019, 27, 23905–23918. DOI: 10.1364/OE.27.023905.
- Lin, Z.; Lv, R.; Zhao, Y.; Zheng, H. High-sensitivity salinity measurement sensor based on no-core fiber. Sens. Actuators A Phys. 2020, 305, 111947. DOI: 10.1016/j.sna.2020.111947.
- Wan, H.; Zhang, J.; Chen, Q.; Wang, Z.; Zhang, Z. An active fiber sensor based on modal interference in few-mode fibers for dual-parameter detection. Opt. Commun. 2021, 481, 126498. DOI: 10.1016/j.optcom.
- Liu, C.; Yang, L.; Lu, X.; Liu, Q.; Wang, F.; Lv, J.; Sun, T.; Mu, H.; Chu, P.K. Mid-infrared surface plasmon resonance sensor based on photonic crystal fibers. Opt. Express. 2017, 25, 14227–14237. DOI: 10.1364/OE.25.0142272020.126498.
- Zhang, W.; Gao, W.; Tong, Z.; Zhong, Y.; Xue, L.; Zhang, H. Mach–Zehnder interferometer cascaded with FBG for simultaneous measurement of RI and temperature. Opt. Commun. 2020, 466, 125624. DOI: 10.1016/j.optcom.2020.125624.
- Zhang, M.; Hu, Z.; Wang, X.; Xue, L.; Zou, J.; Du, Y.; Wang, L. Power-type liquid-level sensor for high refractive index liquid based on long-period fiber grating. Sens. Actuators A Phys. 2021, 324, 112652. DOI: 10.1016/j.sna.2021.112652.
- Fiorin, R.; de Oliveira, V.; Kalinowski, H.J.; Kamikawachi, R.C.; Abe, I. FBG-assisted micro-channel for refractive index measurements. IEEE Photon. Technol. Lett. 2021, 33, 35–38. DOI: 10.1109/LPT.2020.3043088.
- Ren, F.; Zhang, W.; Li, Y.; Lan, Y.; Xie, Y.; Dai, W. The temperature compensation of FBG sensor for monitoring the stress on hole-edge. IEEE Photon. J. 2018, 10, 7104309. DOI: 10.1109/JPHOT.2018.2858847.
- Riza, M.A.; Go, Y.I.; Harun, S.W.; Maier, R.R.J. FBG sensors for environmental and biochemical applications—A review. IEEE Sensors J. 2020, 20, 7614–7627. DOI: 10.1109/JSE.2020.2982446.
- Stawska, H.; Popenda, M. Refractive index sensors based on long-period grating in a negative curvature hollow-core fiber. Sensors 2021, 21, 1803. DOI: 10.3390/s21051803.
- Del Villar, I.; Socorro, A.B.; Corres, J.M.; Arregui, F.J.; Matias, I.R. Optimization of sensors based on multimode interference in single-mode–multimode–single-mode structure. J. Lightw. Technol. 2013, 31, 3460–3468.” DOI: 10.1117/1.2338565.
- Chen, Y.; Han, Q.; Liu, T.; Lü X. Self-temperature-compensative refractometer based on singlemode – multimode – singlemode fiber structure. Sens. Actuators B. Chem. 2015, 212, 107–111. DOI: 10.1016/j.snb.2015.01.08.
- Martins, T.J.M.; Marques, M.B.; Roy, P.; Jamier, R.; Fevrier,S.; Fevrier, O. Temperature-independent multi-parameter measurement based on a tapered Bragg fiber. IEEE Photon. Technol. Lett. 2016, 28, 1565–1568. DOI: 10.1109/LPT.2016.2555300.
- Wang, F.; Wang, R.; Wang, X.; Liu, Y. Three-core fiber cascade asymmetric dual-taper robust structure for the simultaneous measurement of a mass concentration of a glucose solution and temperature. Opt. Commun. 2020, 461, 125227. DOI: 10.1016/j.optcom.2019.125227.
- Gao, S.; Ji, C.; Ning, Q.; Chen, W.; Li, J. High-sensitive Mach-Zehnder interferometric temperature fiber-optic sensor based on core-offset splicing technique. Opt. Fiber Technol. 2020, 56, 102202. DOI: 10.1016/j.yofte.2020.102202.
- Yang, B.; Niu, Y.; Yang, B.; Hu, Y.; Dai, W.; Yin, Y.; Ding, M. High sensitivity balloon-like refract metric sensor based on single mode-tapered multimode-single mode fiber. Sens. Actuators A Phys. 2018, 281, 42–47. DOI: 10.1016/j.sna.2018.08.034.
- Tong, Z.; Zhong, Y.; Wang, X.; Zhang, W. Research on simultaneous measurement of refractive index and temperature comprising few mode fiber and spherical structure. Opt. Commun. 2018, 421, 1–6. DOI: 10.1016/j.optcom.2018.03.057.
- Dong, Y.; Xiao, S.; Wu, B.; Xiao, H.; Jian, S. Refractive index and temperature sensor based on D-shaped fiber combined with a fiber Bragg grating. IEEE Sensors J. 2019, 19, 1362–1367. DOI: 10.1109/JSEN.2018.2880305.
- Shi, J.; Su, G.; Xu, D.; Wang, Y.; Zhang, H.; Fu, S.; Feng, J.; Yan, C.; Xu, W.; Yao, J. A dual-parameter sensor using a long-period grating concatenated with polarization maintaining fiber in Sagnac loop. IEEE Sensors J. 2016, 16, 4326–4330. DOI: 10.1109/JSEN.2016.2544305.
- Zhu, Y.; Zheng, J.; Deng, H.; Yuan, L.; Deng, S.; Teng, C. Refractive index and temperature measurement by cascading macrobending fiber and a sealed alternated SMF-MMF structure. Opt. Commun. 2020, 485, 126738. DOI: 10.1016/j.optcom.2020.126738.
- Wang, F.; Pang, K.; Ma, T. Folded-tapered multimode-no-core fiber sensor for simultaneous measurement of refractive index and temperature. Opt. Laser Technol. 2020, 130, 106333. DOI: 10.1016/j.optlastec.2020.106333.
- Dai, B.; Shen, X.; Hu, X.; Yang, L.; Li, H.; Peng, J.; Li, J. Temperature-insensitive refractive index sensor with etched microstructure fiber. Sensors 2019, 19, 3749. DOI: 10.3390/s19173749.
- Duan, L.; Zhang, P.; Tang, M.; Wang, R.; Zhao, Z.; Fu, S.; Gan, L.; Zhu, B.; Tong, W.; Liu, D.; Liu, D.; Shum, P. P. Heterogeneous all-solid multicore fiber based multipath Michelson interferometer for high temperature sensing. Opt. Express. 2016, 24, 20210–20218. DOI: 10.1364/OE.24.020210.
- Quan, X.; Fry, E.S. Empirical equation for the index of refraction of seawater. Appl. Opt. 1995, 34, 3477–3480. DOI: 10.1364/AO.34.003477.