
 ?Mathematical formulae have been encoded as MathML and are displayed in this HTML version using MathJax in order to improve their display. Uncheck the box to turn MathJax off. This feature requires Javascript. Click on a formula to zoom.
Abstract
The high accurate detection of blood glucose level (BGL) is very important for non-invasive monitoring of diabetes mellitus. In this work, the optoacoustic (OA) quantitative in vitro detection of diabetes mellitus involving the comprehensive impacts of multiple factors (irradiation energy, concentration, temperature, flow rate and vessel depth) was firstly studied. To achieve this aim, a set of OA in vitro detection system of blood glucose with the comprehensive influence of five factors was constructed. The real-time OA signals of 625 rabbit whole blood were obtained at the characteristic wavelength of 750 nm, as well as peak-to-peak values (PPVs). Results show that the accurate detection of BGL was very difficult due to the complicated OA signals. To accurately predict the BGL under the comprehensive impacts of five factors, wavelet neural network (WNN) was employed to train BGL of 500 training set blood. The mean square error (MSE) of BGL for 125 testing set blood was 6.5782 mmol/L. To decrease the MSE, WNN optimized by quantum particle swarm optimization (QPSO), i.e., QPSO-WNN algorithm was utilized. The MSE of BGL based on QPSO-WNN was 0.37485 mmol/L, which was superior to 0.48005 mmol/L of PSO-WNN. Particularly, to further decrease MSE, a novel nonlinear dynamic shrinkage coefficient (DSC) strategy was proposed, and compared with other four kinds of DSC strategies and the fixed one. With the optimal parameters, the MSE of BGL was decreased to 0.3088 mmol/L. Comparison results of seven algorithms and research works demonstrate that OA technology combined with QPSO-WNN algorithm and the novel nonlinear DSC strategy has excellent performance in the quantitative detection of diabetes mellitus involving in the comprehensive impacts.
1. Introduction
At present, more and more people are suffering from the diabetes mellitus. According to the WHO reports there will be over 0.7 billion of diabetes patients in the world in 2045. The number of deaths from diabetes and its complications is approximately 5 million all over the world every year. The diabetes mellitus has already become the second biggest killer after cancer. Therefore, the situation of control and treatment of diabetes mellitus is imminent. Unfortunately, there are currently no any specific drugs can be used to cure the diabetes mellitus except hypoglycemic drugs and insulin used to control blood glucose in human body. Nevertheless, the reasonable control of diabetes mellitus requires the accurate monitoring of blood glucose concentration (BGL). Therefore, the accurate and stable measurement of BGL is an essential task treating the diabetes mellitus.
As for the traditional measurement of BGL, the blood needs to be acquired by puncturing a finger or drawing from a vein, then analyzed by the bio-chemical analyzer or the blood glucose meter. The traditional method not only brings an enormous economic, physical and mental burden, but also increases the risk of secondary infection because of skin damage. The non-invasive technique will be the development trend of BGL measurement in the future. Among the non-invasive methods, the optical detection is one of the most representative methods, for example, near-infrared spectroscopy,[Citation1,Citation2] mid-infrared spectroscopy,[Citation3,Citation4] Raman spectroscopy[Citation5,Citation6] and polarization technology.[Citation7,Citation8] Although these pure optical methods have the advantages of non-invasive, rapid and convenient, their accuracy and reliability are limited by the problems of tissue scattering light, spectral overlap and strong optical absorption of water, etc. To overcome these limitations, a novel, high-sensitive and non-invasive technology, i.e., optoacoustic (OA) technology[Citation9–11] was utilized in this study. The main advantage of the OA technology is higher accuracy and stability because it combines the advantage of pure optical and the advantage of pure ultrasonic. At the same time, it overcomes the interference of tissue scattering light because of the captured ultrasonic waves instead of the photons. Up to now, the monitoring of BGL via OA technology has already been studied by some scholars. Mackenzie[Citation12] performed the OA detection of blood glucose by using Nd:YAG pulsed laser. Zhao[Citation13] studied the glucose detection of milk solution, bio-tissue samples and human blood based on OA technology. Matti[Citation14] employed the OA technique to monitor the in vitro BGL of pigs at 532 and 1064 nm. Pai[Citation15] studied dual-wavelengths OA technology and Gaussian kernel-based regression (GKR) algorithm to establish the prediction model of glucose concentration of the aqueous solution, hemoglobin and whole blood, the predicted root-mean-square error (PRMSE) is 19.46 mg/dl. Tanaka[Citation16] utilized the differential continuous OA technology to detect the blood glucose in the human earlobe and in vitro blood samples. Sim[Citation17] studied the non-invasive in vivo monitoring of blood glucose by using the mid-infrared OA technology, and he investigated the influences of skin secretion products or water by obtaining the microscopic spatial information of skin. Aloraynan[Citation18] established a OA system with a single wavelength quantum cascade laser, and used machine learning classification algorithms to detect glucose levels. Shaikh et al.[Citation19] established a set of compact photoacoustic detection instrument to measure concentration of glucose solution by using ordinary least square (OLS) and machine learning algorithms.
Although OA technology has unique advantages in non-invasive detection, some factors inevitably affect the OA detection of blood glucose. Some researches on the influence of blood glucose OA detection have already been studied by some scholars. Tao[Citation20] and Tanaka[Citation21] studied the relationship of OA amplitude with temperature under the condition of different glucose concentrations and light intensities. At the same time, a theoretical model and calibration curve of temperature was proposed to compensate OA signals. Zhao[Citation22] thought that the accuracy of OA glucose measurement can be impacted by the physiological and temperature changes in the human body, as well as the motion artifacts, the heterogeneity of skin and a potential contact drift between the transducer and the test finger. Ren[Citation23,Citation24] investigated the effects of other components in blood on the OA detection of glucose. Christina[Citation25] studied the impacting factors on the accuracy of blood glucose monitoring systems, such as ambient, sampling conditions, system performance and user errors. However, up to now, the comprehensive influences of multiple factors on the OA detection of blood glucose have not been intensely studied in the world.
In addition, with the development of informatics technology, more and more artificial intelligent methods have already been applied into the data analysis and processing in biomedical fields. As for the informatics analysis and diagnosis of diabetes mellitus, some artificial neural network (ANN) algorithms have widely used in recent years. Zainuddin[Citation26] studied the measurement of blood glucose and used the wavelet neural network (WNN) and principle component analysis (PCA) to improve the diagnostic accuracy of BGL for the diabetic patients. Robertson[Citation27] used recurrent neural network (RNN) to perform the prediction of BGL based on a history of BGL, meal intake, and insulin injections. He[Citation28] studied a RNN to achieve the accurate and efficient prediction of individual blood glucose concentration based on a Internet of Thing platform with smartphones and continuous glucose monitors. Ali[Citation29] proposed a new method based on ANN for BGL prediction of type 1 diabetes using the data collected from continuous glucose monitoring system. Wang[Citation30] used multiple linear regression combined with back propagation (BP) neural network model to predict BGL in overweight patients. Alfian[Citation31] proposed an ANN model with time-domain attributes to predict BGL based on 12 patients with type 1 diabetes. Tucker[Citation32] investigated the effect of physiological sensor location on neural network blood glucose forecasting based on clinical data from patients with type 2 diabetes. Yen[Citation33] proposed a noninvasive blood glucose estimation system based on dual wavelength photoplethysmography and bioelectrial impedance measuring technology to measure the blood glucose, and used BP neural network to estimate the BGL. Tena[Citation34] proposed two ensemble neural network-based models to predict the blood glucose. Karim[Citation35] proposed a feed-forward neural network (FFNN) absorption model based on the nutrient contents to predict the BGL after meal, which obtain an excellent result that more than 96% of the predicted values fall in the clinically acceptable zone.
In this work, the comprehensive effects of multiple influencing factors on the OA detection of blood glucose were firstly studied. For our aims, an in vitro OA detection system of blood glucose for rabbit whole blood was constructed. In the system, five different influencing factors including irradiation energy, concentration, temperature, flow rate and vessel depth were considered. For each influencing factor, different levels were measured. The optimal characteristic absorption wavelength of blood glucose was determined. Under the optimal characteristic wavelength, the real-time OA signals and PPVs for 625 whole blood specimen of 125 rabbits were obtained corresponding to 625 groups of combination cases of five influencing factors. Then, to get the accuracy quantitative prediction of BGL under the comprehensive influence of five factors, WNN was employed to built the quantitative prediction model of the BGL for 500 training set blood of 100 rabbits with five influencing factors, and mean square error (MSE) was used as the evaluation criterion. To decrease the MSE of BGL, the QPSO algorithm was employed to optimize the parameters of WNN including the weights, learning rate factors, scaling factor and shifting factor of a liked-Morlet wavelet basic function, i.e., QPSO-WNN algorithm was used. In particular, to further decrease the MSE of BGL, a novel nonlinear dynamic shrinkage coefficient (DSC) strategy of QPSO algorithm was proposed in this work. The MSE values of the novel nonlinear DSC strategy were obtained at different coefficients, and compared with the fixed coefficient and other four kinds of DSC strategies, i.e., linear strategy, second order strategy, quadratic polynomial strategy and power exponent strategy. The better performance of QPSO-WNN algorithm with the novel nonlinear DSC strategy was presented, and the effects of iteration number and training number on the MSE of predicting BGL were also investigated. With the optimal parameters, the satisfactory MSE of predicting BGL for 125 testing set blood of the other 25 rabbits was obtained. The comparison results of seven algorithms demonstrate that the QPSO-WNN algorithm with the novel nonlinear DSC strategy is superior to the partial least square regression (PLSR), BP neural network, particle swarm optimized BP (PSO-BP) neural network, WNN, PSO-WNN and QPSO-WNN algorithms.
There are three purposes in this work. The first one is to construct an OA in vitro detection system of blood glucose considering the comprehensive influence of five factors. Based on the OA detection system, the real-time OA signals and PPVs of in vitro rabbit whole blood under different combinations of five influencing factors were obtained at the optimal characteristic wavelength. The second one is to firstly utilize WNN algorithm to accurately predict the BGL under the comprehensive impacts of five factors based on the OA PPVs of blood samples and values of five influencing factors. At the same time, to decrease MSE of BGL, the WNN was optimized by using QPSO algorithm. The third one is to propose a novel nonlinear DSC strategy of QPSO algorithm to further decrease the MSE of predicting BGL with the influence of five factors. Moreover, the excellent performance of predicting BGL with the comprehensive impacts of multiple influencing factors was validated by comparing results between the QPSO-WNN combined with the novel nonlinear DSC strategy and those of six other algorithms.
2. Principles
2.1. OA principle
Different from the pure optical technologies, the main mechanisms of OA technology is the photo-induced ultrasound effect. A simple process of generating OA signals is described as follows: when a tissue is irradiated by a beam of pulsed laser with nanosecond duration time at a wavelength, the irradiated region of tissue can absorb the energy and deposit it, which will result in the rapid volume expansion or shrinkage of the local tissue. Then, the ultrasonic waves, i.e., OA signals will be generated, and propagate towards the surface of tissue. Finally, it will be captured by the ultrasonic transducer. In general, the OA principle can be described by the wave equation,[Citation36,Citation37] i.e.,
(1)
(1)
where p is the OA intensity, v is the ultrasonic velocity, β is the volume expansion coefficient, and Cp is the specific thermal capacity. H is the thermal deposition function, which is dependent on the optical, ultrasonic, thermal and elastic attributes of blood.
However, since the detail analytic solution of EquationEquation (1)(1)
(1) is difficult to derived, the qualitative representation of OA intensity can be expressed as follows:[Citation38]
(2)
(2)
where k is the proportion coefficient, E is the laser energy, μα is the light absorption coefficient, R is the OA radius, r is the detection distance. In EquationEquation (2)
(2)
(2) , a, b, and c are the parameters. In general, 0<a < 1, 0.5<b < 2, 0<c < 2. Therefore, the OA intensity (p) is dependent on the parameters of pulsed laser and ultrasonic transducer (E, r, and R), optical properties (μα), thermal properties (β, Cp) and ultrasonic property (v). As for the different types of blood, the optical, ultrasonic and thermal properties are different, which results in the difference of the OA signal. The blood with different attributes can be quantitatively and qualitative measured via the inversion of data and analysis algorithms.
2.2. Wavelet neural network
In this work, WNN[Citation39,Citation40] was employed to establish the quantitative model of predicting BGL influenced by five factors. WNN is the combination of BP neural network and the wavelet transform, it not only inherits the structural properties of BP neural network,[Citation41] but also contains the advantages of the wavelet transform. In addition, it can avoid the drawbacks of BP neural network including the low convergent speed, local optimization and blindness of structured design. The schematic diagram of WNN is shown in .
Figure 1. The basic structure of WNN.
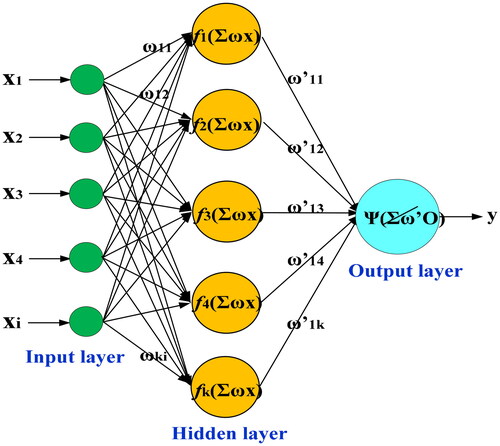
As in , there are three layers, i.e., the input layer, the hidden layer and the output layer in WNN. In the input layer, X= [x1, x2, ., xi] was used as the input data. In the hidden layer, a liked-Morlet wavelet basis function was used to replace the Sigmoid function as the activation function of WNN, which are given as follows:
(3)
(3)
Then, the output of the hidden layer () can be expressed as follows:
(4)
(4)
where
is the weights between the input layer and the hidden layer.
and
are the scaling factor and the shifting factor of the liked-Morlet wavelet basic function. i and k are the neuron nodes of the input layer and the hidden layer, respectively.
The output data of output layer () is expressed as follows:
(5)
(5)
where
is the weights between the output layer and the hidden layer. In the output layer, the excitation function
is the linear function.
Supposing that the expected output data of WNN is expressed as , the objective error (
) between the real output data (yj) and the expected output data (Dj) is expressed as follows:
(6)
(6)
where the superscript n denotes the nth of sample. N is the total number of samples.
In WNN, the error back propagation method is used to correct the parameters of WNN, i.e., weights ( and
), scaling factor and shifting factor (
and
) of the liked-Morlet wavelet basis function, i.e.,
(7)
(7)
where
and
are the corrected weights, scaling factor and shifting factor of the liked-Morlet wavelet basis function.
and
are the uncorrected weights, scaling factor and shifting factor of the liked-Morlet wavelet basis function.
and
are the learning rate factors of WNN.
2.3. Quantum particle swarm optimization
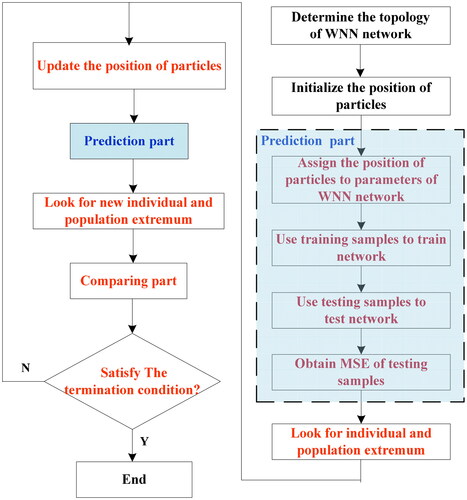
To decrease MSE of BGL of blood samples with the comprehensive influence of five factors, the QPSO algorithm[Citation42] was utilized to optimize the parameters of WNN, i.e., QPSO-WNN algorithm, was employed in this study. Since particle swarm optimization (PSO)[Citation43,Citation44] has the disadvantages of too many parameters and lack of randomness in particle position change, which is not conducive to find the optimal parameters of the model to be optimized and is easy to fall into the trap of local optimization. To overcome the drawbacks of PSO, the QPSO algorithm[Citation45,Citation46] was utilized in here. For the QPSO, it not only cancels the moving direction attribute of the particle to make the update of the particle position independent on the previous movement of the particle, but also raises the position randomness of particle by using the quantum stochastic behavior of Monte-Carlo method. The main steps of QPSO-WNN algorithm are presented in .
Figure 2. Main chart of QPSO-WNN algorithm.
Compared with PSO algorithm, QPSO is simpler because of the only one parameter, i.e., the position vector of particle. The update of particle position is performed via the following formulas, i.e.,
(8)
(8)
where pi is the local variant buffering the updated position of ith particle. pbesti denotes the individual extreme value, and gbest is the population extreme value. xi(n + 1) and xi(n) are the position vectors of after-updated particle and before-updated particle, respectively. α is the shrinkage coefficient, which is an important parameter utilized to affect the convergent time. Generally, the range of α is 0<α ≤ 1. φ and u are two random numbers, which are evenly distributed in the region from 0 to 1. For the symbol “±”, the randomness probability of the addition operation and the subtraction operation is 50%. Mbest is the mean value of the optimal particles, which is expressed as follows:
(9)
(9)
where M is the total number of particles.
As for the extreme value (pbesti) of the individual particle, which is expressed as follows:
(10)
(10)
2.4. Novel nonlinear dynamic shrinkage coefficient of QPSO algorithm
To further decrease the MSE of predicting BGL based on QPSO-WNN algorithm, the dynamic shrinkage coefficient (DSC) strategy[Citation47] was used to improve the performance of QPSO-WNN algorithm. As we know, when the shrinkage coefficient (α) is large, the global search capability will be stronger but the local search capability will be weaken. Conversely, when the shrinkage coefficient (α) is little, the local search capability will be stronger but the global search capability will be weaken. To balance the global search capability and the local search capability of the particles, a novel nonlinear DSC strategy was proposed in this work. At the same time, to verify the availability of the novel nonlinear DSC strategy, four kinds of different DSC strategies,[Citation48,Citation49] i.e., linear strategy (αI), second order strategy (αII), quadratic polynomial strategy (αIII), power exponent strategy (αIV) were compared. The four kinds of DSC strategies are given as follows:
(11)
(11)
(12)
(12)
(13)
(13)
(14)
(14)
The novel nonlinear DSC strategy proposed in this work is given as follows:
(15)
(15)
where αstart is the original shrinkage coefficient, which can be set to 1. αendI, αendII, αendIII, αendIV and αendV are the final shrinkage coefficients, which are all ranged in [0, 1]. Tmax is the maximum iteration number. k is the current iteration number.
The dynamic ranges of five kinds of DSC strategies are given in .
Table 1. Dynamic ranges of five kinds of DSC strategies.
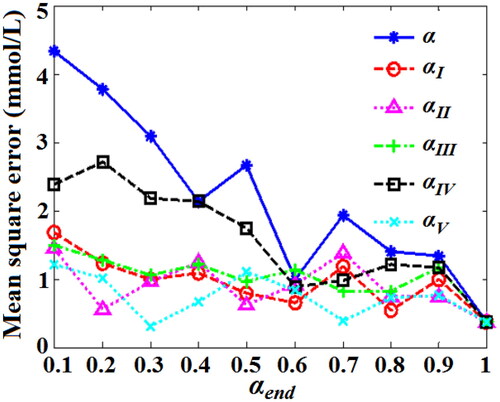
The function profiles of the novel nonlinear DSC strategy (αV) and other four DSC strategies (αI, αII, αIII, and αIV) are shown in .
Figure 3. Function profiles of the novel nonlinear DSC strategy (αV) and other four DSC strategies (αI, αII, αIII, αIV).
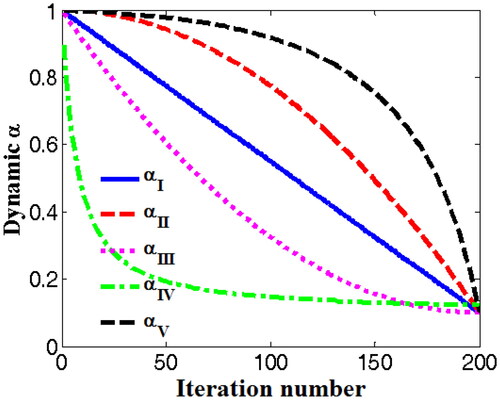
According to EquationEquations (11)–(15) and , it can be known that the first kind of DSC strategy (αI) is linear function. The second kind of DSC strategy (αII) and the novel DSC strategy (αV) are the convex functions, the third kind of DSC strategy (αIII) and the fourth kind of DSC strategy (αIV) are the concave functions. From , compared with other DSC strategies (αI, αII, αIII, αIV), it can be found that the value of novel nonlinear DSC strategy (αV) decreases slowly at the initial stage of iteration, which can ensure the stronger global search capability. With the increase of iteration number, the value of novel nonlinear DSC strategy (αV) decreases rapidly at the final stage of iteration, which can give consideration to the local optimal value search. Therefore, the novel nonlinear DSC strategy (αV) will has the advantages of faster convergence speed and higher accuracy than four others.
3. Experimental
3.1. Set-up and materials
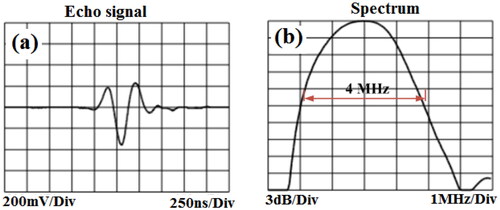
To study the influences of multiple factors on the OA detection of blood glucose, a OA detection system of in vitro blood considering the comprehensive influence of five factors was constructed, which is shown in . The influencing factors include irradiation energy, concentration, temperature, flow rate and vessel depth. In the system, an OPO pulsed laser pumped by 532 nm Nd:YAG (OPOletteTM, OPOTEK, USA) was utilized, its duration time is approximately 7 ns, its repetition rate is 20 Hz, its output energy can be adjusted from 0 to 2 mJ. The process of OA measurement of in vitro blood is represented as follows: A beam of laser excited from the OPO pulsed laser was modulated by the mirrors, iris and a collimation lens, then, it was focused by a focusing lens into a skin phantom. The skin phantom was prepared by 1 g agar powder and 100 g distilled water via the dissolution, heating and cooling method. The thickness of the agar block is approximately 12 mm. To simulate the vessel in the skin tissue, a vessel phantom of silicon micro-tube was buried in the agar block, which are shown in . The inner and outer diameters of silicon micro-tubes are 2 and 3 mm, respectively. The blood specimen was loaded in the silicon micro-tube, and flowed in a set of circulatory subsystem which is composed of beaker, mini-pump and two sections of silicon micro-tubes. The beaker loaded with the blood was heated by a heater with magnetic stirrer (MS-H, Hanhua Co., China), its precision of controlling temperature is approximately ±5%. The part of experimental setup including the reflecting, collimating and focusing of pulse laser beam, and the circulatory subsystem are shown in . The circulatory subsystem of blood was used to simulate the blood flow in human body, and conveniently replace the blood specimens with different concentrations of blood glucose in experiments. An ultrasonic transducer (UT) (type: 2.5C14SJ50XJ, Doppler Co., China) with the central echo frequency of approximately 2.5 MHz was placed under the agar block to capture the OA signals of blood glucose. The time-domain echo signal and frequency-domain spectrum of the ultrasonic transducer are given in , respectively. At the same time, in order to obtain the satisfactory OA signals of blood glucose, the UT was connected by a metal link rod to a 3D scanning platform. With the shifting adjustment of 3D platform, the focused laser spot was controlled to irradiate into the silicon micro-tube. Then, the captured OA signals of blood glucose were amplified by an amplifier (ATA-5620, Aigtek Co., China) with 60 dB gain. After the amplified OA signals were filtered by a low-pass filter (BLP-50+, Mini-Circuits Co., USA), they were acquired by a digital oscilloscope (GDS-3504, Gwinstek Co.) with 500 MHz bandwidth and 4.0 Gbs/s acquisition rate. Finally, a GPIB-USB digital I/O card (GPIB-USB-HS, NI Co., USA) with the rate of 7.7 MB/s was utilized to transfer the OA signals into the computer.
Figure 4. Schematic diagram of experimental setup (a), part of experimental setup (b), prepared skin phantom and vessel phantom (c), and rabbit whole blood specimen (d).
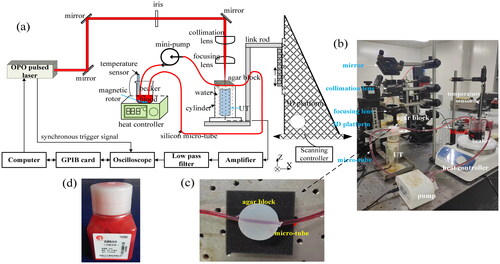
Figure 5. The time-domain echo signal (a) and frequency spectrum (b) of the ultrasonic transducer.
In experiments, rabbit whole blood were used as the experimental materials, which were bought from Jushi Bioengineering Co., Ltd (Henan province, China). A bottle of the rabbit whole blood specimen is shown in . In order to establish the quantitative model of predicting BGL with the influence of multiple factors, 625 whole blood specimens were collected from 125 rabbits. At the same time, a complete separation of data between the training and testing sets were performed, that is, 500 whole blood specimens of 100 rabbits were used as the training set blood, 125 whole blood specimens of the other 25 rabbits were used as the testing set blood. To ensure the availability of modeling BGL, there are no data from the same rabbit used for both training and testing sets, even at a different temperatures. In addition, to avoid the clotting of rabbit whole blood, the heparin sodium with proportion of 1.0 mg/ml was added into the rabbit whole blood specimens.
In this work, the effects of five influencing factors (irradiation energy, concentration, temperature, flow rate and vessel depth) on the OA detection of blood glucose were studied. To improve the experiments efficiency, a kind of permutation and combination combined with orthogonal experimental scheme was employed, i.e., the temperature and the flow rate were set via the permutation and combination method, the irradiation energy, concentration and vessel depth were set via the orthogonal experimental method. Moreover, five different levels were set for each influencing factors. As for the influencing factor of irradiation energy, to simulate the different absorption of laser energy for skin tissues, five different levels of laser irradiation energy were used, i.e., 0.15, 0.26, 0.37, 0.49, and 0.62 mJ. For concentration of blood glucose, the blood specimens with five different BGL levels were collected, i.e., 2 mmol/L (hypoglycemia), 5 mmol/L (normal), 8 mmol/L (slight diabetes), 11 mmol/L (moderate diabetes) and 14 mmol/L (severe diabetes) were determined according to the physiological ranges in clinics. For the temperature, 34, 36, 38, 40 and 42 °C were controlled by the heater. For the flow rate, the velocities of 0.057, 0.099, 0.145, 0.184, and 0.219 m/s were set by adjusting the rotation speed of water pump. To simulate the vessels at different depths in skin tissue, the silicon micro-tubes were buried in the agar block and distanced from the surface of agar blocks approximately 1, 1.5, 2, 2.5, and 3 mm, respectively. According to the permutation and combination combined with orthogonal experimental scheme, the permutation and combination of the temperature and the flow rate are 25 cases. For the irradiation energy, concentration and vessel depth, the orthogonal scheme with three factors and five levels (25 cases) were employed. Therefore, there are 625 cases of influencing combinations for five kinds of influence factors in the experiments.
3.2. Results and analysis
3.2.1. Optimal characteristic wavelength selection of blood glucose
In this work, the effects of multiple influencing factors on the OA detection of blood glucose were studied at a fixed characteristic wavelength. To obtain the characteristic wavelength of the blood glucose for rabbit whole blood, the real-time OA signals and peak-to-peak values (PPVs) of whole blood were obtained in the region of the visible light wavebands and the first region of near infrared waveband, i.e., from 700 to 1064 nm with interval of 5 nm. The real-time OA signals and the OA PPVs spectra of the blood glucose for rabbit whole blood are shown in the , respectively.
Figure 6. Real-time OA signals (a), and the OA PPVs spectra (b) of the blood glucose for rabbit whole blood; the enlarged view with error bars in the zoom region of real-time OA signals (c); the OA PPVs spectra with error bars.
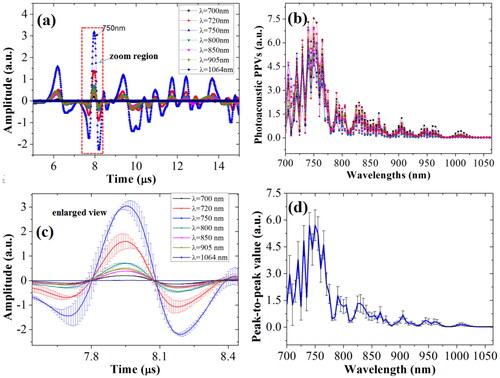
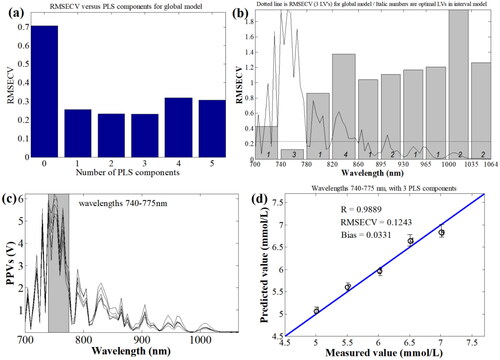
From , it can be known that the OA sensitivities and intensity of the blood glucose are different at the different wavelengths. According to the basic principles of the OA technique, the OA amplitude or intensity is positively proportional to the OA characteristic absorption. From the OA PPVs spectra from 700 to 1064 nm given in , it can be seen that the OA amplitude of rabbit whole blood from 720 to 750 nm are larger than those of other wavelengths. In experiments, the real-time OA signals of rabbit whole blood were averaged in 128 times, and the real-time OA signals and PPVs were taken the average of three times of measurements. To well represent the accuracy of experimental data, as well as the data repeatability and reproducibility, the enlarged view with error bars in the zoom region of real-time OA signals () and the OA PPVs spectra with error bars are presented in , respectively. From , it can be seen that the standard errors of the real-time OA signals and the OA PPVs of rabbit whole blood are relatively little, which demonstrates that data repeatability and reproducibility in experiments is satisfactory. To determine the optimal characteristic wavelength of blood glucose, OA PPVs spectra of the whole blood specimens for five rabbits and corresponding the real BGL values were used via the interval partial least square regression (iPLSR) method.[Citation50] In the iPLSR model, the OA PPVs full-wavelength spectra of whole blood were divided into 10 sub-wavebands. For the PLSR model for full-wavelengths spectra of apples, the root-mean-square errors of cross validation (RMSECV) under different numbers of principle components of PLSR model were obtained, which are shown in . From , it can be noticed that the RMSECV value is the minimum under the principle components of 3. Then, 10 PLSR models corresponding to 10 sub-wavebands were calculated with the cross validation, which are shown in . From , it can be seen that except the RMSECV value of the second sub-waveband, i.e., from 740 to 775 nm, is less than that of the RMSECV value of the full wavelengths, the RMSECV values of other sub-wavebands are all larger. In , the OA PPVs spectra of blood specimens in wavelength of 740 nm to 775 nm were chosen as the characteristic wavebands to further establish the PLSR model. Under 3 principle components of PLSR model, the results of the predicted BGL values were obtained, and compared with the measured values, which are shown in . From , it can be known that the correlation coefficient (R) is approximately 0.9889, the RMSECV is approximately 0.1243 mmol/L, and the absolute bias of BGL is approximately 0.0331 mmol/L. Therefore, the waveband from 740 to 775 nm was firstly determined as the characteristic waveband of blood glucose.
Figure 7. The characteristic wavebands optimization of blood glucose based on iPLSR model. (a) RMSECV of BGL for full-wavelengths under different PLS principle components; (b) RMSECV distributions of BGL in different sub-wavebands; (c) the chosen characteristic wavebands of blood glucose; (d) established PLSR model from 740 nm to 775 nm.
Then, to further find the optimal characteristic wavelength from the waveband from 740 to 775 nm with the interval of 5 nm, i.e., 8 wavelengths (740, 745, 750, 755, 760, 765, 770 and 775 nm), 8 least square fitting (LSF) models were established between the BGL and the PPVs, and the correlation coefficients of all wavelengths were computed, which are shown in .
Figure 8. Characteristic wavelengths optimization of blood glucose based on LSF model under different wavelengths.
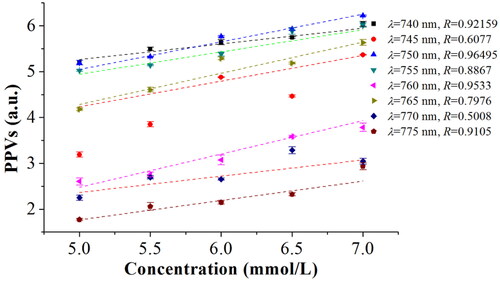
From , it can be obviously found that the correlation coefficient of LSF model for the wavelength of 750 nm is highest than those of others. Therefore, 750 nm was determined as the excitation wavelength of the OPO pulsed laser in this experiments. At the same time, the real-time OA signals and peak-to-peak values of blood glucose for the rabbit whole blood under the different combination of influencing factors were all obtained at the characteristic wavelength of 750 nm in this work.
3.2.2. Effects of influencing factors on the real-time OA signals of blood glucose
By using the constructed OA measurement system of blood glucose, the real-time OA signals of blood influenced with five influencing factors were captured by the UT, as shown in , respectively.
Figure 9. The real-time OA signals of blood glucose under different combinations of five factors. (a) different temperatures, (b) different flow rates, (c) different concentrations and vessel depths, (d) different irradiation energies and vessel depths.
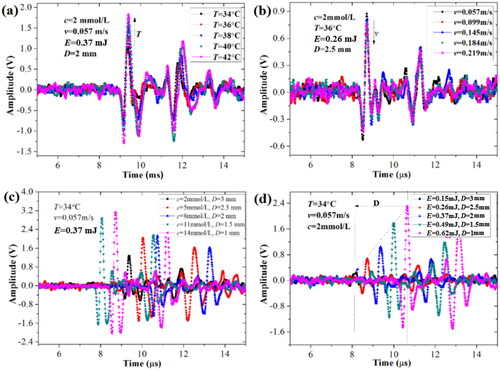
gives the real-time OA signals of blood glucose at different temperatures (T) and same conditions of concentration (c), flow rate (v), irradiation energy (E) and vessel depth (D). In , with the increase of temperature, the OA amplitudes of blood glucose increase, which demonstrates that the OA intensity of blood glucose is positively correlated with the temperature due to the thermal expansion mechanism. gives the real-time OA signals of blood glucose at different flow rates and same concentration, temperature, irradiation energy and vessel depth. In , the OA profiles of blood glucose aren’t changed, but the OA amplitudes of blood glucose decrease with flow rate. The reason may be interpreted by the attenuation of thermal-expansion effect reduced with the increase of flow rate of blood. presents the real-time OA signals of blood glucose with different concentrations and vessel depths but the same temperature, irradiation energy and flow rate. In , with the increase of concentration and the decrease of vessel depth, the OA amplitudes of blood glucose increase. At the nearer depth, the concentration of blood glucose is higher, the OA amplitude is larger. presents the real-time OA signals of blood glucose at different irradiation energies and vessel depths but same concentration, temperature and flow rate. In , the OA amplitudes of blood glucose linearly increase with the increase of irradiation energy and the decrease of vessel depth. Therefore, from the in vitro OA experiments, it can be known that the different irradiation laser energies, vessel depth in the subcutaneous tissue, temperature and flow rate of blood all impact to the OA intensity of blood glucose.
Additionally, in , the OA amplitude changes of blood glucose are different for different influencing factors, that is, the influences of different factors on the OA detection of blood glucose are complicated under the comprehensive influence of five different factors. As for the concentration, irradiation energy and temperature, they are positively related to the OA amplitude of blood glucose. However, as for the flow rate and vessel depth, they are negatively related to the OA amplitude of blood glucose. Moreover, from , it is difficult to predict the BGL under the comprehensive influence of five factors.
3.2.3. Comprehensive effects of influencing factors on the OA PPVs of blood glucose
To further represent the comprehensive influences of five factors on the OA detection of blood glucose, the OA PPVs of blood glucose for 625 groups of blood samples with the comprehensive influence of five factors were obtained, as shown in .
Figure 10. OA PPVs of blood glucose samples under the comprehensive influence of multiple factors. (a) under temperature and concentration; (b) under concentration and irradiation energy; (c) under temperature and irradiation energy; (d) under flow rates and vessel depth.
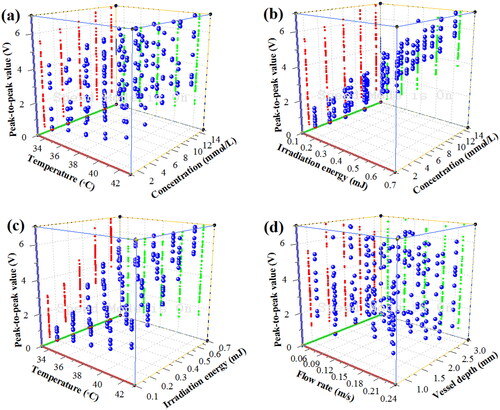
From , it can be seen that the PPVs of blood glucose increase with the temperature, concentration and the laser energy. Then, in , with the increase of flow rate and vessel depth, the PPVs of blood glucose decrease slightly. Although the basic laws of OA blood glucose detection can be obtained for the single influencing factor, the comprehensive influence laws of the multiple factors is usually complicated, especially when the number of influencing factors is too much. From to , it can be seen that not only the OA PPVs of blood glucose increase with the glucose concentration (c), but also the OA PPVs of each concentration of blood glucose also increase with the temperature (T) and the irradiation energy (E). In addition, from , it can be seen that under the factors with similar influence properties, e.g., temperature and irradiation energy, flow rate and vessel depth, the concentration of blood glucose is difficult to be quantitative predicted because the differences between data are not obvious. Moreover, from , it can be seen that, under the comprehensive influence of multiple factors, the OA PPVs of blood glucose samples are overlapped, which is not easy to accurately and quantitatively predict the BGL with the comprehensive influence of multiple factors only from the real-time OA signals and PPVs of blood glucose. Therefore, based on the spectra and signal analysis technology, it is necessary to use the data processing and intelligent artificial methods to achieve the accurate and quantitative prediction of BGL with the comprehensive influence of multiple factors.
4. Quantitative prediction of BGL based on WNN algorithms
4.1. Results of WNN, PSO-WNN and QPSO-WNN algorithms
Firstly, WNN was employed to establish the prediction model of BGL with the influence of five factors. In this study, five factors were used as the input variants, i.e., OA PPVs, laser energy, temperature, flow rate and detection distance, that is, the number of neurons for the input layer is 5. The BGL was used as the output variant, i.e., the number of neurons for the output layer is 1. To determine the optimal the number of neurons (k) of hidden layer in WNN, an empirical formula[Citation51] was used, i.e.,
(16)
(16)
where i and j are the neurons number for the input layer and the output layer, respectively. a is a constant ranged in [0, 10].
According to EquationEquation (16)(16)
(16) , the neurons number of the hidden layer in WNN is ranged from 2 to 12. To determine the optimal neurons number of the hidden layer in WNN, the influence of the neurons number in the hidden layer on the MSE of predicting BGL based on WNN was investigated, as shown in .
Figure 11. The effects of neurons number in hidden layer (a), the learning rate factor η (b), and the learning rate factor λ (c) on the MSE values of predicting BGL under the influence of five factors based on WNN, PSO-WNN and QPSO-WNN algorithms.
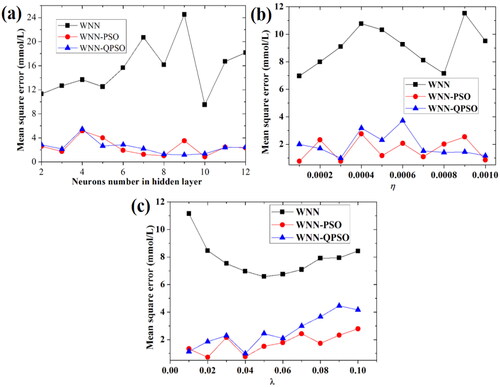
In , the MSE of predicting BGL first increases then decreases, and then increases with the neurons number of hidden layer in WNN algorithm. As for WNN, the MSE value is least (9.506453 mmol/L) when the neurons number of hidden layer is 10. Then, the influences of two learning rates (η and λ) on the MSE of predicting BGL based on WNN algorithm were also investigated, as shown in , respectively. In , when the learning rate factor (η) is 0.0001, the MSE of predicting BGL based on WNN algorithm is least (6.964467 mmol/L). In , when the learning rate factor (λ) is 0.05, the MSE of predicting BGL based on WNN algorithm is least (6.578212 mmol/L). Since MSE values is large, the performances of predicting the BGL based on WNN algorithm are unsatisfactory in here.
In order to improve the performance of WNN in the prediction of BGL with the comprehensive influence of five factors, PSO algorithm and QPSO algorithm were respectively used to optimize the parameters of WNN algorithm, and compared with each other. As we know, PSO is a kind of random search algorithm based on group cooperation developed by simulating the foraging behavior of birds. In PSO, the potential solution of each optimization problem is a bird called particle in the search space. To find the optimal solution of PSO, the cooperation and information sharing should be obeyed for the individuals in the population. In this work, the influences of the neurons number of hidden layer, two learning rates (η, λ) on the MSE values of predicting BGL based on PSO-WNN and QPSO-WNN algorithms were all investigated, as shown in , respectively. In , the MSE is least (0.870642 mmol/L) when the neurons number of hidden layer in PSO-WNN algorithm is 10. As for QPSO-WNN algorithm, the MSE is least (1.1703 mmol/L) when the neurons number of hidden layer is 9.
In , the MSE is least (0.762426 mmol/L) when the learning rate (η) of PSO-WNN algorithm is 0.0003. As for QPSO-WNN algorithm, when the learning rate (η) is 0.0003, the MSE of predicting BGL is approximately 0.990108 mmol/L. Then, in , the MSE is least (0.721484 mmol/L) when the learning rate (λ) of PSO-WNN algorithm is 0.02. As for QPSO-WNN algorithm, when the learning rate (λ) is 0.04, the MSE of predicting BGL is approximately 0.990108 mmol/L. Therefore, from the comparison results given in , the performances of PSO-WNN and QPSO-WNN algorithms are better than those of WNN algorithm. In here, the performance of PSO-WNN algorithm is good, the MSE is approximately 0.721484 mmol/L when the number of neurons of hidden layer is 10, the learning rate (η) is 0.0003 and the learning rate (λ) is 0.02. As for QPSO-WNN algorithm, the least MSE is approximately 0.990108 mmol/L when the number of neurons of hidden layer is 9, the learning rate (η) is 0.0003 and the learning rate (λ) is 0.04.
To decrease MSE of predicting BGL for the PSO-WNN algorithm and QPSO-WNN algorithm, the parameters optimizations were all performed. In PSO, the velocity and position vectors of particles are two most important parameters, which can be updated as follows:[Citation44]
(17)
(17)
where
denotes the initial velocity of particle.
denotes the updated velocity of particle. k denotes the iteration index.
is the inertia weight factor ranged in [0, 1].
and
are two acceleration factors.
and
are the random numbers uniformly distributed in the range from 0 to 1.
and
denote the initial position and the updated position of particle, respectively.
denotes the extreme value of individuals,
denotes the global extreme value in all particles.
As for PSO-WNN algorithm, three parameters including the inertia weight factor (w), and two acceleration factors (c1 and c2) are important. The inertia weight (w) is the influencing representation of the velocity of past particle to the velocity of present particle. When w is large, the global searching capability of particle is stronger, but the local searching capability of particle is weaker, which can enhance the speed of global searching and jump out the local optimal solution. Conversely, when w is little, the local searching capability of particle is stronger, but the global searching capability of particle is weaker, which can enhance the speed of local searching to find the local optimal solution quickly. As for two acceleration factors (c1 and c2), they have the important influence on the search capability of optimal solution and convergence speed of PSO algorithm. To obtain the optimal parameters of the inertia weight factor (w), two acceleration factors (c1 and c2), the influences of two acceleration factors (c1 and c2) and the inertia weight factor (w) on the MSE values of predicting BGL based on PSO-WNN algorithm were investigated, as shown in , respectively.
Figure 12. The effects of the acceleration factor (c1) (a), and the acceleration factor (c2) (b), the inertia weight factor (w) (c) on the MSE values of predicting BGL based on PSO-WNN algorithm.
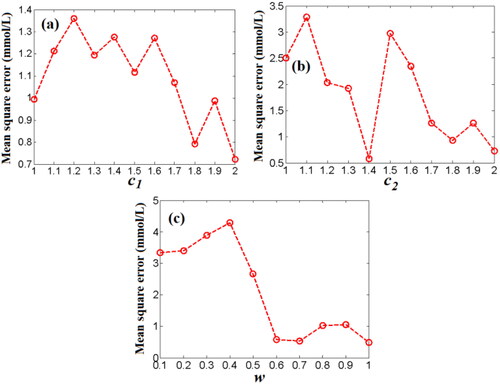
To find the optimal values of two acceleration factors (c1 and c2), the previous experience[Citation44] was used in here. Firstly, the value of c2 was set to 2 and the inertia weight factor (w) was set to a moderate value, i.e., w = 0.6, then, the range value of c1 was chosen in [Citation1, Citation2]. In , the MSE is least (0.72 mmol/L) when c1 is 2, that is, the optimal value of c1 is 2. Then, c1 was set to 2 and the inertia weight factor (w) was set to 0.6, the range value of c2 was chosen in [Citation1, Citation2]. In , the MSE is least (0.58 mmol/L) when c2 is 1.4. As the acceleration factor (c1) and the acceleration factor (c2) were set to 2 and 1.4, the value of the inertia weight factor (w) will be ranged in [0.1, 1]. In , the MSE is least when w is 1. Therefore, the optimal values of the acceleration factor (c1), the acceleration factor (c2) and the inertia weight factor (w) of PSO-WNN algorithm are 2, 1.4 and 1, respectively. At this time, the MSE of predicting blood glucose concentration can reach 0.48 mmol/L.
Then, the influences of training number and iteration number on the MSE of BGL based on PSO-WNN algorithm for the training set blood and the testing set blood were also investigated, as shown in , respectively.
Figure 13. The effects of training number (a) and iteration number (b) on the MSE of BGL based on PSO-WNN algorithm, and the Clarke error grid analysis (c).
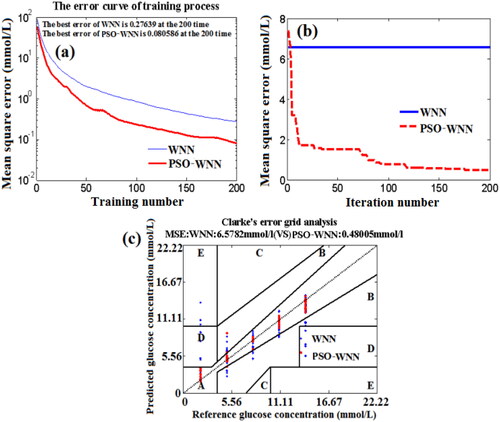
In , the MSE values of PSO-WNN algorithm are less than those of WNN algorithm. At the training number of 200, the MSE of predicting BGL for the training blood samples by using PSO-WNN algorithm is approximately 0.080586 mmol/L, which is much less than that (0.27639 mmol/L) of the WNN algorithm. In , the MSE of testing set blood based on PSO-WNN algorithm is much less than that of WNN algorithm although the MSE of PSO-WNN algorithm is higher than that of WNN algorithm at the beginning of iteration number. With the increase of iteration number, the MSE of predicting BGL for testing set blood by using PSO-WNN algorithm decreases, but the MSE of WNN algorithm isn’t changed. At the iteration number of 200, the MSE of PSO-WNN algorithm is approximately 0.48005 mmol/L, which is much less than that (6.5782 mmol/L) of WNN algorithm.
gives the Clarke error grid analysis of quantitative prediction of blood glucose concentration for 125 testing set blood based on PSO-WNN algorithm and compared with that of WNN algorithm. In , the prediction results of BGL based on WNN is not satisfactory because the concentration of many blood samples are mistaken into Zone B, Zone D and Zone E. However, for PSO-WNN algorithm, except for the concentrations of 3 testing set blood are mistaken into Zone B, the concentration of others all fall in Zone A.
Then, the parameter optimization of QPSO algorithm was also studied. In QPSO algorithm, the shrinkage coefficient (α) is only one parameter in the QPSO algorithm which can be adjusted to improve prediction accuracy and control the convergent speed. To find the optimal value of shrinkage coefficient (α) of QPSO algorithm, the effect of shrinkage coefficient (α) on the MSE value of predicting BGL based on QPSO-WNN algorithm was investigated, as shown in .
Figure 14. Effect of shrinkage coefficient (a), training number (b), and iteration number (c) on the MSE value of predicting BGL based on QPSO-WNN algorithm.
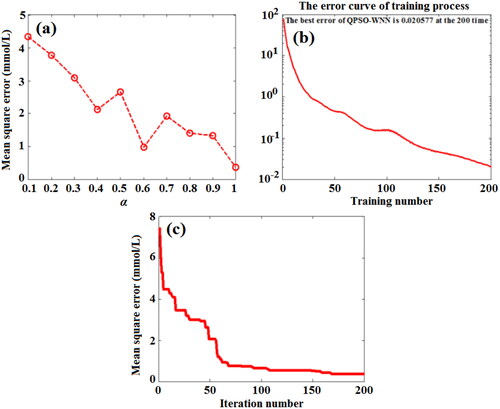
In , with the increase of shrinkage coefficient (α), the MSE value of predicting BGL based on QPSO-WNN algorithm decreases. When the shrinkage coefficient (α) is 1, the MSE is least, which is approximately 0.37 mmol/L. Then, the effects of training number and iteration number on the MSE of predicting BGL for the training set blood and the testing set blood based on QPSO-WNN algorithm were investigated, as shown in , respectively. In , with the increase of training number and iteration number, the MSE values of BGL of the training set blood and the testing set blood all decrease. At the training number of 200 and iteration number of 168, the MSE of predicting BGL for the training set blood and the testing set blood are respectively 0.020577 mmol/L and 0.37 mmol/L, which are less than those of the WNN algorithm and PSO-WNN algorithm.
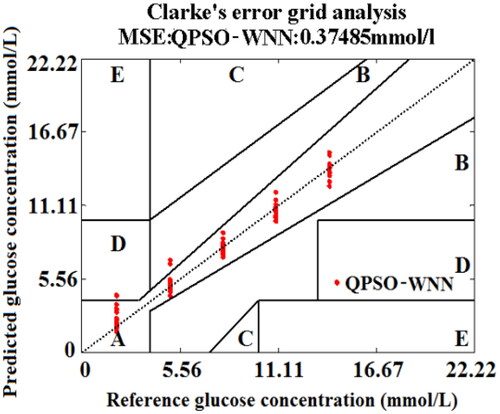
In , the predicted BGL of testing set blood lie in the Zone A except for three groups are fallen into Zone B. For these three groups, the deviations of BGL for the reference glucose concentrations based on QPSO-WNN algorithm are less than those of the PSO-WNN algorithm. Moreover, the MSE (0.37485 mmol/L) of BGL for 125 testing set blood based on QPSO-WNN algorithm is less than that (0.48005 mmol/L) of PSO-WNN algorithm.
Figure 15. Clarke error grid analysis of testing set blood based on QPSO-WNN algorithm.
4.2. Results of novel nonlinear DSC strategy of QPSO algorithm
To verify the availability of the novel nonlinear DSC strategy (αV), the MSE values of predicting BGL for 125 testing set blood based on QPSO-WNN with novel nonlinear DSC strategy (αV) were obtained under different values of final shrinkage coefficients, and compared with those of other four kinds of DSC strategies (αI, αII, αIII, αIV) and the fixed shrinkage coefficient (α), as shown in .
Figure 16. MSE values of predicting BGL for testing set blood based on QPSO-WNN with different DSC strategies.
In , the MSE values of five kinds of DSC strategies (αI, αII, αIII, αIV, αV) are all less than those of the fixed shrinkage coefficient (α). At the same time, for the novel nonlinear DSC strategy (αV), most of the MSE values are less than those of other four kinds of DSC strategies (αI, αII, αIII, αIV,), which demonstrates that the performance of predicting BGL with the influence of five factors based on QPSO-WNN algorithm with the novel nonlinear DSC strategy (αV) is better than those of others. In , for other four kinds of DSC strategies (αI, αII, αIII, αIV,) and the fixed shrinkage coefficient (α), the MSE values are all least (0.37 mmol/L) when the the fixed shrinkage coefficient (α) and the final shrinkage coefficients (αendI, αendII, αendIII, αendIV) are all equal to 1. For the the novel nonlinear DSC strategy (αV), its MSE value is least (0.3088 mmol/L) when the final shrinkage coefficient (αendV) is 0.3, which is better than those of others. Therefore, it is demonstrated that the novel nonlinear DSC strategy (αV) is exactly superior to other four kinds of DSC strategies and the fixed shrinkage coefficient.
The effects of training number and iteration number on the MSE values of predicting BGL for the training set blood and the testing set blood based on the QPSO-WNN algorithm with the novel nonlinear DSC strategy (αV) were also investigated, as shown in , respectively.
Figure 17. The effects of training number (a) and iteration number (b) on the MSE values of BGL for the training set blood and the testing set blood based on the QPSO-WNN algorithm with the novel nonlinear DSC strategy (αV), and Clarke error grid analysis (c).
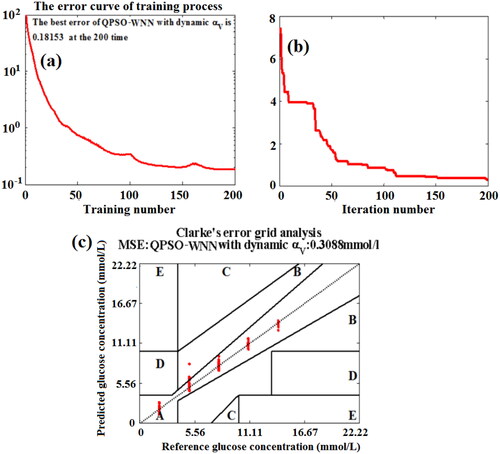
In , the MSE of predicting BGL exponentially decreases with the increase of training number for the training set blood. Although the MSE (0.18153 mmol/L) of predicting BGL for the training set blood at the training number of 200 based on based on QPSO-WNN algorithm with the novel nonlinear DSC strategy (αV) is larger than those of the PSO-WNN algorithm and QPSO-WNN algorithm ( and ), the MSE (0.3088 mmol/L) of predicting BGL for the testing set blood at the iteration number of 200 is smaller than those of the PSO-WNN algorithm and QPSO-WNN algorithm (Figure12(b) and ), which demonstrate that the QPSO-WNN algorithm with novel DSC strategy (αV) not only reduces the overfitting problems of PSO-WNN algorithm and QPSO-WNN algorithm, but also decreases MSE of BGL for the testing set blood samples. In addition, the Clarke error grid analysis of 125 testing set blood based on QPSO-WNN with novel nonlinear DSC strategy (αV) was obtained, which is shown in . From , it can be found that except for only two blood samples fall into Zone B, other testing blood all lie in Zone A for the QPSO-WNN algorithm with novel nonlinear DSC strategy (αV). At the same time, the MSE of blood glucose concentration of testing set blood based on QPSO-WNN algorithm with novel nonlinear DSC strategy (αV) is approximately 0.3088 mmol/L, which is less than the MSE (0.37485 mmol/L) of QPSO-WNN algorithm, the MSE (0.48005 mmol/L) of PSO-WNN algorithm and the MSE (6.5782 mmol/L) of WNN algorithm. Therefore, the performance of predicting BGL under the influence of five factors based on the QPSO-WNN algorithm with novel nonlinear DSC strategy (αV) is superior to those of others.
4.3. Comparison results of several algorithms
To verify the availability of the QPSO-WNN with the novel nonlinear DSC strategy used in the OA in vitro quantitative measurement of BGL influenced by five factors, the MSE values of predicting BGL for 125 testing set blood based on seven different algorithms were obtained and compared, as shown in . Seven different algorithms include PLSR algorithm,[Citation52] BP neural network algorithm, PSO-BP neural network algorithm, WNN algorithm, PSO-WNN algorithm, QPSO-WNN algorithm, improved QPSO-WNN algorithm, i.e., QPSO-WNN algorithm with the novel nonlinear DSC strategy, labeled with IQPSO-WNN in .
Figure 18. MSE of predicting BGL for 125 testing set blood based on several different algorithms.
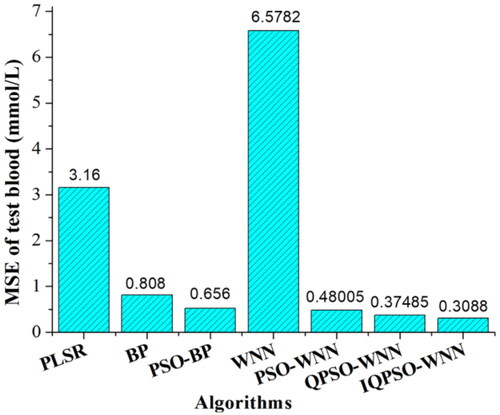
In , the MSE of predicting BGL based on PLSR model is approximately 3.16 mmol/L. Because the PLSR is a kind of linear quantitative prediction model, which results in a large MSE of BGL for 125 testing set blood under the comprehensive and complicated influence of five factors. As for BP neural network algorithm, when the neurons number of hidden layer is 11, the learning rate factor is 0.001 and the training number is 200, its MSE of BGL is approximately 0.808 mmol/L. As for the PSO-BP neural network algorithm, when the neurons number of hidden layer is 13, the learning rate factor is 0.001, the inertia weight is 0.6, two acceleration factors are all 2, the training number and the iteration number are all 200, the MSE of BGL is approximately 0.656 mmol/L. Although the MSE of BGL based on WNN algorithm is unsatisfactory due to the lack of relevance for the different combinations of five influencing factors, the MSE of BGL is decreased by the PSO-WNN and QPSO-WNN algorithms because the parameters of WNN were optimized by the PSO and QPSO algorithms. At the same time, since the parameters and structures of QPSO algorithm are simper than those of PSO algorithm, as well as the randomness was increased, which results in a better performance. Moreover, since an improved QPSO-WNN (IQPSO-WNN) algorithm, i.e., the QPSO-WNN algorithm with the novel nonlinear DSC strategy was proposed in this work, the MSE of BGL for 125 testing set blood was further decreased to 0.3088 mmol/L.
4.4. Comparison results of different research works
Finally, the comparisons for predicting glucose concentration between our work and other research works were performed, which are given in .
Table 2. Comparisons for predicting glucose concentration between our work and other research works.
From , it can be known that optical methods (NIR spectroscopy and Raman spectroscopy, etc.) and optoacoustic (or photoacoustic) spectroscopy all have a certain of performance for the prediction of glucose concentration. However, compared with the in vitro detection of glucose solution, intralipid and the whole blood, the accuracy of in vivo detection (in vivo animals and in vivo human body) is lower than those of the in vitro detection. The main reason that the accuracy of in vivo detection is lower may be induced by the interference of complicated bio-tissue and influence factors. The problems about the impacts of multiple influence factors must be faced by researchers in practice applications of monitoring diabetes mellitus. From , it can be also seen that the performances of predicting BGL based on machine learning algorithms (SVR, KNNR, GKR, and IQPSO-WNN) sometimes are better than those of the traditional linear fitting algorithms (OLS, MLR, and PLSR). Moreover, it is the first time for our work to study the quantitative detection of diabetes mellitus with the comprehensive impacts of multiple influencing factors by using the OA technology combined with the QPSO-WNN algorithm and the novel nonlinear DSC strategy, and the MSE of predicting BGL is 0.3088 mmol/L, which is superior to some results of previously reported[Citation15,Citation16] Therefore, the OA technology combined with the QPSO-WNN algorithm and the novel nonlinear DSC strategy has the significant performance in the quantitative detection of diabetes mellitus with the comprehensive impacts of multiple influencing factors.
5. Conclusion
OA detection of blood glucose will be inevitably impacted by varieties of influencing factors in practice. Sometimes, the mechanisms of the influencing factors are different and complicated, especially for the consideration of comprehensive influencing factors. In this work, five different influencing factors (irradiation energy, temperature, concentration, flow rate and vessel depth) were investigated in the OA detection of blood glucose for the in vitro rabbit whole blood specimens. In experiments, the real-time OA signals and PPVs of blood glucose with different combinations of five influencing factors were obtained at the characteristic wavelength of 750 nm, and the influence laws of five influencing factors were also found. Then, to ensure the prediction accuracy of BGL influenced by five factors, WNN algorithm was employed to establish the prediction model between the BGL and other five factors. To decrease MSE of BGL, the WNN was optimized by using QPSO algorithm. Moreover, a novel nonlinear DSC strategy of QPSO algorithm was proposed to further decrease MSE. The results can be concluded as follows:
For the influence laws of five factors, the OA amplitudes and PPVs of blood glucose increase with temperature, concentration and irradiation energy, but decrease with flow rate and vessel depth. Despite all this, it is not easy to accurately and quantitatively measure the BGL comprehensively influenced by multiple factors due to the overlapped OA PPVs, as well as the complicated and changeable real-time OA signals of blood glucose.
Under the optimal parameters of WNN, the MSE value of predicting BGL for the testing set blood is approximately 6.5782 mmol/L. To decrease the MSE of BGL, QPSO algorithm was employed to optimize the WNN network. Under the optimization of parameters, the MSE of BGL based on QPSO-WNN algorithm is approximately 0.37485 mmol/L, which is less than that (0.48005 mmol/L) of PSO-WNN algorithm, which demonstrates the performance of QPSO-WNN algorithm is better than that of the PSO-WNN algorithm.
To further decrease MSE of BGL, a novel nonlinear DSC strategy was proposed and used to optimize the QPSO-WNN algorithm. Compared with other four kinds of DSC strategies and the fixed shrinkage coefficient under the different final shrinkage coefficients, training number and iteration number, the MSE of BGL based on the QPSO-WNN with the novel nonlinear DSC strategy (αV) is approximately 0.3088 mmol/L, which is less than those of the other DSC strategies and fixed shrinkage coefficient.
The MSE of predicting BGL for the testing set blood based on the QPSO-WNN algorithm with the novel nonlinear DSC strategy was compared with those of the PLSR model, BP neural network, PSO-BP neural network, WNN, PSO-WNN, QPSO-WNN algorithms. It is demonstrated that the OA technology combined with the QPSO-WNN algorithm and the novel nonlinear DSC strategy (αV) has a significant effect in the quantitative measurement of blood glucose influenced by multiple factors. In the next work, we will plan to apply this technology to the in vivo OA detection of blood glucose.
Disclosure statement
No potential conflicts of interest was reported by the author(s).
Additional information
Funding
References
- Shokrekhodaei, M.; Cistola, D.P.; Roberts, R.C.; Quinones, S. Non-invasive glucose monitoring using optical sensor and machine learning techniques for diabetes applications. IEEE Access 2021, 9, 73029–73045.
- Han, G.; Chen, S.; Wang, X.; Wang, J.H.; Wang, H.Q.; Zhao, Z. Noninvasive blood glucose sensing by near-infrared spectroscopy based on PLSR combines SAE deep neural network approach. Infrared Phys. Tech. 2021, 113, 103620.
- Delbeck, S.; Heise, H.M. Evaluation of opportunities and limitations of mid-infrared skin spectroscopy for noninvasive blood glucose monitoring. J. Diabetes Sci. Technol. 2021, 15, 19–27.
- Kasahara, R.; Kino, S.; Soyama, S.; Matsuura, Y. Noninvasive glucose monitoring using mid-infrared absorption spectroscopy based on a few wavenumbers. Biomed. Opt. Express. 2018, 9, 289–302.
- Pandey, R.; Paidi, S.K.; Valdez, T.A.; Zhang, C.; Spegazzini, N.; Dasari, R.R.; Barman, I. Noninvasive monitoring of blood glucose with Raman spectroscopy. Acc. Chem. Res. 2017, 50, 264–272.
- Kang, J.W.; Park, Y.S.; Chang, H.; Lee, W.; Singh, S.P.; Choi, W.; Galindo, L.H.; Dasari, R.R.; Nam, S.H.; Park, J.; So, P.T.C. Direct observation of glucose fingerprint using in vivo Raman spectroscopy. Sci. Adv. 2020, 6, 5206.
- Bolla, A.S.; Priefer, R. Blood glucose monitoring-an overview of current and future non-invasive devices. Diabetes Metab. Syndr. 2020, 14, 739–751.
- Dremin, V.; Marcinkevics, Z.; Zherebtsov, E.; Popov, A.; Grabovskis, A.; Kronberga, H.; Geldnere, K.; Doronin, A.; Meglinski, I.; Bykov, A. Skin complications of diabetes mellitus revealed by polarized hyperspectral imaging and machine learning. IEEE Trans. Med. Imag. 2021, 40, 1207–1216.
- Aloraynan, A.; Rassel, S.; Xu, C.; Ban, D. A single wavelength mid-infrared photoacoustic spectroscopy for noninvasive glucose detection using machine learning. Biosensors 2022, 12, 166.
- Devadiga, D.; Ahipa, T.N. Photoacoustic spectroscopy mediated non-invasive detection of diabetics. In Advanced Bioscience and Biosystems for Detection and Management of Diabetes, Sadasivuni, K.K., Cabibihan, J.J., A M Al-Ali, A.K., Malik, R.A., Eds.; Springer: Cham, 2022; pp. 165–180.
- Ren, Z.; Liu, T.; Liu, G. Classification and discrimination of real and fake blood based on photoacoustic spectroscopy combined with particle swarm optimized wavelet neural networks. Photoacoustics 2021, 23, 100278.
- MacKenzie, H.A.; Ashton, H.S.; Spiers, S.; Shen, Y.C.; Freeborn, S.S.; Hannigan, J.; Lindberg, J.; Rae, P. Advances in photoacoustic noninvasive glucose testing. Clin. Chem. 1999, 45, 1587–1595.
- Zhao, Z.; Myllylä, R. Measuring the optical parameters of weakly absorbing, highly turbid suspensions by a new technique: Photoacoustic detection of scattered light. Appl. Opt. 2005, 44, 7845–7852.
- Matti, K.; Risto, M. Effect of glucose on photoacoustic signals at the wavelength of 1064 and 532nm in pig blood and intraliquid. J. Phys. D Appl. Phys. 2005, 38, 2654–2661.
- Pai, P.P.; De, A.; Banerjee, S. Accuracy enhancement for noninvasive glucose estimation using dual-wavelength photoacoustic measurements and kernel-based calibration. IEEE T. Instru. Meas. 2017, 99, 1–11.
- Tanaka, Y.; Tajima, T.; Seyama, M.; Waki, K. Differential continuous wave photoacoustic spectroscopy for non-invasive glucose monitoring. IEEE Sensors J. 2020, 20, 4453–4458.
- Sim, J.Y.; Ahn, C.G.; Jeong, E.J.; Kim, B.K. In vivo microscopic photoacoustic spectroscopy for non-invasive glucose monitoring invulnerable to skin secretion products. Sci. Rep. 2018, 8, 1059.
- Aloraynan, A.; Rassel, S.; Xu, C.; Ban, D.Y. Machine learning classifiers for noninvasive glucose detection using a single wavelength mid-infrared photoacoustic spectroscopy. In Proceedings of Biomedical Spectroscopy, Microscopy, and Imaging II, SPIE, 12144, 121440I, Strasbourg, France, 2022.
- Shaikh, F.; Haworth, N.; Wells, R.; Bishop, J.; Chatterjee, S.K.; Banerjee, S.; Laha, S. Compact instrumentation for accurate detection and measurement of glucose concentration using photoacoustic spectroscopy. IEEE Access 2022, 10, 31885–31895.
- Tao, W.; Lu, Z.; He, Q.; Lv, P.; Wang, Q.; Zhao, H. Research on the temperature characteristics of the photoacoustic sensor of glucose solution. Sensors 2018, 18, 4323.
- Tanaka, Y.; Tajima, T.; Seyama, M.; Waki, K. Resonant photoacoustic spectroscopy for a non-invasive blood glucose monitoring: Human interface and temperature correction technology. In Proceedings of Photons plus Ultrasound: Imaging and Sensing, SPIE, San Francisco, California, USA, 2019; vol. 10878; pp. 1087841.
- Zhao, Z.; Myllyla, R.A. Photoacoustic blood glucose and skin measurement based on optical scattering effect. In Proceedings of Saratov Fall Meeting 2001: Optical Technologies in Biophysics and Medicine III. International Society for Optics and Photonics, SPIE, Saratov, Russian Federation, 2002; vol. 4707; pp. 153–157.
- Liu, T.; Ren, Z.; Liu, G.D.; Zhang, C.C. 11617 Photoacoustic detection of glucose for the milk-glucose mixed solution. In Proceedings of International Conference on Optoelectronic and Microelectronic Technology and Application, SPIE, Nanjing, China, 2020; pp. 13–20.
- Ren, Z.; Liu, G.D. Effect of salt content on the photoacoustic detection of glucose solutions. In Proceedings of the14th National Conference on Laser Technology and Optoelectronics (LTO 2019), SPIE, Shanghai, China, 2019; vol. 11170; pp. 8–15.
- Schmid, C.; Haug, C.; Heinemann, L.; Freckmann, G. System accuracy of blood glucose monitoring systems: Impact of use by patients and ambient conditions. Diabetes Technol. Ther. 2013, 15, 889–896.
- Zainuddin, Z.; Pauline, O.; Ardil, C. A neural network approach in predicting the blood glucose level for diabetic patients. Inter. J. Comput. Inform. Eng. 2009, 3, 436–443.
- Robertson, G.; Lehmann, E.D.; Sandham, W.; Hamilton, D.J. Blood glucose prediction using artificial neural networks trained with the AIDA diabetes simulator: A proof-of-concept pilot study. J. Electr. Comput. Eng. 2011, 2011, 1–11.
- He, M.; Gu, W.; Kong, Y.; Zhang, L.; Costas, J.S.; Khalid, M.M. Causalbg: causal recurrent neural network for the blood glucose inference with IoT platform. IEEE Internet Things J. 2020, 7, 598–610.
- Ben Ali, J.; Hamdi, T.; Fnaiech, N.; Di Costanzo, V.; Fnaiech, F.; Ginoux, J.-M. Continuous blood glucose level prediction of type 1 diabetes based on artificial neural network. Biocybern. Biomed. Eng. 2018, 38, 828–840.
- Wang, J.; Wang, F.; Liu, Y.; Xu, J.; Lin, H.; Jia, B.; Zuo, W.; Jiang, Y.; Hu, L.; Lin, F. Multiple linear regression and artificial neural network to predict blood glucose in overweight patients. Exp. Clin. Endocrinol. Diabetes. 2016, 124, 34–38.
- Alfian, G.; Syafrudin, M.; Anshari, M.; Benes, F.; Atmaji, F.T.D.; Fahrurrozi, I.; Hidayatullah, A.F.; Rhee, J. Blood glucose prediction model for type 1 diabetes based on artificial neural network with time-domain features. Biocybern. Biomed. Eng. 2020, 40, 1586–1599.
- Tucker, A.P.; Erdman, A.G.; Schreiner, P.J.; Ma, S.S.; Chow, L.S. Examining sensor agreement in neural network blood glucose prediction. J. Diabetes Sci. Tech. 2021.
- Yen, C.T.; Chen, U.H.; Wang, G.C.; Chen, Z.X. Non-invasive blood glucose estimation system based on a neural network with dual-wavelength photoplethysmography and bioelectrical impedance measuring. Sensors 2022, 22, 4452.
- Tena, F.; Garnica, O.; Lanchares, J.; Hidalgo, J.I. Ensemble models of cutting-edge deep neural networks for blood glucose prediction in patients with diabetes. Sensors 2021, 21, 7090.
- Karim, R.A.H.; Vassányi, I.; Kósa, I. After-meal blood glucose level prediction using an absorption model for neural network training. Comput. Biol. Med. 2020, 125, 103956.
- Timonov, A. Regularization of the boundary control method for numerical solutions of the inverse problem for an acoustic wave equation. Inverse Probl. Sci. Eng. 2021, 29, 1477–1496.
- Erkol, H.; Unlu, M.B. Spectral power density of the random excitation for the photoacoustic wave equation. AIP Adv. 2014, 4, 097103–097179.
- Patel, C.K.N.; Tam, A.C. Pulsed optoacoustic spectroscopy of condensed matter. Rev. Mod. Phys. 1981, 53, 517–550.
- Yang, L.; Chen, H. Fault diagnosis of gearbox based on RBF-PF and particle swarm optimization wavelet neural network. Neural Comput. Appl. 2019, 31, 4463–4478.
- Liu, J.; Li, P.; Tang, X.; Li, J.; Chen, J. Research on improved convolutional wavelet neural network. Sci. Rep. 2021, 11, 17941.
- Han, J.X.; Ma, M.Y.; Wang, K. Product modeling design based on genetic algorithm and BP neural network. Neural Comput. Appl. 2021, 33, 4111–4117.
- Zhang, D.; Wang, J.; Fan, H.; Zhang, T.; Gao, J.X.; Yang, P. New method of traffic flow forecasting based on quantum particle swarm optimization strategy for intelligent transportation system. Int. J. Commun. Syst. 2021, 34, e4647.
- Wang, F.; Zhang, H.; Zhou, A. A particle swarm optimization algorithm for mixed-variable optimization problems. Swarm Evol. Comput. 2021, 60, 100808.
- Sun, J.; Wu, X.J.; Palade, V.; Fang, W.; Lai, C.H.; Xu, W.B. Convergence analysis and improvements of quantum-behaved particle swarm optimization. J. Inf. Sci. 2012, 193, 81–103.
- Sun, J. Particle swarm optimization with particles having quantum, Ph.D. thesis, Jiangnan University, Wuxi, China, 2009.
- Geng, X.; Lu, S.; Jiang, M.; Sui, Q.; Lv, S.; Xiao, H.; Jia, Y.; Jia, L. Research on FBG-based CFRP structural damage identification using BP neural network. Photonic Sens. 2018, 8, 168–175.
- Bajaj, A.; Abraham, A.; Ratnoo, S.; Gabralla, L.A. Test case prioritization, selection, and reduction using improved quantum-behaved particle swarm optimization. Sensors 2022, 22, 4374.
- Wang, X.; Hao, W.; Li, Q. An adaptive cultural algorithm with improved quantum-behaved particle swarm optimization for sonar image detection. Sci. Rep. 2017, 7, 17733.
- Yu, L. Analysis of 30 Cases of Matlab Intelligent Algorithm. Beihang University Press: Beijing, 2015.
- Mishra, P.; Woltering, E.; Harchioui, N.E. Improved prediction of 'Kent’ mango firmness during ripening by near-infrared spectroscopy supported by interval partial least square regression. Infrared Phys. Tech. 2020, 110, 103459.
- Ren, C.; An, N.; Wang, J.; Li, L.; Hu, B.; Shang, D. Optimal parameters selection for BP neural network based on particle swarm optimization: A case study of wind speed forecasting. Knowl-Based Syst. 2014, 56, 226–239.
- Kasemsumran, S.; Du, Y.P.; Maruo, K.; Ozaki, Y. Improvement of partial least squares models for in vitro and in vivo glucose quantifications by using near-infrared spectroscopy and searching combination moving window partial least squares. Chemometr. Intell. Lab. 2006, 82, 97–103.