
 ?Mathematical formulae have been encoded as MathML and are displayed in this HTML version using MathJax in order to improve their display. Uncheck the box to turn MathJax off. This feature requires Javascript. Click on a formula to zoom.
Abstract
This study focuses on the issue of uncontrollable debris generated by laser-matter interactions in high-power laser facilities, which significantly impairs operational efficiency. The maximum motion distance of debris, referred to as the safety distance, is a crucial parameter that this work investigates. Three prediction methods that utilize aerodynamic coefficients and trajectories are proposed, with input parameters derived from velocity curves extracted from high-resolution time-resolved images. The results obtained from these methods show good agreement with experimental data collected under laser fluence conditions ranging from 18 to 79 J/cm2 that damage the rear surface of fused silica. The analytically predicted safety distance, with an input velocity fitted at 0 ns and an upper diameter limit of 10 µm, was closest to the experimental result at 155 mm. Analytically predicted values with input velocities fitted at 13,000 ns and all diameter ranges did not exceed 192.3 mm. Numerically predicted values, with input velocity fitted at 13,000 ns and a median diameter of small debris (5 µm), were 140.4 and 295.2 mm for aspect ratios of 2 and 4, respectively. The numerical method is recommended for predicting the safety distance in high-power laser facilities, but obtaining accurate estimates of transient velocity is crucial for the method’s effectiveness.
1. Introduction
It has been reported that high-power laser facilities, such as the National Ignition Facility (NIF),[Citation1] Laser Megajoule (LMJ) Project,[Citation2] and other devices[Citation3] experience a significant decrease in operation flux and optics lifespan due to laser-induced debris pollution. This type of pollution arises from multiple causes, including direct thermal ablation of absorbing glass within the beam chambers[Citation4,Citation5] and the presence of organic contaminants introduced during device assembly or maintenance, which can act as a secondary source to sputter debris.[Citation6] Localized damage caused by self-focusing on the rear surface of optics can also contribute to this pollution.[Citation7] As improved post-processing methods, such as advanced surface treatment and manufacturing,[Citation8,Citation9] cannot mitigate these damages, identifying ways to reduce debris pollution is crucial.
Presently, various techniques have been employed to mitigate the contamination of laser-induced debris in the Final Optics Assembly (FOA). These methods include low-pressure plasma cleaning,[Citation10] ultrasonic cleaning with quick-drying,[Citation11] airflow cleaning and protection,[Citation12,Citation13] and self-cleaning based on microstructure,[Citation14] among others. These methods are classified based on the cleaning location, either in-situ (online) or ex-situ (offline). Ex-situ cleaning requires a complete process involving optics replacement, cleaning, inspection, reinstallation, and calibration, which entails significant manual operations and adds complexity to the enclosure design of beam tunnels.[Citation15] In contrast, in-situ cleaning is more straightforward and efficient since it is installed at the inception of the laser system. However, designing in-situ cleaning is a pre-emptive task that requires insights into the propagation behaviors of emitted debris. When debris moves linearly with hypervelocity, debris shields (DS) are typically pre-installed near optical components to prevent mechanical impacts.[Citation16,Citation17] Following long-term deceleration, applying a circularly laminar background flow at 0.3–0.5 m/s is a feasible solution for debris scattering in space.[Citation18,Citation19] Furthermore, localized air knives with speeds of 20–80 m/s can remove debris adhering to the surface of optical components, particularly debris with small diameters like aerosols, with minimal residual.[Citation4,Citation20] For debris with a tendency to settle, dust collection to alleviate secondary contamination is crucial. In such cases, a collector that includes dust charging and transporting is employed at the bottom of optical components.[Citation21,Citation22]
The propagation behavior of emitted debris dictates a distance within which a combination of in-situ methods, such as laminar and air knife flow, must be simultaneously applied.[Citation23] This increases the complexity of control systems and may lead to interference between different cleaning techniques. To streamline the in-situ cleaning procedure, it is advisable to furnish a more capacious internal region, given that the majority of detritus will ultimately suspend, adsorb, or undergo sedimentation subsequent to momentary deceleration as a result of interacting with the surrounding liquid media (e.g., decelerating by air drag). However, it should be noted that the construction of a pervasive internal space may lead to an increase in the size of the beampath enclosures, a distortion in the beam collimation, and a reduction in the conversion efficiency of the laser frequency during the process of transitioning from single to triple. Hence, it is imperative to ascertain the optimal distance between optical components and enhance the effectiveness of the cleaning process.
In theory, there exists a critical “safety distance” beyond which the incidence of laser-induced debris on the optical components is minimal and simple in-situ techniques can be utilized to maintain a high level of cleanliness, both on the surface and in the surrounding area. However, precisely determining this safety distance is challenging due to the variance in the physical properties of the debris, including its shape, diameter, and innate state. For instance, fused aerosols, which possess a diameter of <10 µm, undergo hypervelocity ejection while rapidly decelerating in the freestream.[Citation24,Citation25] Conversely, shrapnel, resulting from mechanical failure on the surface of a fused silica target, exhibits a flattened shape with a diameter ranging from tens of microns to several hundred microns and moves sluggishly.[Citation26,Citation27] Nonetheless, it is worth noting that this large debris can still exhibit long-range motion if the appropriate angle of attack (AoA), which refers to the angle between the initial airflow and the debris width, is present following the sputtering process.[Citation19,Citation28,Citation29]
Recent research endeavors have been dedicated to determining the critical “safety distance” via experimentation and modeling. Time-resolved imaging systems that utilize separate probe lights have been conducted to capture transient debris velocities, diameters, and launch times with great precision.[Citation30–32] For debris that exhibits the highest velocities and largest diameters, a longer attenuation distance can be obtained. To better understand the underlying movement patterns of debris, Peng et al.[Citation29] designed a horizontal plane debris sedimentation experiment and analyzed the percentage of debris counts in nine distinct regions within a 72 × 72 mm area. The results suggest that long-range debris movement is primarily parallel to the beamline. Additionally, Hu et al.[Citation33] employed a discrete phase model (DPM) based on air-debris interactions to independently calculate the maximum attenuation distance.
Despite several attempts, accurately determining the critical safety distance remains challenging. Firstly, the imaging system’s resolution is limited, making it difficult to accurately detect the transient characteristics of debris. Secondly, it is challenging to establish a correlation between the transient debris characteristics and their subsequent long-range movement. For instance, the relationships between debris diameters in various velocities and time delays are rarely observed, and there needs to be an indication of which diameter range and intermediate time delay can be utilized to predict the safety distance. Thirdly, the current calculations, such as those employed by Hu et al.,[Citation33] use preset ranges for initial velocities and diameters, which are detached from the dynamic behaviors of laser-induced debris and do not account for laser fluences. Additionally, only some calculations have succeeded in predicting the safety distance by forecasting debris trajectories,[Citation34] as the drag coefficient of debris cannot be directly tested in the wind tunnel due to its small size. Hence, a more precise method of predicting safety distance must be proposed.
This study employed a high-resolution time-resolved imaging system (0.72 µm/px) with a broad time delay range (from <100 to 12,000 ns) to observe the transient characteristics of laser-induced debris ejected from laser fluences ranging from 18 to 79 J/cm2, covering both breakdowns lower and higher than the damage threshold of pure fused silica. Through analyzing the transient characteristics of debris at different time delays, their aerodynamic motion behaviors were obtained, and the safety distance was calculated accordingly. For debris ejected at 0 ns with small diameters (<10 µm) and hypervelocity, an analytical calculation based on the classical air-drag coefficient formula was used. For debris ejected at 13,000 ns with a range of diameters and attenuated velocities, a similar analytical calculation and a numerical calculation with predicted varying drag coefficients in different initial angles of attack based on the debris actual shapes were employed. Additionally, with a dichotomous method, the calculated safety distance was verified by analyzing debris numbers using particle counters.
2. Experimental arrangement
2.1. Time-resolved imaging for capturing initial characteristics of debris
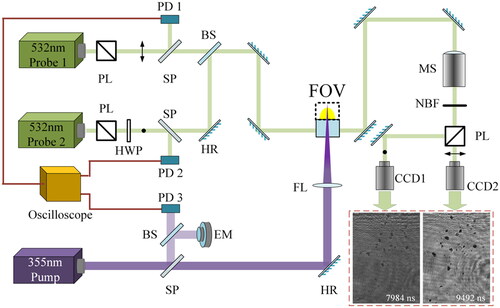
showcases a time-resolved microscope system with temporal resolution ranging from tens of nanoseconds to over ten microseconds, and a maximum spatial resolution of 0.72 µm/pix and a field of view of 2.4 × 3.4 mm2, which is designed to capture the initial properties of debris after a laser-induced breakdown event. In this system, an Nd: YAG laser with a pulse duration of ∼12 ns (measured as the full width at half maximum, FWHM) was employed as the pump, operating at a wavelength of 355 nm. The pump beam was directed onto the rear surface of the target (JGS1 fused silica, 50 × 50 mm2 front area, 5 mm thickness) using a convex lens with a 150 mm focal length, causing damage. By modulating the power of the pump, a Gaussian-shaped laser spot with a diameter of about 0.6 mm was generated on the surface, inducing damage from fluences of 18–79 J/cm2. The initiation of damage had an estimated probability of 85%. To capture a transient image with a consistent timeline, a second Nd: YAG laser (Probe 1) operating at 532 nm with an FWHM of ∼9 ns was employed to illuminate the background with a series of time delays (controlled by a DG645 digital delay generator), and it was synchronized with the pump laser (the timing error was <10%). The images were eventually captured by a CCD camera whose field of view was perpendicular to the target surface. Additionally, a third Nd: YAG laser (Probe 2, with the same parameters as Probe 1) was utilized with an orthogonal direction to capture transient characteristics of debris at an adjacent time interval. The time interval between Probe 1 and Probe 2 was adapted to the movement characteristics that debris could potentially exhibit following a laser-induced breakdown event.
Figure 1. Schematic of time-resolved imaging for capturing transient debris. PD: photon detector, PL: polarized lens, SP: sampler, HWP: half-wave plate, BS: beam splitter, FL: focus lens, NBF: narrowband filter, MS: microscope, HR: high reflector, EM: energy meter, FOV: field of view.
2.2. Verification of the safety distance
Since debris resulting from laser-induced breakdown events is propelled perpendicularly to the target surface,[Citation35–37] situating detectors along its trajectory is rational. One straightforward technique involves employing particle counters positioned under the flight path to quantify the quantity of falling debris. Since this quantity reflects the likelihood of debris moving toward these positions, the safety distance can be determined incrementally.
The laser parameter employed to cause surface damage in fused silica corresponds to that described in section 2.1. Additionally, a sequence of particle counters (TSI AeroTrak 9310, with a flow rate of 28.3 L/min and a sensitivity of 0.3 µm) were systematically arranged with their nozzles located in close proximity to the bottom, as depicted in . The centers of the nozzles were aligned and maintained parallel to the laser beam by adjusting a 3D platform. Furthermore, the vertical distance between the laser spot (on the rear surface of the target) and the bottom was consistently maintained at 20 mm.
Figure 2. Experimental verification of the safety distance of laser-induced debris.
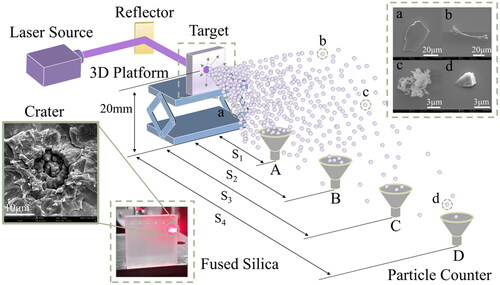
Using a dichotomy method, the safety distance is determined as follows: A and D nozzles are located before and after the predicted position of the “maximum distance,” which was numerically or analytically estimated. If debris is detected at nozzle A but not at nozzle D, nozzle C is placed in the middle. If nozzle C also fails to collect debris, another nozzle, B, is positioned, and the process is repeated until no additional debris is collected. Assuming that nozzle B does not detect any debris, S2 is deemed the maximum distance, as an illustration.
In this experiment, a single-shot pulse with a specific laser fluence ranging from 18 to 79 J/cm2 was applied only once to each pristine region on the rear surface of fused silica. To ensure accuracy, each laser fluence was repeated three times. The whole experiment was conducted in a clean room and all operations were performed nearly dust-free. Before each pulse, a Fan Filter Unit providing vertically laminar flows at an average speed of ∼0.42 m/s was used to maintain a clean level above the nozzles of at least Class 100 (as same as that in the beam chamber of high-power laser facilities, such as SG series[Citation38]), as monitored by other particle counters (Beckman Coulter’s MET ONE 6000). Moreover, by incorporating TSI AeroTrak 9310, the placement of these particle counters facilitates the measurement of debris quantity at any position located behind the fused silica target.
3. Prediction methods
Through the analysis of the initial characteristics of debris following a laser-induced breakdown, pertinent parameters can be extracted to develop aerodynamic models that describe the trajectory and predict long-range movement. Previous research[Citation39] indicates that the debris diameter and incident velocity (Reynolds number) are fundamental factors in determining their flight, and these parameters will be the primary focus of our study. In addition, different prediction models will be selected based on the debris velocities at various time delays, as this reflects the changing tendency of the surrounding atmosphere, which affects the accuracy of the prediction.
3.1. Numerical prediction
For debris that moves at a later time delay, a proper method is to predict their long-range movement by calculating drag and lift coefficients. These coefficients are based on the actual characteristics of the debris, such as shape, diameter, velocity, and orientation with respect to the airflow, also known as the angle of attack (AOA).
3.1.1. Aerodynamic coefficient model
Compared to the background space, a debris particle, ranging from a few microns to several hundred, occupies a relatively small volume and can be regarded as an individual entity traveling through a remote region (far field). When no other debris particles are present to interfere, a Shear Stress Transport (SST) model can be constructed by integrating the near-wall properties of the k-ω model, which accounts for friction and pressure gradient, with the excellent free-stream behavior of the k-ε model, which ensures far-field consistency. The SST model can be expressed as follows:[Citation40]
(1)
(1)
(2)
(2)
where the variables k and ω represent turbulent properties related to kinetic energy and specific dissipation rate, respectively. The equation also includes time (t), velocity (u), air density (ρ), dynamic viscosity (µ), turbulent viscosity (µT), and various model constants that are determined through interpolation of appropriate inner and outer values. The far-field condition with respect to k and ω, which is near the boundary, is expressed using the equation provided:
(3)
(3)
(4)
(4)
where L denotes the length of the boundary, U∞ represents the free stream velocity, and ReL is the Reynold number calculated on the boundary. In this study, the decaying Reynolds numbers were used as independent variables to calculate drag and lift coefficients based on time-resolved images. Furthermore, the initial launch state of debris (AoA) was considered.
3.1.2. Debris trajectory model
As depicted in , a debris particle experiences three forces while in flight: gravity (Fg), drag (FD, opposite to velocity), and lift (FL, perpendicular to the drag). If auto-rotation (S) occurs, the Magnus force also comes into play. Consequently, the equilibrium equation of the debris can be represented using Newton’s second law:[Citation34]
(5)
(5)
(6)
(6)
where m is the debris mass, I is the moment of inertia, S is the translation distance vector (combined longitudinal distance x with transverse distance y), θ is the rotation angle vector, and F and M are the total forces and moments acting on the debris. Both the drag and lift have the following forms,[Citation41]
(7)
(7)
Figure 3. Forces on a debris particle during flying after a laser-induced breakdown.
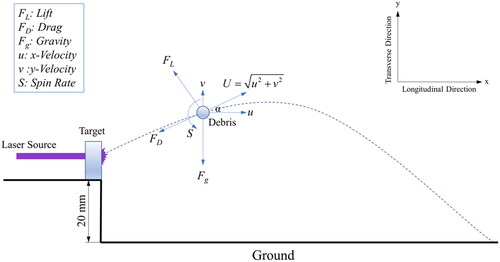
The variables include air density, projection area perpendicular to the airflow, and longitudinal and transverse velocities represented by symbols ρ, A, u, and v, respectively. Additionally, the drag and lift coefficients CD and CL are also significant. Since the spin rate of the debris [S = ωdp/2U, referred to diameter (dp), angular velocity (ω), and translation velocity (U)] is small, the rotation is neglected or assumed to have minimal impact. The trajectory equations are then given by EquationEquations (8)(8)
(8) and Equation(9)
(9)
(9) :
(8)
(8)
(9)
(9)
where α = arctan(U) is the incident angle.
3.2. Analytical prediction
In addition to numerical calculations based on the actual properties of debris, we also aim to determine a safety distance quickly. To achieve this, we can use a standard spherical model that relies on classic experimental data and correlations for the drag coefficient. In this case, we can ignore the contribution of the lift coefficient to EquationEquations (8)(8)
(8) and Equation(9)
(9)
(9) , and the prediction is simplified. Additionally, we can connect this method to different input velocities at various time delays (which represent situations suffered from different ambient propulsions).
The drag-decelerating equation in the longitudinal direction can be expressed as:[Citation42]
(10)
(10)
where ρg is the air density, and vg and vp represent the velocities of debris and air, respectively. The debris experience various drag zones, such as Newton (500 < Re < 2 × 10⁵), Allen (1 < Re < 500), and Stokes (10−4 < Re < 1), during the deceleration process, each with distinct coefficient expressions as follows:[Citation42]
(11)
(11)
The extent to which the debris can move is determined by the cumulative distance it traverses through the distinct drag zones. Therefore, by integrating EquationEquation (10)(10)
(10) , the total distance (X) can be calculated by summing up the distances covered in each zone (represented as X1, X2, and X3),
(12)
(12)
where, µg denotes the dynamic viscosity of air, ρp represents the density of the debris, and V and V0 are the respective upper and lower velocities in each zone. It is worth noting that the Cunningham correction, which accounts for the mean free path of small debris (<10 µm) and reduces the drag force in reality, has not been incorporated in EquationEquation (12)
(12)
(12) when Re < 1. This is because the correction factors are too trivial to impact X3 (which remains around 1.1 for debris diameter between 1 and 10 µm).
4. Results and discussion
4.1. Initial characteristics of laser-induced debris
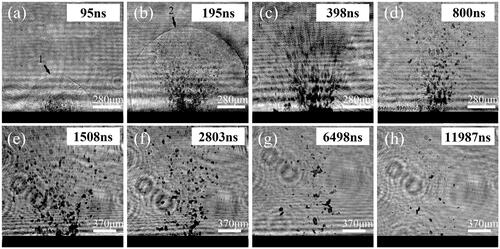
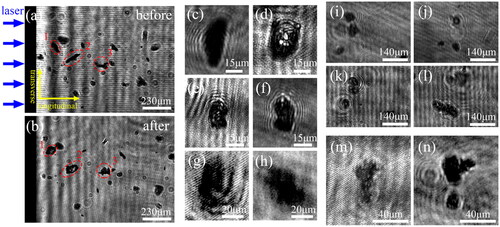
displays the spatial sputtering that occurs in laser-induced debris at varying time delays. The sputtering activity transpires from the bottom and progresses upward. During early time delays, the debris expands from a flat configuration to a conical shell pattern, with most debris preceded by a shockwave. At 398 ns, large debris with a diameter of ∼100 µm is discernible close to the damaged surface. As the time delay increases, the number of debris decreases, and the lateral movement becomes more evident while the scattering shape remains stable. At later time delays, the observed debris transforms into flakes and chips with large aspect ratios. The quantity of debris also experiences a significant reduction and debris with a diameter of <10 µm are scarcely detected. Based on these observations, it can be inferred that (1) laser-induced debris moves with longitudinal and transverse velocities that vary with time delays, (2) the debris emission occurs primarily in a vertical direction, and (3) shockwaves exert a limited influence on the movement of debris.
Figure 4. Spatial sputtering of laser-induced debris at different time delays by time-resolved imaging.
The transient behavior of debris can be analyzed by comparing two successive images captured at different time intervals. showcases various types of transient characteristics, including rolling, as demonstrated in (c)–(d) and (e)–(f); rotation, as shown in (g)–(h); longitudinal motion, displayed in (i)–(j); transverse motion, depicted in (k)–(l); and decomposition, presented in (m)–(n). The translational and angular velocities can be determined from the translation, rolling, and rotation of the debris. However, the accuracy of the calculated rotation angle is still being determined due to the ambiguity in the direction and period of rotation. Moreover, angular velocity plays a significant role in promoting lift, but unlike drag, it does not substantially impact the debris fate during long-distance movements. Therefore, only the translational velocity of the debris is extracted from the transient characteristics.
Figure 5. Transient characteristics of laser-induced debris acquired by comparing two successive images at different time delays. (a) vs. (b), (i) vs. (j), and (k) vs. (l) at 3982–5504 ns, (c) vs. (d), and (e) vs. (f) at 3985–5997 ns, (g) vs. (h), and (m) vs. (n) at 5987–7495 ns.
depicts a plot of the longitudinal and transverse velocities of laser-induced debris at different time delays against their diameters. The longitudinal velocity ranges from tens of meters per second to over 1.1 km/s, with high-speed debris having diameters below 30 µm being primarily ejected between 500 and 1000 ns. The smaller the diameter, the greater the velocity. Conversely, low-speed debris with diameters ranging from tens of microns to over 100 were generally ejected after 7000 ns. The upper and lower limits of velocity are governed by the linear function a and b. The transverse velocity ranges from 0 to 0.48 km/s, with high-speed debris ejected at 500–1000 ns and low-speed debris ejected after 4000 ns, with velocities <130 m/s and diameters ranging from a few microns to over one hundred microns. The upper limit of velocity is determined by the quadratic function a and b, with the “–” representing the opposite direction. Since the functions in the opposite directions are symmetrical at different time delays, the transverse velocity is likely isotropic, and gravity has less of an impact on the transverse velocity of debris during their transient flight.
Figure 6. Longitudinal and transverse velocity of laser-induced debris vs. their diameter at different time delays.
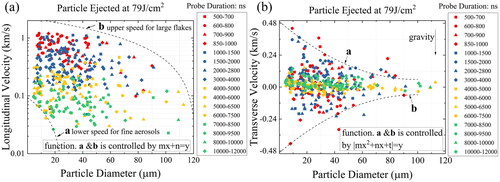
Comparing these results shows that the longitudinal velocity is significantly greater than the transverse velocity, and its gradients vary greatly. All debris are born with longitudinal velocity, whereas for transverse velocity, some are born without it.
The relationship between the translational velocity and the debris diameter during transient flight can be determined by analyzing the data at different time delays ranging from 500 to 12,000 ns. A noteworthy finding is that the velocity of the debris decreases over time, and this trend varies depending on the diameter range, i.e., <10, 10–20, 20–30, 30–40, 40–50, and >50 µm. To further reveal the flight patterns, we extracted the discrete data of debris longitudinal and transverse velocities as a function of delay time and plotted them in . They are fitted with an exponential decay function expressed as a red and blue line, respectively:
(13)
(13)
where, y0, A1, x0, and t1 are constants of the fitted curves independent of any physical variables.
Figure 7. Longitudinal and transverse velocity vs. delay time based on debris diameter: <10, 10–20, 20–30, 30–40, 40–50, and >50 μm, respectively. The fitted curve in red and blue represents longitudinal and transverse velocity, respectively.
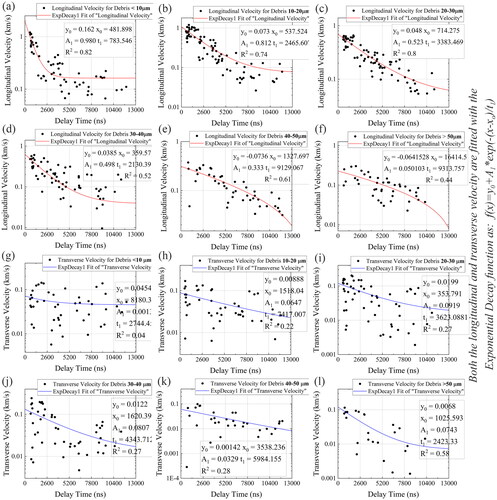
Extrapolating these functions allows one to determine the initial velocity at 0 ns and the subsequent velocity at later time delays. When considering the longitudinal velocity starting at 0 ns, the velocity magnitude is inversely proportional to the debris diameter. Debris with diameters <10 µm has the maximum velocity (about 2 km/s), while debris with diameters >50 µm has the minimum velocity (about 250 m/s). Furthermore, there are two trends of the fitted curves based on y0. The first is a gradual slowdown with time delays, where y0 > 0, for those depicted in , and the second is a smooth decline followed by a sharp drop, where y0 < 0, for those displayed in . The former is observed for debris with diameters <40 µm, while the latter is observed for large debris with diameters >40 µm. As time delays increase, the decelerating trends of debris with diameters <40 µm successively become flat, especially for debris with diameters <10 µm, whose decelerating gradients are the greatest within 0–2600 ns. This phenomenon indicates that small debris with diameters <10 µm tends to decelerate more easily in the early stage. This may be due to the backward propulsion caused by changes in air density and electrostatic forces:[Citation43] after laser-induced explosions, a compressive wave is formed due to the gradient difference between the ahead shockwave and the sluggish rarefaction, causing the surrounding air to be pushed toward the target surface. After 10,400 ns, the deceleration for debris >40 µm becomes sharp, possibly indicating their limited moving distance in the longitudinal direction.
Regarding the transverse velocity, the decelerating trends do not exhibit consistent changes based on the diameters of the debris. This is possibly due to many debris having uncertain velocities in the time domain, as their origin can be attributed to random radial damages caused by anisotropic mechanical failures. Moreover, the transverse velocity magnitude at 0 ns is notably lower than the longitudinal velocity, and the values remain nearly identical (around 100 m/s) for debris of all diameters.
4.2. Safety distances calculated with velocities at 13,000 ns
The longitudinal velocity results in the initial stage (0–13,000 ns) demonstrate that most laser-induced debris will gradually stabilize after experiencing rapid deceleration. This indicates that coupling interferences during their flight will decrease at later time delays. Moreover, the translational distance in the longitudinal direction during this period cannot exceed 3.8 mm (by integrating the fitted curves from ). This distance is relatively short compared to their subsequent long-range movement. In fact, some researchers have certified that the ejection process near the damage site only lasts for around 10 µs.[Citation43] Thus, considering these features, it is reasonable to deduce that debris movement after a later time delay will be solely subject to air drag, and the prediction with velocities at 13,000 ns will follow aerodynamics.
4.2.1. Analytical calculation
By utilizing a fitted longitudinal velocity at 13,000 ns with a specified diameter range as the first input parameter in the drag-decelerating EquationEquation (10)(10)
(10) , it is possible to calculate the safety distance. illustrates the outcomes calculated for different diameter ranges of debris (taken from the median). Under these circumstances, the maximum distance is 192.3 mm when the diameter is >50 µm (75 µm), and the input velocity is 8.1 m/s. It should be noted that the safety distance predicted in this manner is proportional to the debris diameter when the input velocity is held constant. Therefore, the safety distance can reach several hundred millimeters as the diameter approaches the limit (several hundred microns). However, as depicted in , the transient deceleration trend of debris >40 µm continues to grow sharply after 10,400 ns, causing this prediction to deviate from the physical phenomenon. Hence, considering these factors, a proper evaluation would place the safety distance at around 141.9 mm when the debris diameter ranges from 30 to 40 µm.
Table 1. Maximum distance calculated by EquationEquations (10)–(12) with different diameters of debris using input velocities extrapolated at 13,000 ns.
4.2.2. Numerical calculation
Previous investigations into the longitudinal propagation and distribution of laser-induced sputtering found that debris with smaller diameters have a higher potential for long-range movement.[Citation29,Citation44] This outcome can be directly obtained in this study by determining the number of debris located longitudinally at any position. displays the number of debris with a diameter of <10 µm at a distance of 75 mm from the rear surface of the target, with an incident laser fluence of 79 J/cm2. It is evident that the debris number is inversely proportional to their diameter. Consequently, small debris with diameters <10 µm can serve as a viable option for predicting the safety distance.
Table 2. Number of debris collected at 75 mm in the longitudinal direction under the fluence of 79 J/cm2 unit: pcs.
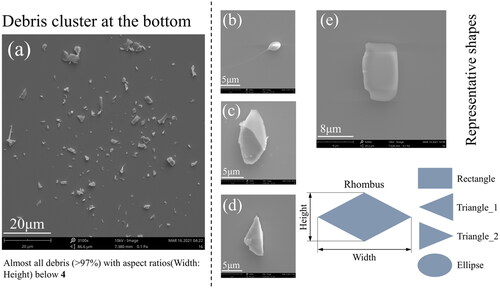
In , an SEM image displays a cluster consisting predominantly of small debris (<10 µm) sampled at 75 mm in the longitudinal direction. These debris exhibit mostly non-spherical shapes and possess sharp edges, indicating their mechanical failure origin.[Citation26,Citation45–47] However, some debris have melting traces near their edges, suggesting that their inborn state may also be attributed to heat fusion. As a result of this observation, debris shapes may comprise spheres (resulting from fusion pools) and polygons (resulting from cracks). Notably, the debris aspect ratio [width (the longest chord) vs. height] is typically <4, although a few pieces of debris with a high aspect ratio, such as the long strip of debris, can be found. The shapes of debris with far-moving capability can be represented by ellipses, rhombuses, triangles, and rectangles, as shown in , respectively, as long as the longest chord remains constant.
Figure 8. A scattered cluster (a) composed almost of small debris is sampled at 75 mm from the rear surface of the target. Representative debris shapes: ellipse (b), rhombus (c), triangle (d), and rectangle (e).
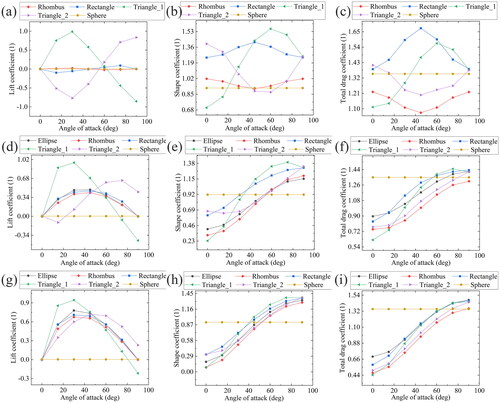
The numerical calculation of total drag and lift coefficients for debris of various shapes (with a fixed width of 5 µm) based on EquationEquations (1)–(4) was conducted, taking into account the pressure stress (perpendicular to the debris contour) and friction (tangential to the debris contour). depict the correlation between coefficients and AoA for aspect ratios of 1, 2, and 4, respectively. Generally, the drag coefficient decreases, and the lift coefficient increases as the aspect ratio increases. Additionally, debris shapes with lower drag coefficients and higher lift coefficients are more prevalent than those of a standard sphere (indicated in yellow). These findings suggest that debris with large aspect ratios and non-spherical shapes are more likely to travel a longer distance. Moreover, the rhombus-shaped debris has a minimal drag coefficient in almost all cases (except for AoA at 0 and 30°), indicating the greatest ability to fly farther. In contrast, debris with a rectangular shape has the maximum drag coefficient, indicating their limited flying capability, although the coefficient gradually decreases with increasing aspect ratios (still mostly less than a standard sphere). To determine the upper and lower distances (trajectories) in the longitudinal direction, the coefficients with declining velocities (Reynolds numbers) in the two extreme conditions should be entered into EquationEquations (8)(8)
(8) and Equation(9)
(9)
(9) . As the drag plays the most significant role in the distance calculation, we take the maximum drag (initial = 1.67, rectangle, when aspect ratio = 1, AoA = 45°) and the associated lift (initial = 0.0029) into equations, where x = 22.2 mm. Similarly, the minimum drag (initial = 0.44, triangle_1, when aspect ratio = 4, AoA = 0) and the associated lift (0.0002) are taken into equations, x equals 53.1 mm. The results are in good agreement with our previous research, which shows that small debris (<10 µm) from laser-induced explosions are primarily located between 24 and 48 mm in the longitudinal direction when the incident fluence is 79 J/cm2.[Citation29]
Figure 9. Debris lift, shape, and total drag coefficients vs. angle of attack within different shapes. (a)–(c), (d)–(f), and (g)–(i) are the results provided with aspect ratios 1, 2, and 4, respectively.
The results obtained demonstrate the validity of the numerical trajectory model, which utilizes the transient motion parameter (velocity) and the debris trajectory model (using drag and lift coefficients with declining velocities) to accurately predict the fate of laser-induced debris, thus making it a suitable approach for predicting the maximum motion distance (safety distance). It should be noted that to obtain the theoretical value of the safety distance, the friction between debris and air must be disregarded at this stage, and only the shape coefficient should be considered. Consequently, the minimum drag coefficient will decrease further, resulting in the determination of the safety distance. Notably, the trends of the drag and lift coefficients vs. AoA (which are not displayed) remain constant, and the relationships between different shapes remain largely unchanged even when friction is ignored. The triangle_1 shape still exhibits the minimum drag coefficient with an AoA of 0°. By utilizing the minimal drag (initial = 0.23 and 0.08) and the corresponding lift (initial = −0.035 and 0.0003) for aspect ratios of 2 and 4, respectively, in EquationEquations (8)(8)
(8) and Equation(9)
(9)
(9) , the safety distances are determined to be 140.4 and 295.2 mm.
4.3. Safety distances calculated with velocities at 0 ns
At the onset of sputtering, the velocity of debris is fitted at 0 ns, signifying that their movement will be hampered by several factors, such as thermal gradients and anti-propulsion forces from shock waves. Consequently, aerodynamic models may not accurately predict debris moving behavior. However, for high-velocity debris with solid potential for long-range movement, aerodynamic models can still be used. For small debris (<10 µm) with high kinetic energy, an analytical calculation can be made by utilizing the longitudinal velocity at 0 ns obtained from the fitted curve in and incorporating it into EquationEquation (12)(12)
(12) to estimate the safety distance. Previous studies have shown that the transient velocity close to 0 ns is typically around 1–3 km/s in magnitude.[Citation24,Citation48] For instance, researchers from Lawrence Livermore National Laboratory[Citation43,Citation46,Citation49,Citation50] observed that the fastest laser-induced fused silica debris (below 5 µm in diameter) traveled at a speed of about 2 km/s recorded at 100 ns when the laser fluence was above 50 J/cm2. Moreover, the Research Center of Laser Fusion in China determined that the maximum velocity of silicon debris in the Final Optics Assembly is about 2 km/s.[Citation4] These studies validate the reliability of the longitudinal velocity fitted at 0 ns (1.96 km/s) in this research. Therefore, it is reasonable to consider this value as an input parameter. The second input parameter is the upper limit of debris diameter, 10 µm. As a result, the safety distance of 153.3 mm can be determined.
4.4. Measured value
depicts the longitudinal debris numbers recorded by particle counters at distances of 100 and 155 mm during laser exposure at a fluence of 79 J/cm2. presents the impact of laser fluence (53 and 79 J/cm2) on debris number at a longitudinal distance of 155 mm. By amalgamating these findings with those in , it can be inferred that the safety distance for laser-induced debris is ∼155 mm, as evidenced by the negligible debris numbers observed at this distance, irrespective of the laser fluence employed. This assertion is also supported by the minimal discrepancy in debris numbers before and after each shot.
Table 3. Number of debris longitudinally collected at 100 and 155 mm under the fluence of 79 J/cm2 unit: pcs.
Table 4. Number of debris longitudinally collected at 155 mm under the fluence of 53 and 79 J/cm2 unit: pcs.
5. Conclusion
This study evaluates the safety distance required after a laser-induced breakdown event. The debris longitudinal velocity, observed at time delays of 0 and 13,000 ns, serves as the link between their transient motion behaviors and subsequent long-range movements. Analytical and numerical methods, utilizing different algorithms of drag coefficients, can be adopted to make predictions as follows:
The analytically predicted value, with an input velocity matched at 0 ns (1.96 km/s) and an upper diameter limit of 10 µm, is 153.3 mm, which is the most precise approximation to the experimental measurement. Although there are some coincidences, using analytical equations to estimate the safety distance based on the initial velocities of small debris is undoubtedly a simple and speedy method.
Other analytically predicted values, with input velocities matched at 13,000 ns and for all diameter ranges, do not exceed 192.3 mm. Since these predictions are proportionate to the debris diameter and using large debris to predict the safety distance is contrary to reality, it is only recommended to employ this method once the diameter range is explicitly defined.
The numerically predicted values, with an input velocity matched at 13,000 ns (162 m/s) and a median diameter of small debris (5 µm), are 140.4 and 295.2 mm (with aspect ratios of 2 and 4, respectively). This is an applicable method that accurately reflects the reality of laser-induced breakdown events in the FOA, as the drag and lift coefficients are calculated from the debris’ real shapes and their underlying launch states. Similar predictions utilizing this method may be made for different optics materials in the future.
Author contributions
Methodology: Jiaxuan Chen and Lihua Lu; project administration: Chengyu Zhu; software: Lingxi Liang; supervision: Peng Zhang; visualization: Zhe Dong; writing—original draft: Ge Peng; writing—review and editing: Qiang Gao.
Acknowledgments
We would like to acknowledge Mr. Lingxi Liang, Prof. Chengyu Zhu from the School of Astronautics, Harbin Institute of Technology, for the experiment support and simulation conversations, as well as Dr. Xuchu Wang for the text correction.
Disclosure statement
No potential conflict of interest was reported by the author(s).
Data availability statement
Data underlying the results presented in this paper is not publicly available at this time but may be obtained from the authors upon reasonable request.
Additional information
Funding
References
- Casey, D.T.; MacGowan, B.J.; Sater, J.D.; Zylstra, A.B.; Landen, O.L.; Milovich, J.; Hurricane, O.A.; Kritcher, A.L.; Hohenberger, M.; Baker, K.; et al. Evidence of three-dimensional asymmetries seeded by high-density carbon-ablator nonuniformity in experiments at the national ignition facility. Phys. Rev. Lett. 2021, 126, 025002. DOI: 10.1103/PhysRevLett.126.025002.
- Fleurot, N.; Cavailler, C.; Bourgade, J.L. The laser megajoule (LMJ) project dedicated to inertial confinement fusion: development and construction status. Fusion Eng. Des. 2005, 74, 147–154. DOI: 10.1016/j.fusengdes.2005.06.251.
- Yu, H.; Jing, F.; Wei, X.; Zheng, W.; Zhang, X.; Sui, Z.; Yuan, X. Status of prototype of SG-III high-power solid-state laser. In XVII International Symposium on Gas Flow, Chemical Lasers, and High-Power Lasers, April; SPIE, 2009; Vol. 7131, pp. 284–289.
- Zhu, D.; Li, P.; Chai, X.; Feng, B.; Peng, Z. General design and experiment for separated final optics assembly on high energy laser system. Opt. Laser Technol. 2020, 128, 106213. DOI: 10.1016/j.optlastec.2020.106213.
- Stolz, C.J.; Qiu, S.R.; Negres, R.A.; Bass, I.L.; Miller, P.E.; Cross, D.A.; Wegner, P.J. Transport mirror laser damage mitigation technologies on the national ignition facility. In Advances in Optical Thin Films VI, June; SPIE, 2018; Vol. 10691, pp. 82–93. DOI: 10.1117/12.2323284.
- Bude, J.; Carr, C.W.; Miller, P.E.; Parham, T.; Whitman, P.; Monticelli, M.; Raman, R.; Cross, D.; Welday, B.; Ravizza, F.; et al. Particle damage sources for fused silica optics and their mitigation on high energy laser systems. Opt. Express 2017, 25, 11414–11435. DOI: 10.1364/OE.25.011414.
- Bercegol, H.; Lamaignere, L.; Le Garrec, B.; Loiseau, M.; Volto, P. Self-focusing and rear surface damage in a fused silica window at 1064 nm and 355 nm. In Laser-Induced Damage in Optical Materials: 2002 and 7th International Workshop on Laser Beam and Optics Characterization, May; SPIE, 2003; Vol. 4932, pp. 276–285. DOI: 10.1117/12.472374.
- Ding, W.; Chen, M.; Cheng, J.; Liu, H.; Zhao, L.; Yang, H.; Cheng, X.; Liu, Z.; Xu, Q.; Tan, C. Laser damage evolution by defects on diamond fly-cutting KDP surfaces. Int. J. Mech. Sci. 2023, 237, 107794. DOI: 10.1016/j.ijmecsci.2022.107794.
- Ding, W.; Cheng, J.; Zhao, L.; Wang, Z.; Yang, H.; Liu, Z.; Xu, Q.; Wang, J.; Geng, F.; Chen, M. Determination of intrinsic defects of functional KDP crystals with flawed surfaces and their effect on the optical properties. Nanoscale 2022, 14, 10041–10050. DOI: 10.1039/d2nr01862d.
- Li, Y.; Bai, Q.; Guan, Y.; Zhang, P.; Shen, R.; Lu, L.; Liu, H.; Yuan, X.; Miao, X.; Han, W.; Yao, C. In situ plasma cleaning of large-aperture optical components in ICF. Nucl. Fusion 2022, 62, 076023. DOI: 10.1088/1741-4326/ac555c.
- Pryatel, J.A.; Gourdin, W.H.; Frieders, S.C.; Ruble, G.S.; Monticelli, M. V. Cleaning practices and facilities for the national ignition facility (NIF). In Laser-Induced Damage in Optical Materials: 2014, October; SPIE, 2014; Vol. 9237, pp. 390–410. DOI: 10.1117/12.2075927.
- Gourdin, W.H.; Dzenitis, E.G.; Martin, D.A.; Listiyo, K.; Sherman, G.A.; Kent, W.H.; Pryatel, J.A. In situ surface debris inspection and removal system for upward-facing transport mirrors of the national ignition facility. In Laser-Induced Damage in Optical Materials: 2004, February; SPIE, 2005; Vol. 5647, pp. 107–119. DOI: 10.1117/12.585077.
- Peng, G.; Gao, Q.; Dong, Z.; Chen, J.; Zhang, P.; Lu, L. Low-speed gas knife protection for the large aperture optical component in high-power laser systems. Front. Phys. 2023, 11, 1061541. DOI: 10.3389/fphy.2023.1061541.
- Yue, G.; Wang, Y.; Li, D.; Hou, L.; Cui, Z.; Li, Q.; Wang, N.; Zhao, Y. Bioinspired surface with special wettability for liquid transportation and separation. Sustain. Mater. Technol. 2020, 25, e00175. DOI: 10.1016/j.susmat.2020.e00175.
- Larson, D.W. NIF laser line-replaceable units (LRUs). In Optical Engineering at the Lawrence Livermore National Laboratory II: The National Ignition Facility, May; SPIE, 2004; Vol. 5341, pp. 127–136.
- Carr, C.W.; Bude, J.; Miller, P.E.; Parham, T.; Whitman, P.; Monticelli, M.; Sommer, S. Damage sources for the NIF grating debris shield (GDS) and methods for their mitigation. In Laser-Induced Damage in Optical Materials 2017, November; SPIE, 2017; Vol. 10447, p. 1044702.
- Zhu, C.; Liang, L.; Peng, G.; Yuan, H.; Zhou, L.; Li, Y.; Zhang, L.; Lu, L. Explosion plume on the exit surface of fused silica during UV laser-induced damage. Results Phys. 2022, 32, 105094. DOI: 10.1016/j.rinp.2021.105094.
- Cheng, X.; Miao, X.; Wang, H.; Qin, L.; Ye, Y.; He, Q.; Ma, Z.; Zhao, L.; He, S. Surface contaminant control technologies to improve laser damage resistance of optics. Adv. Condens. Matter Phys. 2014, 2014, 1–7. DOI: 10.1155/2014/974245.
- Peng, G.; Gao, Q.; Dong, Z.; Liang, L.; Chen, J.; Zhu, C.; Zhang, P.; Lu, L. Surface cleanliness maintenance with laminar flow based on the characteristics of laser-induced sputtering particles in high-power laser systems. Micromachines 2023, 14, 598. DOI: 10.3390/mi14030598.
- Hu, S.; Shang, Q.; Zhang, P.; Chen, J.; Zhang, F.; Miao, X. Study of airflow regime upon optic inside frequency multiplying device and achievement of cleaning technique. Optik 2021, 240, 166777. DOI: 10.1016/j.ijleo.2021.166777.
- Choi, B.S.; Fletcher, C.A.J. Computation of particle transport in an electrostatic precipitator. J. Electrostat. 1997, 40–41, 413–418. DOI: 10.1016/S0304-3886(97)00080-6.
- Onozuka, M.; Ueda, Y.; Oda, Y.; Takahashi, K.; Seki, Y.; Aoki, I.; Ueda, S.; Kurihara, R. Development of dust removal system using static electricity for fusion experimental reactors. J. Nucl. Sci. Technol. 1997, 34, 1031–1038. DOI: 10.1080/18811248.1997.9733785.
- Peng, G.; Chen, J.; Lu, L.; Miao, X.; Dong, Z.; Leng, D. Dual dynamic airflow protection for the removal of fused silica micron particles in the final optics assembly. Aerosol Sci. Technol. 2020, 54, 342–352. DOI: 10.1080/02786826.2019.1699645.
- Shen, C.; Cheng, X.; Xu, Z.; Wei, K.; Jiang, T. Observation of particle ejection behavior following laser-induced breakdown on the rear surface of a sodium chloride optical window. Opt. Eng. 2016, 56, 011009. DOI: 10.1117/1.OE.56.1.011009.
- Feigenbaum, E.; Nielsen, N.; Matthews, M.J. Measurement of optical scattered power from laser-induced shallow pits on silica. Appl. Opt. 2015, 54, 8554–8560. DOI: 10.1364/AO.54.008554.
- Demos, S.G.; Negres, R.A. Morphology of ejected particles and impact sites on intercepting substrates following exit-surface laser damage with nanosecond pulses in silica. Opt. Eng. 2016, 56, 011016. DOI: 10.1117/1.OE.56.1.011016.
- Raman, R.N.; Negres, R.A.; DeMange, P.; Demos, S.G. Time-resolved imaging of material response following laser-induced breakdown in the bulk and surface of fused silica. In High Energy/Average Power Lasers and Intense Beam Applicatio ns IV, February; SPIE, 2010; Vol. 7581, pp. 101–111. DOI: 10.1117/12.842301.
- Dong, Z.; Yan, Y.; Peng, G.; Li, C.; Geng, Y. Effects of sandwiched film thickness and cutting tool water contact angle on the processing outcomes in nanoskiving of nanowires. Materials & Design 2023, 225, 111438 10.1016/j.matdes.2022.111438.
- Peng, G.; Zhang, P.; Dong, Z.; Chen, J.; Liang, L.; Zhu, C.; Gao, Q.; Lu, L. Spatial sputtering of fused silica after a laser-induced exploding caused by a 355 nm Nd: YAG Laser. Front. Phys. 2022, 10, 980249. DOI: 10.3389/fphy.2022.980249.
- Tran, K.A.; Grigorov, Y.V.; Nguyen, V.H.; Rehman, Z.U.; Le, N.T.; Janulewicz, K.A. Time-resolved shadowgraphy of optical breakdown in fused silica. In Pacific Rim Laser Damage 2015: Optical Materials for High-Power Lasers, July; SPIE, 2015; Vol. 9532, p. 953205. DOI: 10.1117/12.2185910.
- Papazoglou, D. G.; Karaiskou, A.; Zergioti, I.; Fotakis, C. Shadowgraphic imaging of the sub-ps laser-induced forward transfer process. Appl. Phys. Lett. 2002, 81, 1594–1596. DOI: 10.1063/1.1497191.
- Raman, R. N.; Negres, R. A.; Demos, S. G. Time-resolved microscope system to image material response following localized laser energy deposition: exit surface damage in fused silica as a case example. Opt. Eng. 2011, 50, 013602. DOI: 10.1117/1.3526689.
- Hu, S.; Zhang, F.; Shang, Q.; Chen, J.; Lu, L.; Miao, X.; Niu, L.; Liu, H.; Zhou, G.; Yuan, X. Optimization of cleaning technique for mitigating particulate contamination upon final optics assemblies. Optik 2021, 231, 166365. DOI: 10.1016/j.ijleo.2021.166365.
- Fan, S.C.; Lee, C.K.; Kang, K.W.; Wu, Z.J. Validation of a flight model for predicting debris trajectory from the explosion of an ammunition storage magazine. J. Wind Eng. Ind Aerodyn. 2015, 136, 114–126. DOI: 10.1016/j.jweia.2014.11.004.
- Demos, S.G.; Negres, R.A.; Raman, R.N.; Rubenchik, A.M.; Feit, M.D. Comparison of material response in fused silica and KDP following exit surface laser-induced breakdown. In Laser-Induced Damage in Optical Materials: 2013; SPIE, 2013; Vol. 8885, pp. 132–137.
- Bharati, M.S.S.; Soma, V.R. Flexible SERS substrates for hazardous materials detection: recent advances. OEA 2021, 4, 210048–210048. DOI: 10.29026/oea.2021.210048.
- Xu, K.; Zhang, C.; Zhou, R.; Ji, R.; Hong, M. Hybrid micro/nano-structure formation by angular laser texturing of Si surface for surface enhanced Raman scattering. Opt. Express 2016, 24, 10352–10358. DOI: 10.1364/OE.24.010352.
- Bai, Q.; Li, Y.; Zhang, K.; Wang, C.; Yuan, X.; Zhang, F. Cleaning state of the loop case for optical crystal module in final optics assembly. Nanomanuf. Metrol. 2018, 1, 260–267. DOI: 10.1007/s41871-018-0029-4.
- Mu, L.; Wang, S.; Zhai, Z.; Shang, Y.; Zhao, C.; Zhao, L.; Yin, H. Unsteady CFD simulation on ash particle deposition and removal characteristics in tube banks: focusing on particle diameter, flow velocity, and temperature. J. Inst. Energy 2020, 93, 1481–1494. DOI: 10.1016/j.joei.2020.01.010.
- Menter, F.R. Review of the shear-stress transport turbulence model experience from an industrial perspective. International Journal of Computational Fluid Dynamics 2009, 23, 305–316. DOI: 10.1080/10618560902773387.
- Richards, P.J. Dispersion of windborne debris. J. Wind Eng. Ind Aerodyn. 2012, 104–106, 594–602. DOI: 10.1016/j.jweia.2012.02.026.
- Haider, A.; Levenspiel, O. Drag coefficient and terminal velocity of spherical and nonspherical particles. Powder Technol. 1989, 58, 63–70. DOI: 10.1016/0032-5910(89)80008-7.
- Raman, R.N.; Elhadj, S.; Negres, R.A.; Matthews, M.J.; Feit, M.D.; Demos, S.G. Characterization of ejected fused silica particles following surface breakdown with nanosecond pulses. Opt. Express. 2012, 20, 27708–27724. DOI: 10.1364/OE.20.027708.
- Peng, G.; Lu, L.H.; Dong, Z. Propagation of laser-induced particles from fused silica. Chin. J. Lasers 2019, 46, 0403001.
- Demos, S.G.; Negres, R.A.; Raman, R.N.; Rubenchik, A.M.; Feit, M.D. Material response during nanosecond laser induced breakdown inside of the exit surface of fused silica. Laser Photon. Rev. 2013, 7, 444–452. DOI: 10.1002/lpor.201200100.
- Yang, H.; Gun, X.; Pang, G.; Zheng, Z.; Li, C.; Yang, C.; Wang, M.; Xu, K. Femtosecond laser patterned superhydrophobic/hydrophobic SERS sensors for rapid positioning ultratrace detection. Opt. Express 2021, 29, 16904–16913. DOI: 10.1364/OE.423789.
- Xu, K.; Yan, H.; Tan, C.F.; Lu, Y.; Li, Y.; Ho, G. W.; Ji, R.; Hong, M. Hedgehog inspired CuO nanowires/Cu2O composites for broadband visible‐light‐driven recyclable surface enhanced Raman scattering. Adv. Opt. Mater. 2018, 6, 1701167. DOI: 10.1002/adom.201701167.
- Raman, R.N.; Negres, R.A.; Demos, S.G. Imaging system to measure kinetics of material cluster ejection during exit-surface damage initiation and growth in fused silica. In Laser-Induced Damage in Optical Materials: 2009, December; SPIE, 2009; Vol. 7504, pp. 421–431. DOI: 10.1117/12.836922.
- Raman, R.N.; Negres, R.A.; Demos, S.G. Kinetics of ejected particles during breakdown in fused silica by nanosecond laser pulses. Appl. Phys. Lett. 2011, 98, 051901. DOI: 10.1063/1.3549193.
- Demos, S.G.; Negres, R.A.; Raman, R.N.; Feit, M.D.; Manes, K.R.; Rubenchik, A.M. Relaxation dynamics of nanosecond laser superheated material in dielectrics. Optica 2015, 2, 765–772. DOI: 10.1364/OPTICA.2.000765.