
 ?Mathematical formulae have been encoded as MathML and are displayed in this HTML version using MathJax in order to improve their display. Uncheck the box to turn MathJax off. This feature requires Javascript. Click on a formula to zoom.
Abstract
We present a confocal fluorescent endomicroscopic system with a Lissajous scan using an asymmetric polymer tube and piezoelectric (PZT) tube actuator. The fiber cantilever’s scanning part is often inside the PZT tube actuator to reduce the scanner’s rigid length and enhance the beam deflection via a lever mechanism. Here, the mathematical model of the PZT tube actuator-based lever mechanism is first proposed by considering the piezoelectric parameters of the actuator and Euler-Bernoulli beam deflection, showing a good agreement with experimental data. In addition, an elliptical polymer tube is used to divide the resonant frequencies of the fiber cantilever, allowing enough scanning amplitudes and alleviating the inherent cross-coupling issue of a PZT tube actuator. The design optimization is performed by selecting the optimal lever length and the shape of the PFA tube. The implemented endomicroscopic probe could successfully acquire imaging results from both a lens-cleaning tissue and an ex-vivo mouse colon.
1. Introduction
Recently, clinical gastrointestinal (GI) endoscopic screening and biopsy have substantially reduced cancer mortalities by enabling early-stage cancer diagnosis and surgical dissection.[Citation1] Conventional endoscopes can provide images of superficial mucosa or microvascular structures using narrow-band illumination at relatively low magnification.[Citation2] However, endoscopists need to improve these images to accurately assess where cellular or histological changes play an important role in target lesions.[Citation3] Several optical technologies have been developed, such as optical coherence tomography, multiphoton, and confocal systems.[Citation4–11] These techniques could visualize the cross-sectional or detailed morphological features of biological tissues, which is beneficial for integrating with existing endoscopic systems. Among these modalities, confocal fluorescence imaging allows the acquisition of high-contrast cellular images with a relatively simple setup. Moreover, along with FDA approval of a chemical agent called fluorescein, angiograms of internal organs can be obtained using an intravascular injection. It makes confocal laser endomicroscopy more practical by enhancing fluorescent imaging contrast.[Citation8]
Various methods have been developed to integrate fluorescence imaging optical components into an endomicroscopic probe. For instance, an optical fiber bundle can transmit numerous pixel intensities through tens of thousands of single-mode cores[Citation12] with the advantage that beam scanning does not have to be embedded in the probe end. However, there is an intrinsic limit to spatial resolution due to the core-to-core spacing.[Citation13] Even though several imaging algorithms are suggested to remove the honeycomb pattern caused by core-to-core spacing, there must be unsampled pixels causing noise and contrast reduction on the processed image.[Citation14] On the other hand, a point-scanning method that scans a single optical fiber, such as single-mode fiber (SMF) or double-clad fiber (DCF), can enhance image quality while diminishing speckle contrast.[Citation15]
Researchers have introduced various scanning systems to achieve a miniaturized point scanning probe. Photoacoustic ultrasonic endoscope for colorectal diseases with radial and lateral scanners was developed,[Citation9] and multimodal endoscopic imaging systems with rotary slip ring for intravascular imaging were also studied.[Citation10] Those systems require mechanical rotational scanning by a rotary motor and are generally adopted for side-viewing applications. A micro-electromechanical system (MEMS)[Citation16–18] and a piezoelectric (PZT) actuator[Citation19–22] have been introduced for a forward viewing scanner, which is appropriate for a GI endoscopy. Either method can achieve a competitive field-of-view (FOV) by employing a resonating fiber cantilever with low operational voltages. However, PZT scanners can be more compact and have a less complicated manufacturing process. In particular, the quadratic PZT tube actuator, which does not require separate actuators for each axis, has significantly reduced the size of the imaging probe.[Citation22] Moreover, the rigid length has been further reduced by connecting the cantilever and actuator in parallel through a lever mechanism.[Citation23,Citation24] The determination of a lever structure has been achieved empirically; however, it is crucial to construct an analytical model for rapid and efficient parameter selection.
The lever structure and a fiber cantilever design are also crucial for probe design optimization. The fiber cantilever should be adaptively designed to implement the predetermined scanning trajectory. Raster scanning has been widely adopted to achieve a fully sampled image.[Citation20,Citation21] However, the typical imaging speed of raster scanning is relatively low due to the non-resonant slow scanning axis. In addition, it requires high operation voltage, which should be avoided for clinical applications. Two sinusoidal driving voltages are generally used to resonate the fiber scanner of the PZT tube in both scanning axis, and their waveforms determine the fiber scanning pattern. Spiral scanning has generally been selected for PZT-based fiber scanning probes; the scanning is achieved by modulating the amplitudes of the two sinusoidal waveforms with the same frequencies.[Citation25] However, most of the illumination is concentrated in the center of the scanning area, which may induce photodamage or photobleaching in fluorescence imaging.[Citation26] In contrast, Lissajous scanning can quickly preview the entire region of interest while maintaining relatively uniform illumination.[Citation27]
To implement Lissajous scanning, sufficient deflection of the optical fiber should be realized at two different driving frequencies. One approach is to select two adjacent frequencies within a single resonant peak.[Citation28] In this case, a bare fiber does not require further fabrication to separate its resonant frequencies. However, there is a limitation on the allowable combinations of frequencies, and achieving a high scanning density takes work.[Citation29] Another approach is to modify the mechanical properties of the cantilever by attaching an additional asymmetric structure. An asymmetric fiber configuration was proposed by attaching protruding and stiffening rods to a bare fiber.[Citation26] The protruding rod was parallel to the fiber and adhered to the stiffening rod. It allowed dividing two resonant frequencies by more than along the two scanning axes. However, this scheme demanded ample space and an unwanted alignment process to attach the additional parts. In another approach, the stiffness of the fiber cantilever was modulated.[Citation30] Frequency separation was achieved by inserting two silicon microstructures into the fiber cantilever, where an off-axis fiber fragment connected the two structures. This asymmetric stiffness modulator not only divided resonant frequencies by more than
but also ignored the cross-coupling effect of the PZT actuator.[Citation31] Even though the stiffness modulator can make fiber configuration more compact, a complicated microfabrication procedure is inevitable, and the rigid parallel structure reduces the mechanical resonant gain of the fiber cantilever.
In this study, we present a confocal fluorescent endomicroscopic system that realizes Lissajous scanning by using an asymmetric polymer as a frequency separator (FS). The proposed analytic model first optimizes the lever length of the imaging probe. Then, the materials and shape of the polymer FS are determined among several biomedical tubing materials in terms of design flexibility and frequency separation ability. The optical fiber is then inserted into the coaxial center of the implemented FS with a relatively low resonant gain reduction. The scanning performance is evaluated by acquiring a harmonic response on each scanning axis, and image reconstruction of the implemented endomicroscopic probe is demonstrated on a lens-cleaning tissue. The imaging result of an ex-vivo mouse colon tissue slice is achieved and compared with its histological image.
2. Materials and methods
2.1. System configuration
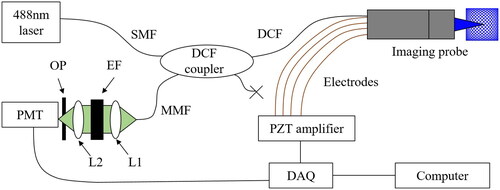
The system configuration of the confocal fluorescent imaging system is shown in . A laser (OBIS
Coherent, Inc, California, U.S.) is used as a light source through an SMF for the excitation of fluorescein dye. The excitation light is plugged into an input port of a DCF coupler. A DCF output port then transmits a single-mode illumination to the endomicroscopic probe via a small 2.3 µm diameter core. The light emitted from the fluorescein dye in a sample is transmitted by the first cladding, consisting of multimode fiber (MMF) with a slightly larger diameter of 15 µm. The collimator lens, L1 expands the beam diameter, and an emission filter (EF) transmits only the fluorescent light; it is focused by the lens L2. An optical pinhole (OP) is positioned at the focal point of L2, and the light intensity is measured by a photomultiplier tube (PMT, Hamamatsu Photonics K.K., Shizuoka, Japan). The size of the pinhole is selected to achieve a competent signal-to-noise ratio and reject out-focusing light. For operating the PZT actuator of the probe, two sinusoidal waveforms are generated by a data acquisition board (DAQ, PCIe-6374, National Instrument, Texas, U.S.). These inputs are amplified 25 times by a multi-channel amplifier (E-413.60, Pi Ceramic, Lederhose, Germany) synchronized with the PMT signals using a DAQ board.
Figure 1. System configuration of the presented Lissajous confocal fluorescent endomicroscopic system.
The endomicroscopic imaging probe consists of the scanning part and objective lenses, as shown in . The probe configuration is the reverse-mount type which can substantially reduce the rigid length of the endomicroscopic probe. A commercial piezo tube (Pi ceramic, Lederhose, Germany), with an outer diameter of and a thickness of
is precisely cut to have a length of
The distal end of the piezo tube is fixed at the housing with epoxy resin, and four thin electrodes are attached to each quadrant surface of the piezo tube. The DCF with a frequency separator is precisely aligned to the center of the piezo tube and connected by a fiber pinhole consisting of a thin reinforced polyamide-imide film. In addition, we customized the objective lenses which has a diameter of 1.8 mm and image space telecentric lenses.
Figure 2. Internal structure of the proposed imaging probe.
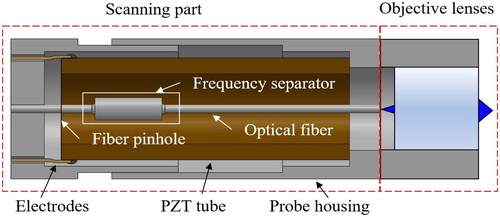
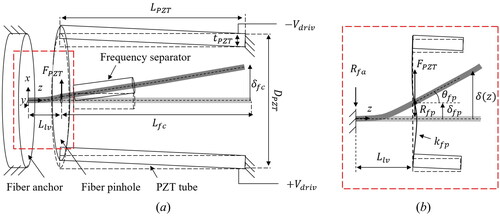
Figure 3. (a) Schematic diagram of the fiber deflection of the proposed fiber cantilever. (b) Free body diagram of the lever part.
2.2. Optimization on a lever length
For the analysis of the leveraged fiber cantilever, the schematic diagram of the scanner model is illustrated in .
and
are the lengths of the lever part, PZT tube, and fiber cantilever. The rear part of a probe housing acts as an anchor, and the fiber pinhole applies the load,
generated by the PZT tube, to the fiber cantilever. As two pairs of voltages with opposite polarities are applied on quadratic segments of the PZT tube actuator,
is generated along the two transversely oriented directions. Using the electromechanical energy conservation inside a piezoelectric actuator,
can be expressed as:[Citation32–34]
(1)
(1)
where
is the driving voltage, and
is the amount of force required to completely block the displacement of the actuator at a given test voltage,
The ratio of
and
varies on the PZT tube actuators, and we denote
by
is the displacement of the fiber pinhole by the load
as shown in .
is the deflection of the PZT tube without an external load at
and can be expressed as:[Citation35]
(2)
(2)
where d31 is a strain constant determined by a piezoelectric material,
is an outer diameter, and
is the thickness of the PZT tube, respectively. Here, we define
to represent the piezoelectric constant in EquationEquation (2)
(2)
(2) . Our PZT tube consists of PIC 255 ceramic which is known to have
of 180 pm/V and
of 0.13 mN/V.[Citation36] Using EquationEquations (1)
(1)
(1) and Equation(2)
(2)
(2) ,
can be simplified as follows:
(3)
(3)
We opt to find the optimal condition of for the maximum fiber bending angle at the end of the lever,
which eventually affects the deflection of the cantilever end,
Based on the free body diagram in , the following force equilibrium is met:
(4)
(4)
where
and
are the reaction forces on the fiber anchor and the fiber pinhole, respectively. We excluded the force of gravity from EquationEq. (4)
(4)
(4) due to its negligible magnitude. By solving the moment and force equilibriums on the cantilever,[Citation37] the deflection of the fiber at
can be calculated as follows:
(5)
(5)
where
is the flexural rigidity of the bare fiber. Thus, it is possible to calculate
and
as follows:
(6)
(6)
(7)
(7)
where
and
denote corresponding stiffness coefficients, respectively. As inferred from EquationEquation (4)
(4)
(4) , the proposed cantilever is indeterminant; hence, we used the following complementary equation at the fiber pinhole location:
(8)
(8)
where
is the stiffness of the fiber pinhole. By using this complementary equation,
can be expressed as:
(9)
(9)
According to EquationEquation (8)(8)
(8) , it can be seen that when
converges to 0 or diverges to infinity,
converges to 0. In addition, there is a maximum value at a specific
depending on the coefficients of the polynomials in the numerator and denominator. The optimal lever length,
is found at
resulting in the following equation:
(10)
(10)
2.3. Optimization on an asymmetric polymer tube
For Lissajous scanning, the elastic deformation of a fiber cantilever should be considered, and it can be analyzed by the following equation:[Citation38]
(11)
(11)
where δ is the elastic deformation of the fiber cantilever,
indicates the scanning axes,
or
is the bending moment,
is Young’s modulus,
is the cantilever’s second moment of inertia, and
is the mechanical load. There are four integration sections in our fiber cantilever as follows: from the fix point to the fiber pinhole (lever), from the fiber pinhole to the proximal end of the FS, inside the FS, and from the distal end of the FS to the fiber end. Among those sections, all parts except the inside of the FS are symmetric for the z-axis, so they do not affect frequency separation. The asymmetric shape of the FS induces different flexural rigidities along the two scanning axes:
and
so the deformations occur differently.
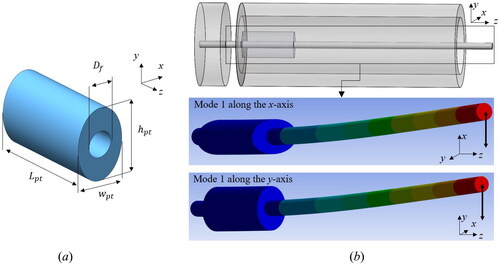
The schematic of the asymmetric polymer tube is shown in , and the tube’s cross-section is designed to be elliptical for ease of fabrication. denotes the length of the polymer tube, and the major axis (height) and minor axis (width) are
and
respectively. In addition, the diameter of the center hole is
which is the same as the outer diameter of an optical fiber. Therefore, the flexural rigidities of the polymer tube (
) can be expressed as follows:
(12)
(12)
(13)
(13)
where
is Young’s modulus of the polymer tube. The longer
the more asymmetric
affects the effective flexural rigidities of an entire fiber cantilever (
). It is possible to calculate the resonant frequency of the fiber cantilever as follows:[Citation38]
(14)
(14)
where
is the resonant frequency of the fiber cantilever,
is a constant dependent on the mode number,
is the linear density of the fiber cantilever, and
is the length of the fiber cantilever. The first mode resonant frequencies along each axis are used for Lissajous scanning, as shown in . Hence, the corresponding value of
is 1.875. For the better visibility, we adjusted the transparency of the fiber holder, fiber anchor, and PZT tube in , as the fiber cantilever is located inside the PZT tube. In the presented polymer tube,
is always bigger than
hence,
is larger than
which produces the resonant frequency separation (
). Regarding the resultant fiber deflection (
),
is always smaller than
due to the higher stiffness. Hence, there is a trade-off relationship between
and energy efficiency for flexural rigidity.
Figure 4. (a) Schematic of an elliptical polymer tube. (b) First resonance modes along each scanning axis for Lissajous scanning.
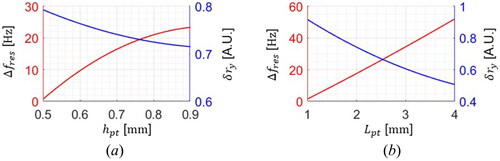
For the evaluation of the polymer tube, both Δ and the deflection reduction ratio along the y-axis (
) are analyzed by varying
and
as shown in . A finite element analysis (FEA) with an ANSYS simulation tool is performed to consider the detailed physical aspects of the cantilever model.
is 11 mm, and the fiber pinhole is at 0.6 mm ahead of the fix point.
is fixed to 0.5 mm, and
ranging from 0.5 mm to 0.9 mm is applied with a constant
of 2 mm. As the higher
is used, Δ
increases, and
decreases. Likewise, the same tendency is observed by
The results show that
affects both Δ
and
much more than the ellipse aspect ratio. The
is hard to change after fabricating the tube; however,
can be easily adjustable by cutting it.
Figure 5. Simulation results of Δ with respect to (a)
(left) and (b)
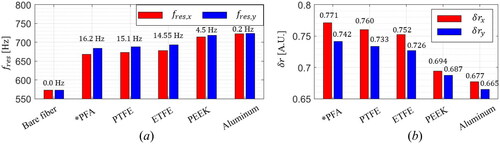
The geometrical dimension and the mechanical properties of the tubing material, such as density, Young’s modulus, and Poisson rate, also affect both Δ and
For the simulation with a variation on the tubing material,
,
and
are fixed to 0.5 mm, 0.7 mm, and 2 mm, respectively. As candidates for a tubing material, perfluoroalkoxy (PFA), polytetrafluoroethylene (PTFE), ethylene tetrafluoroethylene (ETFE), and polyether ether ketone (PEEK) were analyzed, as shown in . Their Young’s moduli are 494 MPa, 590 MPa, 680 MPa, and 3700 MPa, respectively.[Citation39–40] The resultant resonant frequencies along the two axes are depicted for the materials, and their Δ
are noted in . The bare fiber without the FS does not yield frequency separation. In addition, extremely rigid material such as aluminum having Young’s modulus of 70 GPa produces Δ
of 0.2 Hz, which can not function as a frequency separator. Despite its asymmetric shape, the rigid material has extremely high flexural rigidity along both axes, preventing an elastic deformation.
s along each axis are shown in .
is smaller than
due to the higher stiffness, and PFA was selected as the best material to have the highest Δ
and
Furthermore, PFA is superior to other polymers in tubing applications. It can be manufactured with a melt-extrusion process, so the extruder can precisely determine its shape.
Figure 6. Simulation results of (a) and (b)
at various tubing materials.
3. Results and discussion
3.1. Validation of the proposed analytical lever model
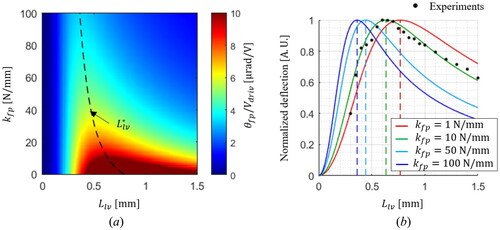
The simulation results of the deflection angle ratio for the driving voltage () are shown in . Here, the lever length and the stiffness of the pinhole are modulated from 0 mm to 1.5 mm and 1 N/mm to 100 N/mm, respectively. The black dotted contour indicates
at each
value; the smaller
is, the longer
is obtained. To evaluate the proposed lever model, we measured the deflection of the fiber tip while adjusting the lever length with a linear stage. In addition, the simulated deflection results at four
values are shown in . The value of
is contingent upon various parameters, including the geometry, dimensions, and material properties of the fiber pinhole, as well as the amount of epoxy utilized for the connection with the PZT tube and the fiber cantilever; here, we found the best-fitted result at
of 10 N/mm. The vertical dotted lines indicate the calculated optimal lever length for each
value. We found the maximum deflection at
of 0.6 mm, which has a good agreement with the proposed model result of 0.628 mm.
Figure 7. (a) Simulation results of deflection angle ratio with respect to the driving voltage () at various
and
by the proposed analytic lever model. (b) Comparison between simulation results and experiments on the beam deflection.
3.2. Fabrication of the endomicroscopic probe
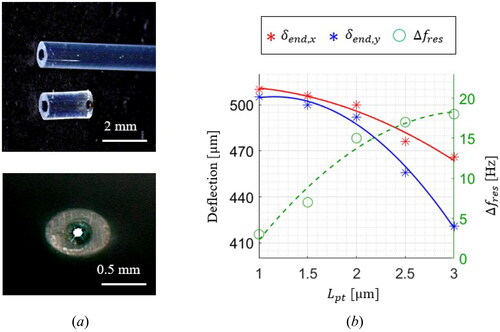
The PFA tube is fabricated to have an elliptical cross-section with and
of 0.5 mm and 0.7 mm, respectively, as shown in . Each elliptical PFA tube has a length of 10 cm and can be easily cut to various lengths. The optical fiber can be inserted into the fabricated PFA tube, and the core of the optical fiber is accurately located at the center of the tube, as shown in the lower side of . The PFA tube-inserted optical fiber is then assembled with the PZT and housing by precisely aligning the major and minor axes of the PFA tube with the quadrant sections of the PZT. For determining
both
and Δ
are experimentally achieved at various
from 1 mm to 3 mm, as shown in . Like the FEA results, Δ
increases, and
decreases as the larger
is used. Here, we obtained the fiber deflection results using the digital microscope (Inspex II, Ash Technologies Ltd., Ireland), and the lower boundary of
is set to
where the parasitic resonance could be barely observed. When
gets larger than 2 mm, we observed that
rapidly decreases. Hence,
is set to 2 mm as it can provide both sufficient Δ
and (
), which are measured to 14 Hz and (500 µm, 492 µm) at 60
Figure 8. (a) Microscopic images of the fabricated PFA tube. (b) Experimental results for the fiber deflection and Δ with respect to
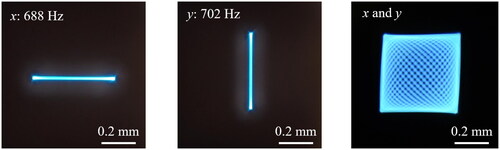
It is possible to achieve perpendicular and independent line scanning results for x- and y-axes, resulting in a clear Lissajous pattern, as shown in . Even though the absolute value of Δ is not larger than the previously reported values,[Citation27,Citation28,Citation41] the proposed PFA-based elliptical tube FS is proven to be enough to preclude inherent parasitic resonance of the PZT tube actuator.
Figure 9. Fiber deflection results along the x- and y-axes, and the resultant Lissajous pattern.
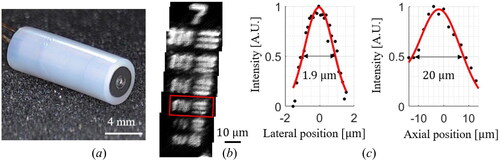
For the probe assembly, the bare optical fiber is consecutively inserted through the fiber anchor, fiber holder, and PZT tube. The PFA elliptical tube is then inserted into the distal part of the bare fiber. The location of the PFA tube on the bare fiber is adjusted to get enough frequency separation, and ultraviolet curing epoxy is used to fix the PFA tube. We have confirmed that the amount and elasticity of the epoxy have a subtle effect on the entire resonant frequency less than via FEA simulation. Finally, the fiber cantilever is pulled back to adjust the total length of the cantilever, and the lever length is set to the desired value. The assembled imaging probe is enclosed in a nonconductive hypodermic tube, resulting in an outer diameter of 5.4 mm and a rigid length of 15.5 mm, as shown in . For the resolution measurements, a commercial resolution test chart (R3L3S1N, Thorlabs, New Jersey, U.S.) and a mirror are used for the lateral and axial resolution measurements, respectively. Several line pairs of a 7th group in a resolution chart could be visualized, and stitched image is shown in . In order to calculate the lateral resolution, we used the line pair images of 4th element which is denoted by the red inset box and has a reference width of 2.76 µm. In addition, the mirror surface is used to achieve an axial resolution by measuring the reflected light intensity by PMT at different image depth. The measured lateral and axial resolutions are 1.9 µm and 20.0 µm, respectively, as shown in .
Figure 10. (a) Picture of the implemented endomicroscopic probe. (b) Stitched image of 7th group in the resolution test chart. (c) The measured lateral and axial resolutions.
3.3. Imaging results
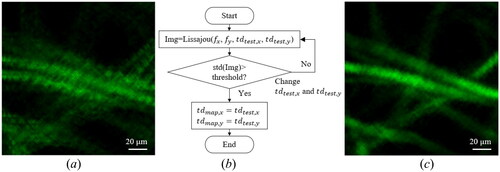
For an accurate image reconstruction of Lissajous scanned data, it is necessary to know the exact position of the scanning fiber during the data acquisition.[Citation41] Sinusoidal waveforms with different driving frequencies are applied as the driving voltages. An actual position of the fiber has a time delay () from the driving waveform due to the mechanical and electrical delay. The measured light intensities are projected onto the corresponding mapping pixel in a time sequence. Hence, if the mapping time delays (
) are different from the actual
an image is acquired with distortion, as shown in . Replicated features of a lens cleaning tissue soaked with fluorescein can be observed when both
and
of zeros are applied. Due to the nature of the drastic phase shift near the resonance, the phase components of the Lissajous scanning pattern are susceptible to environmental disturbances. However, it is possible to estimate the actual phase shifts by applying several testing td s and choosing the best td which can maximize the standard deviation (
) of the image as
as shown in .
of an image is related to the sharpness;[Citation42] hence,
-based image mapping has been generally adopted for a Lissajous image. The deteriorated image can be improved by applying an optimal
as shown in . A tissue fiber thickness of 10 µm can be clearly visualized, and the driving voltages of 46.8
and 47.6
were applied on each axis, resulting in a rectangular FOV of 150 µm × 150 µm. The amplitude of FOV can be adjusted by modulating driving voltages, and
pixels are used to get an enough sampling density of
at a frame rate of
In addition, we adopt real-time interpolation to fill the unsampled pixels by applying a gaussian kernel to the nearest-neighboring sampled pixels. The interpolated image can further enhance the robustness of
calculation with less noise.
Figure 11. (a) A raw image of an acquired lens cleaning tissue. (b) Flowchart of a distortion correction. (c) A distortion-corrected image with the determined mapping time delays.
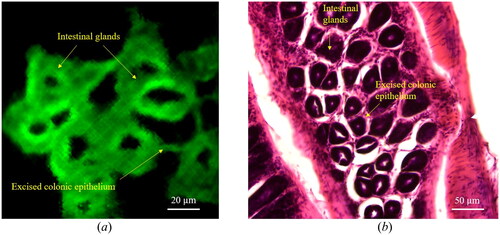
To study a biological tissue, an ex-vivo mouse colon is extracted by following the experimental protocol approved by the Animal Experiment Ethics Committee of Daegu Gyeongbuk Institute of Science and Technology (approval no. DGIST-IACUC-19081605-0000), and the tissue slice is achieved via cryosectioning. The imaging results are shown in . Both circular intestinal glands and excised colonic epithelium are clearly visualized. For comparison, a Hematoxylin and Eosin (H&E) stained image of the same colonic section is investigated, as shown in . Several relevant features can be observed, as the yellow arrows indicate.
Figure 12. (a) An acquired image of sectioned mouse colon and (b) the relevant H&E stained colon image. The scale bar represents 20 µm.
4. Conclusion
In conclusion, the analytical model of the lever mechanism and the frequency separation by an elliptical polymer tube are demonstrated to optimize a confocal fluorescent endomicroscopic probe. Based on the piezoelectric property of the PZT tube actuator and Euler-Bernoulli equations on the fiber cantilever, the optimal lever length can be examined and demonstrated to have a good agreement with experimental data. Regarding the frequency separator, the proposed asymmetric polymer tube can lead to the ease of alignment and fabrication of an imaging probe with low resonant gain reduction.
The asymmetric fiber cantilever inserts the bare optical fiber into an elliptical polymer tube fragment and successfully divides the resonant frequencies along each scanning axis without parasitic resonance. The confocal fluorescent imaging probe is assembled by integrating the scanning part and objective lenses within a non-conductive enclosure. It enables successful image acquisition of a lens-cleaning tissue and sectioned ex-vivo mouse colon. The proposed lever model and the polymer-based asymmetric tube are expected to enhance the efficiency of design optimization, compactness, and ease of assembly of any Lissajous cantilever.
Disclosure statement
No potential conflict of interest was reported by the author(s).
Additional information
Funding
References
- Hamashima, C.; Shabana, M.; Okada, K.; Okamoto, M.; Osaki, Y. Mortality Reduction from Gastric Cancer by Endoscopic and Radiographic Screening. Cancer Sci. 2015, 106, 1744–1749. DOI: 10.1111/cas.12829.
- Pfau, P. R.; Sivak, M. V. Jr. Endoscopic Diagnostics. Gastroenterology 2001, 120, 763–781. DOI: 10.1053/gast.2001.22429.
- Muto, M.; Minashi, K.; Yano, T.; Saito, Y.; Oda, I.; Nonaka, S.; Omori, T.; Sugiura, H.; Goda, K.; Kaise, M.; et al. Early Detection of Superficial Squamous Cell Carcinoma in the Head and Neck Region and Esophagus by Narrow Band Imaging: A Multicenter Randomized Controlled Trial. J. Clin. Oncol. 2010, 28, 1566–1572. DOI: 10.1200/JCO.2009.25.4680.
- Song, C.; Kim, T. J.; Gweon, D. G. Beam Scanning Confocal Differential Heterodyne Interferometry. Int. J. Optomechatronics 2007, 1, 27–45. DOI: 10.1080/15599610701261076.
- Schulz-Hildebrandt, H.; Pfeiffer, T.; Eixmann, T.; Lohmann, S.; Ahrens, M.; Rehra, J.; Draxinger, W.; König, P.; Huber, R.; Hüttmann, G. High-Speed Fiber Scanning Endoscope for Volumetric Multi-Megahertz Optical Coherence Tomography. Opt. Lett. 2018, 43, 4386–4389. DOI: 10.1364/OL.43.004386.
- Do, D.; Yoo, H.; Gweon, D. G. Fiber-Optic Raster Scanning Two-Photon Endomicroscope Using a Tubular Piezoelectric Actuator. J. Biomed. Opt. 2014, 19, 066010. DOI: 10.1117/1.JBO.19.6.066010.
- Hughes, M.; Yang, G. Z. High Speed, Line-Scanning, Fiber Bundle Fluorescence Confocal Endomicroscopy for Improved Mosaicking. Biomed. Opt. Express 2015, 6, 1241–1252. DOI: 10.1364/BOE.6.001241.
- Wallace, M. B.; Fockens, P. Probe-Based Confocal Laser Endomicroscopy. Gastroenterology 2009, 136, 1509–1513. DOI: 10.1053/j.gastro.2009.03.034.
- Guo, T.; Xiong, K.; Zhang, Z.; Li, L.; Yang, S. In Vivo Anatomical Imaging of Colorectum by Tens-of- Micron-Resolved Photoacoustic/Ultrasonic Endoscope. Appl. Phys. Lett. 2021, 118, 153702. DOI: 10.1063/5.0049855.
- Wang, P.; Chen, Z.; Yang, F.; Yang, S.; Xing, D. Intravascular Tri-Modality System: Combined Ultrasound, Photoacoustic, and Elasticity Imaging. Appl. Phys. Lett. 2018, 113, 253701. DOI: 10.1063/1.5051387.
- Untracht, G. R.; Karnowski, K.; Sampson, D. D. Imaging the Small with the Small: Prospects for Photonics in Micro-Endomicroscopy for Minimally Invasive Cellular-Resolution Bioimaging. APL Photonics 2021, 6, 060901. DOI: 10.1063/5.0052258.
- Sparks, H.; Warren, S.; Guedes, J.; Yoshida, N.; Charn, T. C.; Guerra, N.; Tatla, T.; Dunsby, C.; French, P. A Flexible Wide-Field Flim Endoscope Utilising Blue Excitation Light for Label-Free Contrast of Tissue. J. Biophotonics 2015, 8, 168–178. DOI: 10.1002/jbio.201300203.
- Vyas, K.; Hughes, M.; Rosa, B. G.; Yang, G. Z. Fiber Bundle Shifting Endomicroscopy for High-Resolution Imaging. Biomed. Opt. Express 2018, 9, 4649–4664. DOI: 10.1364/BOE.9.004649.
- Liu, J.; Zhou, W.; Xu, B.; Yang, X.; Xiong, D. Honeycomb Pattern Removal for Fiber Bundle Endomicroscopy Based on a Two-Step Iterative Shrinkage Thresholding Algorithm. AIP Adv. 2020, 10, 045004. DOI: 10.1063/1.5143929.
- Lemire-Renaud, S.; Strupler, M.; Benboujja, F.; Godbout, N.; Boudoux, C. Double-Clad Fiber with a Tapered End for Confocal Endomicroscopy. Biomed. Opt. Express 2011, 2, 2961–2972. DOI: 10.1364/BOE.2.002961.
- Park, H. C.; Song, C.; Jeong, K. H. Micromachined Lens Microstages for Two-Dimensional Forward Optical Scanning. Opt. Express 2010, 18, 16133–16138. DOI: 10.1364/OE.18.016133.
- Qiu, Z.; Liu, Z.; Duan, X.; Khondee, S.; Joshi, B.; Mandella, M. J.; Oldham, K.; Kurabayashi, K.; Wang, T. D. Targeted Vertical Cross-Sectional Imaging with Handheld Near-Infrared Dual Axes Confocal Fluorescence Endomicroscope. Biomed. Opt. Express 2013, 4, 322–330. DOI: 10.1364/BOE.4.000322.
- Hui, C.; Albert, C.; Wei Jie, S.; Zhen Dong, S.; John Tw, Y. Closed-Loop Control of a 2-d Mems Micromirror with Sidewall Electrodes for a Laser Scanning Microscope System. Int. J. Optomechatronics 2016, 10, 1–13. DOI: 10.1080/15599612.2015.1095956.
- Li, Z.; Yang, Z.; Fu, L. Scanning Properties of a Resonant Fiber-Optic Piezoelectric Scanner. Rev. Sci. Instrum. 2011, 82, 123707. DOI: 10.1063/1.3671290.
- Li, Z.; Fu, L. Note: A Resonant Fiber-Optic Piezoelectric Scanner Achieves a Raster Pattern by Combining Two Distinct Resonances. Rev. Sci. Instrum. 2012, 83, 086102. DOI: 10.1063/1.4739770.
- Sawinski, J.; Denk, W. Miniature Random-Access Fiber Scanner for in Vivo Multiphoton Imaging. J. Appl. Phys. 2007, 102, 034701. DOI: 10.1063/1.2763945.
- Lurie, K. L.; Gurjarpadhye, A. A.; Seibel, E. J.; Ellerbee, A. K. Rapid Scanning Catheterscope for Expanded Forward-View Volumetric Imaging with Optical Coherence Tomography. Opt. Lett. 2015, 40, 3165–3168. DOI: 10.1364/OL.40.003165.
- Zhang, N.; Tsai, T. H.; Ahsen, O. O.; Liang, K.; Lee, H. C.; Xue, P.; Li, X.; Fujimoto, J. G. Compact Piezoelectric Transducer Fiber Scanning Probe for Optical Coherence Tomography. Opt. Lett. 2014, 39, 186–188. DOI: 10.1364/OL.39.000186.
- Im, J.; Chang, Y.; Song, C. Modified Phase-Offset-Driven Lissajous Scanning Endomicroscopy with a Polyimide-Film-Based Frequency Separator. IEEE/ASME Trans. Mechatronics 2022, 27, 4289–4839. DOI: 10.1109/TMECH.2022.3166453.
- Liang, W.; Murari, K.; Zhang, Y. Y.; Chen, Y.; Li, X. D.; Li, M. J. Increased Illumination Uniformity and Reduced Photodamage Offered by the Lissajous Scanning in Fiber-Optic Two-Photon Endomicroscopy. J. Biomed. Opt. 2012, 17, 021108. DOI: 10.1117/1.JBO.17.2.021108.
- Park, H. C.; Seo, Y. H.; Jeong, K. H. Lissajous Fiber Scanning for Forward Viewing Optical Endomicroscopy Using Asymmetric Stiffness Modulation. Opt. Express 2014, 22, 5818–5825. DOI: 10.1364/OE.22.005818.
- Moon, S.; Lee, S. W.; Rubinstein, M.; Wong, B. J.; Chen, Z. Semi-Resonant Operation of a Fiber-Cantilever Piezotube Scanner for Stable Optical Coherence Tomography Endoscope Imaging. Opt. Express 2010, 18, 21183–21197. DOI: 10.1364/OE.18.021183.
- Hwang, K.; Seo, Y. H.; Ahn, J.; Kim, P.; Jeong, K. H. Frequency Selection Rule for High Definition and High Frame Rate Lissajous Scanning. Sci. Rep. 2017, 7, 14075. DOI: 10.1038/s41598-017-13634-3.
- Wu, T.; Ding, Z.; Wang, K.; Chen, M.; Wang, C. Two-Dimensional Scanning Realized by an Asymmetry Fiber Cantilever Driven by Single Piezo Bender Actuator for Optical Coherence Tomography. Opt. Express 2009, 17, 13819–13829. DOI: 10.1364/oe.17.013819.
- El Rifai, O. M.; Youcef-Toumi, K. Trade-Offs and Performance Limitations in Atomic Force Microscope Feedback System. IFAC Proc. 2002, 35, 185–190. DOI: 10.1016/S1474-6670(17)33939-3.
- Podgorski, L.; De Meijer, M.; Lanvin, J. D. Influence of Coating Formulation on Its Mechanical Properties and Cracking Resistance. Coatings 2017, 7, 163. DOI: 10.3390/coatings7100163.
- Xuan, Z.; Tailie, J.; Ngoc San, H.; Nam Seo, G.; Tae Heun, K.; Byung Woon, B.; Han Seo, K.; Ki Won, Y. Performance of Piezo-Stacks for a Piezoelectric Hybrid Actuator by Experiments. J. Intell. Mater. Syst. Struct. 2014, 25, 2212–2220. DOI: 10.1177/1045389X14533439.
- Khalil, N.; Leo, D. J.; Cudney, H. H. Compact Piezohydraulic Actuation System. Smart Structures and Materials 2000: Industrial and Commercial Applications of Smart Structures Technologies 2000, 3991; pp. 312–322. SPIE Proc. DOI: 10.1117/12.388174.
- Kuiper, S.; Schitter, G. Active Damping of a Piezoelectric Tube Scanner Using Self-Sensing Piezo Actuation. Mechatronics 2010, 20, 656–665. DOI: 10.1016/j.mechatronics.2010.07.003.
- Gao, X.; Jie, D.; Shijing, Z.; Li, J.; Yingxiang, L. A Compact 2-Dof Micro/Nano Manipulator Using Single Miniature Piezoelectric Tube Actuator. IEEE Trans. Ind. Electron. 2022, 69, 3928–3937. DOI: 10.1109/TIE.2021.3071698.
- Vaccarone, R.; Andrea, P.; Rsanna, P. A Cryogenic Scanning Stage with Position Control for a Magnetic Microscope. Phys. B: Condens. Matter 2000, 284–288, 2115–2116. DOI: 10.1016/S0921-4526(99)03015-X.
- Wischke, M.; Masur, M.; Goldschmidtboeing, F.; Woias, P. Resonance Tunability of Clamped–Free Piezo- Electric Cantilevers. J. Micromech. Microeng. 2009, 19, 125020. DOI: 10.1088/0960-1317/19/12/125020.
- Van Eysden, C. A.; Sader, J. E. Resonant Frequencies of a Rectangular Cantilever Beam Immersed in a Fluid. J. Appl. Phys. 2006, 100, 114916. DOI: 10.1063/1.2401053.
- Frick, A.; Sich, D.; Heinrich, G.; Stern, C.; Gössi, M.; Tervoort, T. A. Relationship between Structure and Mechanical Properties of Melt Processable PTFE: Influence of Molecular Weight and Comonomer Content. Macromol. Mater. Eng. 2013, 298, 954–966. DOI: 10.1002/mame.201200172.
- He, Y.; Chen, W. Experiment and Theoretical Analysis Study of ETFE Inflatable Tubes. Int. J. Aerosp. Eng. 2014, 2014, 1–10. DOI: 10.1155/2014/925428.
- Birla, M.; Xiyu, D.; Haijun, L.; Miki, L.; Gaoming, L.; Thomas, D. W.; Kenn, R. O. Image Processing Metrics for Phase Identification of a Multiaxis MEMS Scanner Used in Single Pixel Imaging. IEEE ASME Trans. Mechatron. 2021, 26, 1445–1454. DOI: 10.1109/tmech.2020.3020923.
- Armando, A. J.; Analucia, V. F.; Daniel, P. W.; Mauro, E. B. Phase Maps Retrieval from Sequences of Phase Shifted Images with Unknown Phase Steps Using Generalized n-Dimensional Lissajous Figures—Principles and Applications. Int. J. Optomechatronics 2014, 8, 340–356. DOI: 10.1080/15599612.2014.942933.