
Abstract
In the 12 years since the publication of the first Consensus Paper of the WFSBP on biomarkers of neurodegenerative dementias, enormous advancement has taken place in the field, and the Task Force takes now the opportunity to extend and update the original paper. New concepts of Alzheimer’s disease (AD) and the conceptual interactions between AD and dementia due to AD were developed, resulting in two sets for diagnostic/research criteria. Procedures for pre-analytical sample handling, biobanking, analyses and post-analytical interpretation of the results were intensively studied and optimised. A global quality control project was introduced to evaluate and monitor the inter-centre variability in measurements with the goal of harmonisation of results. Contexts of use and how to approach candidate biomarkers in biological specimens other than cerebrospinal fluid (CSF), e.g. blood, were precisely defined. Important development was achieved in neuroimaging techniques, including studies comparing amyloid-β positron emission tomography results to fluid-based modalities. Similarly, development in research laboratory technologies, such as ultra-sensitive methods, raises our hopes to further improve analytical and diagnostic accuracy of classic and novel candidate biomarkers. Synergistically, advancement in clinical trials of anti-dementia therapies energises and motivates the efforts to find and optimise the most reliable early diagnostic modalities. Finally, the first studies were published addressing the potential of cost-effectiveness of the biomarkers-based diagnosis of neurodegenerative disorders.
Introduction
The concept of biomarkers in neurodegenerative disorders
Twelve years after publication of the first WFSBP consensus paper on the biomarkers of dementia disorders (Wiltfang et al. Citation2005), the WFSBF Task Force now takes the opportunity to update this consensus to reflect the most current state-of-the-art in the field.
Pharmacological treatment strategies for neuropsychiatric diseases have been developed in the ‘times of neurochemistry’ and since that time no real new therapeutic targets have been discovered for dementia disorders, Parkinson’s disease (PD), depression or schizophrenia, all of them characterised by high societal and personal burden. However, recent developments have led to define and test specific and selective biomarkers for the early detection of neurodegenerative diseases.
The ‘biomarker concept’ includes a variety of possible research strategies: (a) predictive biomarkers for estimating disease probability at the pre-clinical stage, (b) diagnostic biomarkers, e.g. for precise differential diagnosis, (c) prognostic biomarkers for prognosis/chance of healing, (d) treatment response biomarkers (‘theramarkers’) for estimating the response to therapy, (e) surrogate biomarkers for getting evidence, how intervention influences the endpoint of interest, (f) trait markers as invariable characteristics of a disease e.g. gene mutations, and (g) state markers to follow disease progression, e.g. enzymes, ions, etc.
The most rigorous but most solid definitions of ‘a diagnostic biomarkers’ in the field of neurodegenerative dementias, especially for Alzheimer’s disease (AD) were those given by two National Institute on Aging (NIA) and Alzheimer Association consensus conferences (Consensus Report of the Working Group Citation1998, Frank et al. Citation2003), as well as Shaw et al. (Citation2007) and Gerlach et al. (Citation2012), which includes the following features:
linked to fundamental features of the neuropathology,
validated in neuropathologically confirmed cases,
able to detect the disease early in its course and distinguish it from other dementias,
non-invasive, simple to use and inexpensive,
not influenced by symptomatic drug treatment.
The following criteria should be fulfilled before acceptance as a valid biomarker for AD (Consensus report of the Working Group Citation1998; Frank et al. Citation2003; Gerlach et al. Citation2012; Shaw et al. Citation2007):
sensitivity (>85%; 100% indicates that all patients are identified with the disease),
specificity (>85%; 100% identifies all individual free of the disease),
prior probability (the background prevalence of the disease in the population tested),
positive predictive value (>80%; refers to the percentage of people who are positive for the biomarker and have definite the disease at autopsy),
negative predictive value (percentage of people with a negative test, and no disease at autopsy).
In addition, to meet endophenotype criteria candidate markers have to be:
heritable,
relatively state-independent and stable over time,
associated with the illness,
found in affected as well as unaffected family members at a higher rate than in the general population.
Currently, the most interesting uses/applications of biomarkers are: (a) pre-symptomatic diagnosis of neuropsychiatric disorders, which is an important aspect as such specific and selective biomarkers would allow early treatment strategies at a time when in AD and PD more than 50% of degenerating types of neurons are still available and can be rescued; (b) providing evidence for effectiveness of therapies; and (c) differentiation of subtypes of a certain disorder, as in the case of ‘dementias’. Based on all available information at the time, an algorithm was developed to identify a large population of individuals that may benefit from prevention studies (Hampel et al. Citation2010).
Due to the fact, that drug development for AD currently is unsuccessful, validated targets and validated biomarkers are of utmost importance. Blennow et al. (Citation2014) have tried to make recommendations for biomarkers during all stages of drug development processes. Such strategies are of great interest; however, they are based on a close interaction of researchers involved in drug development and those, who translate basic research into clinical practice. Unfortunately, this interaction between basic scientists, clinicians and drug-developing institutions has proven to be challenging and in need of improvement.
In this review we describe possible candidate diagnostic biomarkers for the early detection of AD and other types of dementias and to critically discuss problems for their reliable detection, such as lack of standardisation of calibration materials, relatively large inter-centre variability, or uncertainty how to interpret some of untypical biomarker patterns. As there is no evidence for sporadic AD (as based on their multiple subtypes, multiple phenotype, multiple triggers, multiple pathobiochemical causes) to be encompassed by one specific and selective biomarker, the combination of biomarker compounds/gene measure may be suitable to identify both causal targets for drug development and particular subtypes of AD, as well as other neurodegenerative disorders for a selective treatment.
The historical concept of AD
There is no doubt that discovery of drugs that could treat AD would mean a breakthrough in medicine. To achieve this goal, however, it is important to have diagnostic tools capable of correctly identifying of patients and identification of the disease, if possible already at the early pre-clinical stages.
In our medical schools we learnt that AD was a clinical-pathological entity: historically the diagnosis of AD cannot be certified clinically and definite diagnosis needs a histological confirmation based on cerebral biopsy or post-mortem examination (McKhann et al. Citation1984). In the absence of such histological evidence, the clinical diagnosis of AD can only be probable and should only be made when the disease is advanced and reaches the threshold of dementia. Based on the NINCDS-ADRDA criteria, the diagnosis of probable AD requires that a dementia syndrome is established by clinical examination, documented by mental status questionnaire, and confirmed by neuropsychological testing: there must be a deficit in two or more areas of cognition, including memory with a progressive worsening over time responsible for a significant impact on activities of daily living. There may not be any disturbance of consciousness at time of the assessment and no evidence of systemic or other brain diseases that could account for a dementia syndrome. Therefore, the clinical diagnosis of AD is considered within a two-step procedure with: (a) an initial identification of a dementia syndrome and (b) the exclusion of other possible aetiologies of dementia syndrome with blood/cerebrospinal fluid (CSF) investigations for ruling out infectious, inflammatory or metabolic diseases and with brain neuroimaging (CT scan or MRI) for excluding small-vessel diseases, strategic lacunar infarcts, large vessel infarcts and/or cerebral haemorrhages, brains tumours, hydrocephalus and similar conditions.
Considering AD as a dementia led to the concept of mild cognitive impairment (MCI), a label that refers to objective memory and/or cognitive impairment not severe enough to impact the activities of daily living. MCI is a concept introduced by Reisberg et al. (Citation1982) and the Mayo Clinic group (Petersen et al. Citation1999) to fill the gap between cognitive changes of normal aging on the one hand, and those, on the other hand, associated with dementia (vascular, degenerative, etc.). MCI is a syndrome collecting under a single label a variety of pathological entities that may share clinical features but have different aetiologies. To decrease the clinical and pathological heterogeneity, sub-typing MCI has been proposed (i.e. single and multi-domain, amnestic and non-amnestic (Petersen Citation2004)). However, only 70% of amnestic MCI cases which have progressed to dementia actually met neuropathological criteria for AD (Jicha et al. Citation2006). This aetiologic heterogeneity of MCI is problematic (Dubois and Albert Citation2004). From the clinical point of view, in a given patient, the mission of the clinician is to identify the disease responsible for the syndrome, as it may have significant impact in terms of prognosis and/or treatment. For example, it is meaningful to distinguish between depression and AD in patients with a diagnosis of MCI. From the research point of view, heterogeneity of MCI may dilute the potential for a significant treatment effect and may have contributed to the negative outcomes where none of the tested medications were successful in delaying the time to diagnosis of AD (Jelic et al. Citation2006).
Revisiting the current concept of AD
A number of considerations emphasise the need to revise the conceptual framework of AD:
(1) Considering AD only at the threshold of dementia is too late. AD pathology has already been ongoing for decades when the patients express the first cognitive symptoms. The diagnosis of AD should be made earlier than at this stage of disease expression for many reasons:
There is no reason to link the diagnosis of a disease with a certain threshold of severity thereby excluding patients from the possibility of treatment due to that they are not yet expressing a full-blown dementia.
There is no justification to anchor the diagnosis of AD to a dementia syndrome. If we refer to PD, the diagnosis does not hinge on a level of severity, for example, when the patient is bedridden, but on the presence of the earliest motor symptoms, for example, a limited resting tremor of one hand. The same should apply for AD.
Earlier intervention for drug development also appears as a necessity. Selecting patients with functional disability may be too late because, at this stage, amyloid burden is already very pervasive as shown by amyloid positron emission tomography (PET) studies in vivo (Jack et al. Citation2009).
(2) The NINCDS-ADRDA criteria for AD have a low specificity against other dementias because at the time of these criteria, i.e. 1984, the clinical phenotype of AD was not specified and no reference to biomarkers of AD was proposed. This explains why AD was frequently misdiagnosed with other neurodegenerative diseases that can fulfil the NINCDS-ADRDA criteria (Varma et al. Citation1999). Since 1984, great progress has been made in several domains:
The clinical phenotype of AD has been refined: in more than 85% of the cases, AD presents as a progressive amnestic disorder. Episodic memory deficit is a precautious and reliable neuropsychological marker of AD (Dubois and Albert Citation2004). It is supported by the fact that post-mortem studies of AD patients provide evidence of a rather specific pattern of cortical neuronal lesions which appear to begin within the medial temporal lobe structures (entorhinal cortex, hippocampal formations, parahippocampal gyrus) (Delacourte Citation2006), areas known to be critical for long-term episodic memory. This pattern explains a rather homogeneous clinical presentation of AD, which can be divided into two main stages: the first consists of a progressive and rather isolated amnestic syndrome in relation to the early involvement of the medial temporal structures. The second is characterised by the addition and the development of cognitive symptoms in the domain of executive (conceptualisation, judgment, problem solving) and instrumental (language, praxis, face or object recognition) functions and of psycho-behavioural changes, due to the increased burden and progression of neuronal lesions to the neocortical areas (Braak and Braak Citation1991b). All these symptoms progressively impact on the autonomy of the patient defining the dementia stage.
The diagnostic accuracy of AD has also been improved in the last years because of the characterisation and the definition of other dementias through specific criteria, including the primary progressive aphasias (PPA), cortico-basal degeneration (CBD), posterior cortical atrophy (PCA) and dementia with Lewy bodies (DLB). The individualisation of these new diseases, overlapping with AD syndrome, has consequently decreased its apparent heterogeneity.
As reviewed in this paper, reliable biomarkers for AD have been isolated that are now available at least in expert centres: MRI enables detailed visualisation and volumetric measures of medial temporal lobe structures; PET using fluorodeoxyglucose (FDG) is helpful in measuring the glucose metabolism in cortical neurons and glial cells; CSF biomarkers can detect molecular pathological features of AD in vivo; PET using amyloid radiotracer can visualise the presence of amyloid lesions in the cerebral cortex. These biomarkers improve the diagnostic accuracy for AD and their diagnostic predictability has been extended to the pre-dementia stage and even the pre-clinical states of AD.
(3) The possible identification of in vivo biomarkers of AD pathology is responsible for a major change in the conceptualisation and the diagnosis of the disease. MRI and CSF are no longer proposed for only excluding other aetiologies in case of a dementia syndrome. They are now proposed to be part of the diagnostic procedure. The revised diagnostic criteria, proposed by the International Working Groups (IWG) (Dubois et al. Citation2007; Dubois et al. Citation2014) or by the NIA/AA (Albert et al. Citation2011; McKhann et al. Citation2011), and reviewed in this paper, have both introduced the biomarkers in the diagnostic framework. Depending of a definition, biomarkers can be linked to the disease process and/or a stage of severity; correspondingly, these criteria allow us to identify AD at a prodromal stage and even at a pre-clinical stage of the disease. Both sets of criteria recognise pre-clinical states of AD, which are characterised by the presence of a positive pathophysiological biomarker in cognitively normal subjects.
Epidemiology of dementia disorders
Prevalence of dementia
An estimated 47 million people worldwide were living with dementia in 2015. This number is expected to double every 20 years to 132 million by 2050 (Prince et al. Citation2015). Due to population growth and demographic aging, the increase is predicted to be highest in low- and middle-income countries (Prince et al. Citation2015). The most common subtypes are AD, vascular dementia (VaD), DLB, frontotemporal dementia (FTD) and PD. Estimates of the proportion of dementia cases attributable to these subtypes vary considerably among studies. There is agreement that AD is the most common cause of dementia, accounting for 50–70% of cases. After AD, VaD is the most common cause of dementia, causing around 15% of cases (O’Brien and Thomas Citation2015). About 8% of people living with dementia have clinically diagnosed DLB-type, increasing to 10–15% when additional testing was applied (Stevens et al. Citation2002; Rahkonen et al. Citation2003). In a meta-analysis of population-based studies, FTD accounted for 2.7% of all dementia cases older than 65 years (Hogan et al. Citation2016). FTD appeared more common among young-onset dementia patients with prevalence estimates varying from 3 to 26% (Vieira et al. Citation2013). Although PD is a common neurodegenerative movement disorder (Dorsey et al. Citation2007), PD-related dementia (PDD) occurs in ∼80% of PD patients over the course of their illness (Stevens et al. Citation2002; Irwin et al. Citation2017).
Prevalence of AD pathology
The characteristic pathological substrates of AD, Aβ containing plaques and Tau-containing neurofibrillary tangles, can be also found in the brains of persons without dementia. In a meta-analysis of non-demented subjects, the prevalence of amyloid pathology as estimated by biomarkers in CSF or by PET imaging was 23% in cognitively normal individuals, 25% in subjects with subjective cognitive impairment and 49% among patients with MCI (Jansen et al. Citation2015; Hoglund et al. Citation2017). In cognitively normal subjects, amyloid positivity preceded the onset of the symptoms by 20–30 years (Jansen et al. Citation2015). In a recent meta-analysis, the prevalence of amyloid pathology in patients with a clinical diagnosis of AD-type dementia was found to be 88% at the age of 70. The prevalence decreased with age, from 93% at the age of 50 to 79% at the age of 90. The prevalence was higher in carriers of the apolipoprotein E (APOE) ε4 allele, the major genetic risk factor for AD (97% at the age 50 to 90% at the age 90) than in subjects without the APOE ε4 allele (86% at the age 50 to 68% at the age 90). The prevalence of amyloid pathology in non-AD-type dementias was 51% in DLB, 30% in VaD and 12% in FTD (Ossenkoppele et al. Citation2015). Concomitant AD pathology may occur in about 25% of patients with PDD (Irwin et al. Citation2012). Amyloid pathology in these individuals may be an indication of clinical misdiagnosis or may be present as a secondary pathology.
Risk factors for dementia
Both genetic and environmental factors predispose to dementia and the interplay between the various risk factors in these disorders still needs clarification.
The most commonly reported risk factors for AD-type dementia are advanced age (Matthews and Brayne Citation2005), presence of the APOE ε4 allele (Morris et al. Citation2010), female sex (Brookmeyer et al. Citation1998), low educational level (Ott et al. Citation1995; Evans et al. Citation1997), cardiovascular disease (Hofman et al. Citation1997; Luchsinger et al. Citation2005; Bellou et al. Citation2016) and diabetes mellitus type 2 (T2DM) (Carlsson Citation2010). Indeed, a growing body of evidence, summarised recently in (Riederer et al. submitted), shows that T2DM is a risk factor for both, AD and VaD, based on pathology of glucose utilisation. This pathology is the consequence of a disturbance of insulin-related mechanisms leading to a brain insulin resistance. Although the underlying pathological mechanisms for AD and VaD are different in many aspects, the contribution of T2DM and insulin-resistant brain state to cerebrovascular disturbances in both disorders cannot be neglected. Therefore, early diagnosis of metabolic parameters including those relevant for T2DM is required. Moreover, it is possible that therapeutic options utilised today for diabetes treatment may also have an effect on the risk for dementia.
Age and the APOE ε4 allele are also risk factors for amyloid pathology in non-demented individuals. However sex, educational level and vascular pathology are not associated with amyloid pathology (Jansen et al. Citation2015; Vemuri et al. Citation2015). These risk factors may therefore contribute to AD-type dementia through non-amyloid-related mechanisms.
In VaD, age is also the most important risk factor, doubling the risk of the disease every 5.3 years (Jorm and Jolley Citation1998; O’Brien and Thomas Citation2015). Stroke is a strong risk factor increasing the risk for VaD by 10–30% (Pendlebury and Rothwell Citation2009). Cardiovascular disease and other vascular risk factors such as smoking and diabetes may predispose to VaD as well (Hofman et al. Citation1997; Luchsinger et al. Citation2005; Bellou et al. Citation2016).
Risk factors for DLB include a history of anxiety, depression, stroke or a family history of PD, and APOE ε4 allele (Boot et al. Citation2013; Tsuang et al. Citation2013). Also, DLB is more common in men than in women (Walker, Possin, et al. Citation2015).
For FTD, mutations in the C9orf72 gene are the most common genetic cause (DeJesus-Hernandez et al. Citation2011) followed by MAPT and GRN mutations (Rademakers et al. Citation2012).
For Parkinson’s dementia, age (Pringsheim et al. Citation2014), male sex (de Lau and Breteler Citation2006), a history of anxiety or depression and environmental factors such as pesticide exposure, head injury and rural living (Noyce et al. Citation2012) are among suggested risk factors. Additionally, the APOE ε4 allele may independently influence the risk of dementia in PDD (Irwin et al. Citation2012, Citation2017).
CSF biomarkers of AD and their diagnostic-relevant interpretation
The early diagnosis of AD, especially in the prodromal phase, remains difficult if only clinical symptoms are taken into consideration (Dubois et al. Citation2007; Aluise et al. Citation2008). This is reflected in general low accuracy of the clinical AD diagnostic methods in the absence of biomarker information. For logical reasons, the earlier stage of the disease, the lower is the accuracy of clinical diagnosis.
As reviewed later in this paper, two neuropathologic features are consequently found in the brains of patients with AD: extracellular plaques composed of amyloid β (Aβ) peptides, and intracellular neurofibrillary tangles containing hyperphosphorylated Tau proteins (Braak and Braak Citation1991b). Therefore, it is not surprising that these two groups of molecules are the most established biomarkers of the disease.
Neurochemical dementia diagnostics (NDD)
Amyloid precursor protein and its metabolites
Amyloid plaques are composed mainly of the peptides derived from the enzymatic cut of β-amyloid precursor protein (APP) (Kang et al. Citation1987). This transmembrane protein is encoded in humans by a gene on chromosome 21, and its alternative splicing results in at least three isoforms, with the form known as APP 695 (i.e. the one consisting of 695 amino acid residues) expressed predominantly in the brain (Panegyres Citation1997). The physiological role of APP is not clear so far; however, an involvement in cell-to-cell and matrix interactions is postulated. Enzymatic processing of APP by β-secretase(s) followed by γ-secretase(s) leads to the release of several forms of Aβ peptides. Interestingly, the discovery of the Aβ peptides ending at different C termini leads to a conclusion that different γ-secretase activities may exist (Citron et al. Citation1996; Klafki et al. Citation1996); however, as an alternative explanation a different mechanism is postulated of the dependency of the cleavage site from the length of the intramembrane APP domain (Lichtenthaler et al. Citation2002). APP can also be processed by α-secretase, which results in the release of soluble APPα but not Aβ peptides in the so-called ‘non-amyloidogenic pathway’.
Interestingly, not only full-length Aβ peptides (i.e. these having aspartic acid at the N terminus position of 1) but also N-terminally shortened forms seem to play a role in the pathophysiology of AD. Truncated fragments (Aβ11–42 and Aβ17–42) are also found in amyloid plaques and in the preamyloid lesions of Down syndrome, a disease-model for early-onset AD study. Very little is known about the structure and activity of these smaller peptides, although they could be the primary AD and Down syndrome pathological agents. With atomic force microscopy, channel conductance measurements and calcium imaging, Jang et al. (Citation2010) showed that non-amyloidogenic Aβ9–42 and Aβ17–42 peptides form ion channels with loosely attached subunits and elicit single-channel conductance. Although definitely interesting from the pathophysiologic point of view, the diagnostic role of the N-terminally shortened Aβ forms as potential AD biomarkers remains unclear.
In vitro, Aβ peptides can be metabolised by several enzymes; animal studies in vivo concentrated mostly on two groups of enzymes, insulin degrading enzyme (IDE) and neprilysin. Particularly the role of IDE in the degradation of Aβ peptides seems to be very interesting from the pathophysiologic point of view, since it links two degenerative diseases, AD and T2DM. Indeed, diabetes is one of the risk factors to develop AD (Carlsson Citation2010). Increasing insulin level in human subjects increases the concentration of Aβ in the CSF (Taubes Citation2003; Watson et al. Citation2003; Karczewska-Kupczewska et al. Citation2013), which might be explained by the fact that IDE more efficiently degrades insulin than Aβ peptides or that insulin competes with Aβ peptides.
Numerous studies reported decreased CSF concentration of Aβ peptides ending at the C terminus of 42 (Aβ42) in AD patients ((Lewczuk, Esselmann, Groemer, et al. Citation2004; Shaw et al. Citation2011), and reviews: (Blennow et al. Citation2006; Lewczuk and Kornhuber Citation2011)), whereas the total level of the Aβ peptides remains unchanged (Motter et al. Citation1995). Mechanisms leading to the decreased concentrations of Aβ42 in CSF in AD are not clarified so far. Accumulation of the peptide in the plaques is suggested by some investigators; however, this hypothesis cannot explain the results of a selective decrease of the concentration of Aβ42 in the CSF of the subgroup of patients with Creutzfeldt-Jakob disease (CJD) who did not develop any amyloid plaques at all (Wiltfang et al. Citation2003). Similarly, decreased levels of CSF Aβ42 were recorded in bacterial meningitis (Sjögren et al. Citation2001), a disease which may cause chronic memory deficits but does not present with Aβ plaques, which can be explained by increased degradation of all Aβ peptides by infiltrating inflammatory cells in meningitis (Portelius et al. Citation2017).
Spies et al. (Citation2012) systematically reviewed potential mechanisms leading to the decrease of Aβ42 CSF concentrations in AD. One of the theoretically possible explanations could be a hypothetical decrease in the Aβ generation. This could be, for example, due to the decreasing number of neurons releasing Aβ peptides into the brain parenchyma proportional to the degree of neurodegenerative pathology. This, however, stays in disagreement with the increased load of the Aβ42 in the brain tissue (Lewczuk et al. Citation2003). Moreover, in such a scenario, not only Aβ42 but also other isoforms (including the two most abundant Aβ peptides in the human CSF, Aβ40 and Aβ38), should have in AD decreased CSF concentrations, which is not the case. Further counterargument is the decreased Aβ42 concentration in familial AD as well as in Down syndrome, diseases characterised by genetically-driven overproduction of Aβ peptides (Tapiola et al. Citation2001). Moreover, some (Lewczuk, Kamrowski-Kruck, et al. Citation2010; Lewczuk et al. Citation2012), but not all (reviewed in Olsson et al. Citation2016), studies show that the CSF concentrations of the soluble APP are actually increased in the CSF of AD and MCI-AD patients, and taking into consideration that sAPPβ and Aβ peptides (including Aβ42) are released in the same metabolic pathway, it is difficult to accept that the reduction of the Aβ42 concentration is caused by the decrease in its production.
Another mechanism leading to decreased Aβ42 concentrations in the CSF of AD might be its increased degradation. This increased degradation, however, should affect not only Aβ42 but also other Aβ peptides, at least Aβ40, since it is known that both peptides are largely metabolised by the same enzymes, for example by IDE, as mentioned earlier, and that the efficiency of IDE to degrade Aβ1–40 and Aβ1–42 is very similar (Perez et al. Citation2000). Moreover, increased degradation of Aβ42 should lead to the decrease of the formation of Aβ42 deposits in the brain parenchyma, and should hamper formation of the plaques. Since this is not the case, one can assume that the hypothesis of the increased degradation cannot explain decreased Aβ42 concentrations in AD.
The next potential explanation of the decreased Aβ42 CSF concentrations in AD is its increased clearance from the brain tissue to the blood across the blood–brain barrier. This mechanism would lead to the decreased amount of the Aβ42 molecules in the brain parenchyma, which would mean that correspondingly less Aβ42 molecules could enter the CSF. As a matter of fact, Aβ peptides are actively transported across the blood–brain barrier by the lipoprotein receptor-related protein. Some investigators found increased expression of this transporter in perivascular cells in response to Aβ42, but not Aβ40, in vitro; however, uptake of Aβ42 by these cells resulted in their degeneration (Wilhelmus et al. Citation2007). On the other hand, the expression of lipoprotein receptor-related protein was found decreased in AD by other studies, whereas mechanisms of the Aβ transport from the blood to the brain were found upregulated (Deane et al. Citation2009). Moreover, we (Lewczuk, Kornhuber, et al. Citation2010) as well as other investigators (van Oijen et al. Citation2006; Graff-Radford et al. Citation2007) found decreased Aβ42 concentrations and/or Aβ42/40 ratios in the blood of AD patients or subjects at AD risk, which is another argument against the clearance of parenchymal Aβ42 into the blood as a cause of the CSF Aβ42 concentration decrease. On the other hand, blood concentrations of Aβ peptides result not only from the peptides’ influx, but are also influenced by other factors, such as binding to blood proteins or clearance mechanism existing in blood.
Finally, there is a very interesting, however not yet proven, hypothesis that the CSF concentrations of Aβ42 in AD patients only seems decreased, because the accumulation of Aβ42 monomers into soluble oligomers leads to masking of the epitopes for the antibodies used in the ligand-based analytical methods. Indeed, in favour of this hypothesis, a recently published study reported increased concentrations of Aβ oligomers in the CSF of AD patients (Wang-Dietrich et al. Citation2013). In favour of this hypothesis, Aβ1–42 showed similar concentrations in AD and controls when the CSF samples were denaturated before the measurements (Slemmon et al. Citation2012).
Irrespective of the cause of decreased Aβ1–42 concentration in CSF, sensitivity and specificity of Aβ1–42 alone to distinguish AD from elderly controls were 78% and 81%, respectively, in the study of Hulstaert et al. (Citation1999), and Galasko et al. (Citation1998) reported similar figures of 78% and 83% for sensitivity and specificity, respectively. In a recent large-scale meta-analysis, average Aβ42 ratio between AD and controls was 0.56, and between cohorts with MCI due to AD and those with stable MCI was also strong (0.67). In 130 out of 131 studies considered in this meta-analysis, CSF Aβ42 concentration was decreased in AD compared to the controls (Olsson et al. Citation2016).
Hypothesis-driven evidence suggests that the concentration of Aβ1–42 depends not only on the physiologic status of a given individual (presence or absence of AD pathology) but also on the total amount of Aβ peptides in the CSF. This perhaps reflects different efficiency of the processing of the APP molecules by β- and γ-secretases or perhaps differences in the expression profile of the APP molecules on the cell surfaces. Indeed, the range of the CSF sAPP concentrations spans 4–6-fold in different subjects, which indirectly suggests the corresponding differences in their activities of α- and β-secretases (Lewczuk, Kamrowski-Kruck, et al. Citation2010; Lewczuk et al. Citation2012). Better diagnostic performance of the Aβ42/40 ratio compared to the Aβ1–42 concentration might then be explained by the assumption that the subjects with either extraordinary low or extraordinary high concentrations of total Aβ peptides in the CSF characterise also with the respectively low or high Aβ1–42 (Wiltfang et al. Citation2007). In such a case, a normalisation of the Aβ1–42 concentration by the application of the Aβ42/40 ratio, instead of the Aβ1–42 alone, improves the interpretation of the biomarkers. Correspondingly, the normalisation of the Aβ1–42 concentration for the total Aβ peptides CSF concentration (or their most abundant isoform, i.e. Aβ1–40), in a form of an Aβ42/40 concentration ratio can improve the sensitivity and the specificity of the AD diagnosis. Indeed, we (Wiltfang et al. Citation2007; Lewczuk, Lelental, et al. Citation2015), as well as others (Hansson et al. Citation2007; Spies et al. Citation2012), found better clinical performance of the CSF Aβ42/40 concentration ratio compared to the concentration of Aβ1–42 alone. Recently, this same conclusion was reached by two other research groups (Beaufils et al. Citation2013; Slaets, Le Bastard, Martin, et al. Citation2013). Improved performance of the CSF Aβ42/40 ratio as compared with Aβ1–42 alone was also shown when Aβ species were analysed by mass spectrometry (Pannee, Portelius, et al. Citation2016). In other words, neglecting Aβ42/40 as an AD biomarker leads to a false-negative (in the case of an AD subject with high Aβ CSF concentrations) or a false-positive (in the case of a non-AD subject with low Aβ CSF concentrations) interpretation.
Furthermore, as it will be discussed in the chapter on Aβ-PET studies, Aβ42/40 ratio seems to correlate better than Aβ1–42 with amyloid β load in the brain (Janelidze, Zetterberg, et al. Citation2016; Lewczuk et al. Citation2017).
Two further experimental observations support the application of the Aβ42/40 ratio for AD diagnostics: (a) Aβ42/40 is less prone to the error of misinterpretation when non-polypropylene test tubes (as are often found in standard clinical lumbar puncture trays) are used to collect CSF (Lewczuk, Beck, et al. Citation2006), likely due to the fact that both Aβ isoforms seem to absorb to the tube surface to a similar extent (Willemse et al. Citation2017); and (b) two studies using a different set of enzyme-linked immunosorbent assay (ELISA) values (produced by a currently non-existing vendor and based on N-terminally non-specific antibodies) that have applied the Aβ42/40 ratio to predict AD in MCI subjects (Hansson et al. Citation2007) and discriminate early symptomatic AD from controls (Lewczuk, Esselmann, Otto, et al. Citation2004) reported almost identical Aβ42/40 cut-offs (0.095 and 0.098, respectively), whereas the corresponding cut-offs for Aβ42 alone differed by more than 15% (640 and 550 pg/ml, respectively).
Also, in a recent study by Dorey et al. (Citation2015) investigating the performance of these markers for correspondence with clinical diagnosis, CSF Aβ40 concentrations were higher in AD than non-AD patients, and inclusion of CSF Aβ40 as an Aβ42/40 ratio corrected 76.2% of misinterpreted cases in AD patients with normal CSF Aβ42 concentrations and 94.7% of cases when Aβ40 was used alone.
Tau protein and its phosphorylated forms
Tau proteins belong to the family of microtubule-associated proteins found in neuronal and non-neuronal cells (reviewed in (Buee et al. Citation2000)). The human Tau-gene is located on the long arm of chromosome 17. Its alternative splicing leads to formation of six isoforms of the protein in adult human brain: 4R2N, 3R2N, 4R1N, 3R1N, 4R0N and 3R0N, ranging from 352 to 441 amino acid residues (Mandelkow et al. Citation2007), whereas longer isoforms, resulting from the expression of the exon 4a, which is not transcribed in the CNS, exist in the peripheral nervous system (Cairns et al. Citation2004). Physiological role of Tau is still not fully understood. Some studies suggest that they play role in neuronal microtubule stability but there are controversies. Tau proteins are also involved in promoting microtubule nucleation, growth and bundling, and it is hypothesised that phosphorylation of the Tau molecule is an important factor in regulating Tau-microtubule interaction (reviewed in Shahani and Brandt Citation2002). The phosphorylation status of Tau is considered to change during development, with a relatively high degree of phosphorylation during the foetal phase followed by a steady decrease with age, possibly as a result of phosphatase activation (Mawal-Dewan et al. Citation1994; Rosner et al. Citation1995). Total Tau protein concentration has been extensively studied as an unspecific marker of neuronal damage in neurodegeneration.
Concentrations of total Tau, and its hyperphosphorylated form (notably at threonine 181, pTau181) in the CSF are elevated ∼2-fold in individuals with AD (Olsson et al. Citation2016). Levels of these CSF biomarkers are positively correlated with neurofibrillary tangle (NFT) pathology observed at autopsy (Tapiola et al. Citation1997; Buerger et al. Citation2006). Total Tau measured in the CSF is thought to reflect the intensity of neuronal damage and degeneration, and its concentrations can be increased across multiple degenerative conditions including stroke, VaD, head trauma, CBD, greatly in CJD, and to a lesser degree in certain variants of FTD (Blennow et al. Citation2010; Andreasson et al. Citation2014). It needs to be stressed that the meaning of Tau concentrations in CSF is much less well established than CSF Aβ; however, more profound discussion of this matter is beyond the scope of this paper. For example, it has been reported that neurons secrete Tau in an activity-dependent manner and that increased release of Tau could be induced by AD-associated factors, potentially also in the absence of neuronal death and tangle pathology (Yamada et al. Citation2011).
While the increase in the total Tau CSF concentration is considered to reflect unspecific disruption of the nerve cells, abnormal hyperphosphorylation of Tau is considered more specific for AD (Iqbal et al. Citation1986), and hyperphosphorylated molecules of Tau form neurofibrillary tangles (Grundke-Iqbal et al. Citation1986). Tau can be phosphorylated at 79 putative amino acid positions, serine and threonine being predominant. In studies available so far, mean sensitivity and specificity of Tau phosphorylated at different positions varied from 44% to 94%, and 80% to 100%, respectively (Blennow et al. Citation2001).
In AD cohorts CSF total Tau and pTau levels are highly positively correlated and sometimes used interchangeably. Reports of the effects of APOE genotype on CSF Tau levels have been inconclusive, likely reflecting differences in the disease stage of individuals in the different studies. Elevations in CSF Tau (and pTau) in MCI cases and cognitively normal older individuals are associated with a longitudinal risk to develop AD dementia, providing in vivo evidence of their utility in defining pre-clinical stages of AD (Blennow et al. Citation2010; Vos et al. Citation2013). Cross-sectional studies have shown that CSF Tau and pTau181 concentrations increase with disease progression, and these levels positively correlate with cognitive impairment (Blennow et al. Citation2010; Bateman et al. Citation2012). However, more recent studies that evaluate within-person longitudinal change over time suggest that Tau levels may actually decrease in symptomatic cases of autosomal-dominant AD (ADAD) (Fagan et al. Citation2014) and late-onset AD (LOAD) (Toledo, Xie, et al. Citation2013). The study with the longest time between repeated sampling shows no clear changes in CSF Tau levels over 4 years (Mattsson, Portelius, et al. Citation2012). The potential causes of declines in CSF markers of Tau late in the course of the disease are still being explored; such patterns have implications for clinical trials that use changes in CSF biomarkers as potential endpoints.
Diagnostic-oriented interpretation
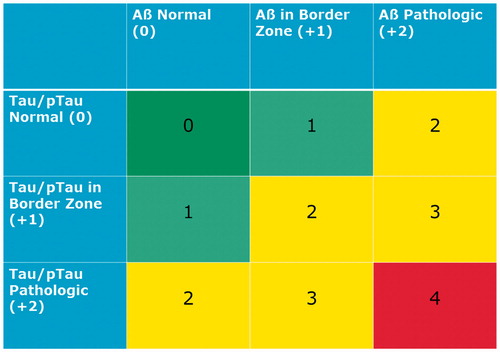
A simple ‘copying-and-pasting’ of laboratory reference ranges of the AD biomarkers from one diagnostic centre to another should be avoided (Lewczuk, Kornhuber, et al. Citation2006; Molinuevo et al. Citation2014); on the other hand, a need to improve the comparison of the results (and even more importantly, their interpretation) between laboratories led to propose an interpretation algorithm that could be easily implemented in clinical neurochemistry routine (Lewczuk et al. Citation2009; Lewczuk, Kornhuber, et al. Citation2015) (). In brief, depending on the concentrations of the biomarkers, the numeric score is given, and the final sum (in the range 0–4 points) defines the categorisation of a given patient into one of the groups with different probability of AD pathology, which is eventually presented to the physician on the CSF integrated report. The algorithm is method unspecific, which means that the assays to measure biomarkers of the Aβ and Tau groups can be replaced by assays based on different sets of antibodies (from other manufacturers) or even other analytical platforms. If the results of Aβ and Tau/pTau are pathological, the overall result is interpreted as neurochemically probable AD. Results of the NDD analysis with all biomarkers in normal ranges are interpreted as no neurochemical evidence of organic CNS disease. Results in between, either with normal Tau/pTau and abnormal Aβ, or vice versa, pathological Tau/pTau and normal Aβ, are interpreted by the Erlangen Score Algorithm as neurochemically possible AD. The isolated very high concentration of Tau is interpreted as suspected rapidly progressing neurodegeneration, improbable AD, but this same concentration of Tau accompanied by pathological Aβ concentrations/ratio would shift the interpretation to possible or even probable AD depending if pTau is normal or not, respectively. Indeed, the diagnostic recommendations published by the National Institute on Aging 2 years after the publication of the Erlangen Score Algorithm (McKhann et al. Citation2011) use almost the same wording and very similar interpretational concepts.
Figure 1. Erlangen Score. Erlangen Score is the sum of the scores for Aβ biomarkers (0, normal; 1, borderline pathological; 2, pathological) and Tau/pTau biomarkers (0, normal; 1, borderline pathological; 2, pathological), always in relation to a given laboratory’s cut-offs. Depending on the total score, NDD is interpreted as: 0, neurochemically normal; 1, AD neurochemically improbable; 2–3, AD neurochemically possible; 4, AD neurochemically probable. The original algorithm was modified by excluding cases with very high Tau concentrations, which points at rapidly progressing neurodegeneration (for example, CJD).
Early (pre-dementia) diagnosis
Results from the large-scale longitudinal studies and meta-analyses show that the CSF alterations typical for AD have good diagnostic accuracy of more than 80% in discriminating MCI subjects who would convert to AD from those who remain stable or would progress to other dementias (Hansson et al. Citation2006; Mattsson et al. Citation2009).
As a matter of fact, CSF alterations are, at least currently, the first that can be observed in the disease process. A combination of three CSF biomarkers, namely Tau, pTau181 and Aβ42, could detect incipient AD among patients fulfilling the criteria for MCI with a sensitivity of 68% (95% CI 45–86%) and a specificity of 97% (95% CI 83–100%), therefore suggesting a hope to discriminate the subgroup of patients with MCI who would eventually develop AD from these who would not to offer early treatment for the subjects at risk (Zetterberg et al. Citation2003). In a more advanced study from the same research group (Hansson et al. Citation2006), 137 MCI patients, who underwent lumbar puncture (LP) at a baseline, were followed clinically for 4–6 years, together with 39 healthy individuals that were cognitively stable over 3 years thus serving as controls. The combination of CSF Tau and Aβ1–42 at baseline in this study yielded a sensitivity of 95% and a specificity of 83% for the detection of the incipient dementia due to AD in patients with MCI, showing increased relative risk of progression to AD in MCI cases with pathological Tau and Aβ1–42 at the baseline (hazard ratio (HR) 17.7, P < 0.0001). The combination of Tau and Aβ1–42/pTau181 ratio yielded closely similar results (sensitivity 95%, specificity 87%, HR 19.8). In a similar study, the cut-off levels of Aβ1–42 and pTau181 derived from the differential analysis of early dementia patients, and applied unaltered on the results obtained in the MCI group, allowed definition of a subgroup of subjects without AD but with increased risk to develop the disease (Lewczuk and Wiltfang Citation2008).
A model of the dynamics of the alterations of the biomarkers in the course of AD was proposed by Jack et al. (Citation2010). The first alterations characteristic for AD occur in the amyloid β pathway, and can be observed as the decreased concentrations of Aβ42 in the CSF and/or deposition of Aβ plaques in the brain on the Aβ-PET scan in an early pre-clinical phase. Neuropathological findings of significant Aβ depositions in the brains of cognitively normal persons, discussed above, further support the concept that the Aβ pathology precedes clinical symptoms (Knopman et al. Citation2003). Increase in the CSF Tau concentrations occurs later and even perhaps as a consequence of the accumulating Aβ pathology. Indeed, there is evidence that the extracellular Aβ depositions in AD influence the clearance of Tau released from dying neurons (Ballatore et al. Citation2007). At the stage of the disease when the first clinical symptoms are observable, i.e. in MCI, the intensity of the Aβ pathology does not correlate with the clinical and cognitive symptoms, and only weak correlation of Tau concentrations with the cognitive functions are observed (Lewczuk, Esselmann, Otto, et al. Citation2004; Vemuri et al. Citation2009), which further support the hypothesis that Aβ, and to a lesser degree Tau, reach plateau before the onset of the first clinical symptoms.
Blood-based biomarkers
Although CSF and neuroimaging biomarker modalities offer excellent diagnostic accuracy and can be key considerations in differential diagnostic procedures, as well as understanding co-morbid neuropathology, blood-based biomarkers offer important advantages over CSF and neuroimaging biomarkers of being (a) less invasive, (b) more acceptable to patients, (c) cost-effective, (d) time-effective and, importantly, (e) feasible at the population level (Lista et al. Citation2013; O’Bryant, Edwards, et al. Citation2016). Therefore, blood-based biomarkers offer an ideal complementary step to advanced CSF and neuroimaging biomarkers and can serve as the first-step in a multi-stage process (Henriksen et al. Citation2014; O’Bryant, Edwards, et al. Citation2016) similar to the procedures utilised in other disease states (e.g. cancer, cardiovascular disease, infectious disease). Such a multi-stage model can significantly facilitate appropriate referrals to CSF and neuroimaging biomarkers in addition to providing a path towards securing reimbursement approval from key payers.
In order to best understand the putative uses of blood-based biomarkers in AD, it is prudent to first outline key potential contexts of use (COU) of these biomarkers that have potential for improving patient outcomes (O’Bryant et al. Citation2017). The FDA/NIH BEST Resource defines COU as ‘a statement that fully and clearly describes the way the medical product development tool is to be used and the medical product development-related purpose of the use’ (F-NBW Group Citation2016). Explicitly defining the COU with the end goal in mind guides the entire development programme of the biomarker itself; however, a key limitation to the research field has been the lack of explicit outlining of these potential COUs which results in continuous discovery studies that rarely move beyond initial clinical replication. The fit-for-purpose validation methods should be utilised to determine if the level of validation associated with the biomarkers is sufficient to support the COU. With this in mind, the primary themes receiving the most attention in AD blood-based biomarker research can be divided into key COUs as follows:
AD blood-based diagnostic test (diagnostic biomarker)
Primary care tool for a multi-stage diagnostic process (diagnostic biomarker)
Blood-based tool for predicting future risk of AD (predictive biomarker)
Blood-tool for predicting risk for AD among cognitively normal adults
Blood-tool for predicting conversion from MCI to AD
Blood biomarker for predicting progression among AD cases
Additional COUs that have been studied to a lesser degree, but are as important as those above include:
Blood biomarker for stratification into clinical trials
Blood biomarkers for predicting treatment response to therapeutics (i.e. companion diagnostic)
Of note, many of these putative COUs align closely with the categories of biomarkers outlined by the FDA/NIH BEST Resource (F-NBW Group Citation2016): (a) susceptibility/risk biomarker, (b) diagnostic biomarker, (c) monitoring biomarker, (d) prognostic biomarker, (e) predictive biomarker, (f) pharmacodynamics/response biomarker, and (g) safety biomarker.
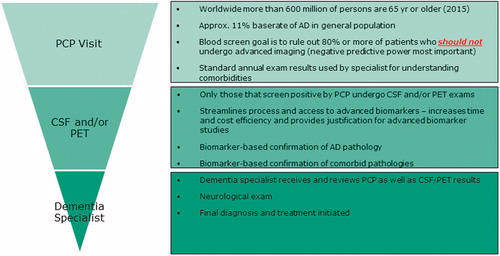
As an illustrative example to outline the importance (clinical and financial) and feasibility one of the above-mentioned COUs is provided in . Here the multi-stage diagnostic process beginning with a blood-based tool in primary care is outlined. In this scenario, a blood-based tool would be utilised to screen out those who should not be referred for additional services, which will have multiple benefits: (a) patients concerns will be eased, (b) CSF and PET facilities will not be overrun by those not needing services and (c) not providing advanced diagnostic services to those who do not need them will result in billions of saved dollars. This structure can pave the path for seeking regulatory and reimbursement approval for many advanced diagnostic procedures as well as the use of multiple such procedures (e.g. CSF and PET) among those complicated cases with high likelihood of multiple neurodegenerative diseases.
Figure 2. Conceptual overview of multi-stage neurodiagnostic process beginning with blood screen in primary care setting.
Diagnostic COU research
The most studied potential COU for blood-based biomarkers in AD are diagnostic biomarkers. Individual marker analyses of plasma amyloid, Tau, neurofilament light (NF-L) and others, have been examined (Bacioglu et al. Citation2016; Olsson et al. Citation2016); however, current data suggest that these markers are not sufficient to fill this particular COU. In a seminal study, a 120 plasma protein-based algorithm accurately distinguished AD patients from healthy controls (89% accuracy) (Ray et al. Citation2007); however, enthusiasm waned when the findings did not cross-validate on an independent assay platform (Soares et al. Citation2009). Researchers from the Australian Imaging, Biomarkers and Lifestyle (AIBL) group generated an 18-marker plasma-based panel that discriminated AD from controls with high accuracy and replicated those findings in the Alzheimer’s Disease Neuroimaging Initiative (ADNI) cohort (Doecke et al. Citation2012). Work from Washington University St. Louis and University of Pennsylvania suggested strong signals for a plasma-based algorithm for this COU utilising the same Luminex-based multiplex platform utilised in AIBL, ADNI and TARCC initial discovery studies (Hu et al. Citation2012). A series of studies have been conducted examining the potential utility of autoantibodies in discriminating AD and other neurodegenerative diseases from controls yielding excellent accuracy (areas under the curve (AUC) ≥ 0.90) (Nagele et al. Citation2011; DeMarshall et al. Citation2015, Citation2016). A series of studies has recently been conducted explicitly related to this COU (O’Bryant et al. Citation2010; O’Bryant et al. Citation2014; O’Bryant, Edwards, et al. Citation2016). Initial discovery work was conducted using a Luminex-based research use only (RUO) platform that identified a 108-protein signature that was highly accurate in discriminating AD (n = 197) from controls (n = 203, AUC = 0.95) (O’Bryant et al. Citation2010), which was subsequently refined to the top 30 markers that retained excellent accuracy (AUC = 0.95) (O’Bryant et al. Citation2011b), and subsequently replicated on an electrochemiluminescence platform (AUC = 0.98) (O’Bryant et al. Citation2014). This work has been replicated across cohorts (O’Bryant et al. Citation2011a), ethnicities (O’Bryant et al. Citation2013; Edwards et al. Citation2015; Villarreal et al. Citation2016), species (O’Bryant et al. Citation2014) (mouse and human) and tissue (O’Bryant et al. Citation2014) (serum, plasma, brain).
Most recently, a ‘locked-down’ referent sample was generated (O’Bryant, Edwards, et al. Citation2016) for an AD blood test in primary care per Institute of Medicine guidelines that is currently being directly applied prospectively to newly collected community-based older adults and elders. It is anticipated that CSF and PET biomarkers will be the confirmatory diagnostic biomarkers of AD (as well as pre-clinical AD) and that the most clinically useful COU for blood-based biomarkers within the diagnostic realm will be to serve as the first-step in a multi-stage diagnostic process (O’Bryant, Edwards, et al. Citation2016). There are currently over 500 million older adults around the globe. Given the cost of PET and CSF (still far less than PET) relative to blood-based methods, the availability of a blood-based tool in primary care settings that is utilised to determine who does not undergo PET and CSF exams provides a viable strategy similar to the strategies that have successfully navigated the regulatory and reimbursement hurdles in the cancer arena (i.e. PET scans are not first-line diagnostics) (Gold et al. Citation2012). Such a strategy could rapidly be scaled to provide a test within routine clinical practice, although only scalable and cost-effective blood-based biomarkers have the potential for achieving this COU. That is, if a blood-based tool is not a fraction of CSF and PET biomarkers, it will have little chance of meeting the global needs.
A tightly related COU to that of diagnostics is the search for a blood-based biomarker for detecting amyloid pathology. This putative COU has been examined in both the AIBL and ADNI cohorts. In the AIBL study, a plasma-based nine-analyte signature that yielded a sensitivity and specificity of 0.80 and 0.82, respectively for detecting PET-based amyloid positivity (Burnham et al. Citation2014). In a study of 96 ADNI participants, a significant relationship between plasma amyloid and [11C]PIB uptake among APOE ε4 non-carriers was identified (Swaminathan et al. Citation2014). In a different sample seven plasma proteins (including A2M, Apo-A1 and multiple complement proteins) were significantly associated with amyloid burden (Westwood et al. Citation2016). In a pilot study of 40 PIB-positive individuals (controls, MCI, AD) along with 22 PIB-negative individuals (controls), plasma amyloid proteins (Aβ40, Aβ42) and Aβ-approximate peptides (AβAPs; APP669–671) were significantly correlated with amyloid PET positivity with a sensitivity and specificity of 0.93 and 0.96, respectively (Kaneko et al. Citation2014). Although still very early in discovery phases, this COU has tremendous potential for influencing the design of clinical trials targeting amyloid.
Prognostic COU research
An important potential COU for blood-based AD biomarker science, which equally applies to CSF-based biomarkers, is the identification of individuals at greatest risk, which can take several forms: (a) risk of incident cognitive impairment and AD, (b) risk of progressing from MCI to AD dementia and (c) risk for progression within AD. Biomarkers related to these specific COUs have tremendous potential for clinical intervention trials aimed at preventing AD, halting progression from MCI, as well as slowing progression among patients with manifest AD. In the seminal article by Ray et al. (Citation2007), the AD detection algorithm identified patients with MCI who progressed to AD (81% accuracy). There have been some promising results from studies using extracellular vesicles (EVs) enriched for neuronal origin showing that EV biomarker may be abnormal in pre-clinical AD (up to 10 years before AD diagnosis) (Fiandaca et al. Citation2015; Kapogiannis et al. Citation2015), and may also be useful for predicting conversion from MCI to dementia (Winston et al. Citation2016). Baseline levels of plasma clusterin (ApoJ) was recently shown to predict risk for incident dementia and stroke among 1,532 non-demented subjects of the Framingham Study Offspring cohort (Weinstein et al. Citation2016). The topic of metabolomics has also been studied heavily within this COU recently with a signature of ten metabolites identified that predicted risk for incident MCI/AD with 90% or greater accuracy among community-dwelling older persons (Mapstone et al. Citation2014). A total of 202 participants were examined in the discovery phase and 295 in the validation phase. While this work suggests a signal to look at metabolomics for this potential COU, it has to be replicated (Casanova et al. Citation2016; Li et al. Citation2016). As in the diagnostic COUs, plasma proteomics have been studied within this COU. Recent work analysing plasma proteomics from 452 cognitively normal elders, 169 MCI non-converters, 51 MCI converters and 476 AD cases from across three independent cohorts, AddNeuromed (ANM), Kings Health Partners-Dementia Case Register (KHP-DCR) and Genetics AD Association (GenAD), a set of ten proteins was identified that predicted progression from MCI to AD (average time of conversion approximately 1 year, AUC = 0.78) (Hye et al. Citation2014). There are clear signals within potential prognostic COUs for AD using blood-based biomarkers, which can have a dramatic impact on clinical trial design. However, this work remains within the discovery stage with few replication studies conducted and most work continues to be conducted utilising RUO technology platforms and, therefore, significant work remains for movement of these discovery findings towards potential clinical use (O’Bryant et al. Citation2017).
Technological and methodological considerations
Peripheral biomarkers (blood or otherwise) of brain disorders present significant challenges with regards to standardisation, harmonisation, mass production (e.g. antibody based methods) and ‘locking down’ methods for transition to industry and clinical standards (e.g. CLIA, CLSI). One key advancement produced by the international Professional Interest Area on Blood-Based Biomarkers was the generation of the first-ever guidelines for pre-analytic processing of specimens (O’Bryant et al. Citation2015). This work provided a basic set of pre-analytic processing variables to be followed (and refined) and a minimum set of information that should be provided within publications to allow for appropriately designed cross-validation efforts. More recently, this workgroup published a novel paradigm for advancing biomarker discovery to clinic (O’Bryant et al. Citation2017). The working group also recently published work comparing blood biomarkers across platforms and tissue (plasma versus serum) with results highlighting that, while often statistically significantly correlated, biomarker levels obtained across different platforms or blood fraction (serum versus plasma) may not be comparable (O’Bryant, Lista, et al. Citation2016). There have been; however, recent technological developments in the RUO space that allow for the detection of markers at very low levels (Andreasson et al. Citation2016), and these novel technologies may provide substantial advantages if they are demonstrated to perform at clinical standards over time (e.g. CLSI, CLIA). As evident from the continued progress of the Global Biomarkers Standardization Consortium of CSF biomarkers (GBSC), the blood-based biomarker field will need to address additional methodological barriers in order to produce clinically useful and applicable biomarkers. It is noteworthy that most of the work within the AD blood-based biomarker space remains in early discovery stage with only a few laboratories replicating across cohorts and even fewer attempting to lock down methods for prospective studies. Another limitation is the use of discovery RUO-based platforms that do not perform within clinically required parameters. While broad-based discovery technologies offer significant advantages in early stages, it is imperative that these results be replicated on platforms that can be utilised as laboratory developed tests or in vitro diagnostics (IVD).
Potential diagnostic role of EVs in the blood
A recent approach to diagnostic biomarker discovery has been based on deriving extracellular vesicles (EVs) from peripheral blood and enriching them for neuronal origin. Given their origin, these EVs can presumably be used to interrogate brain pathogenic processes previously inaccessible in vivo, effectively akin to a ‘liquid biopsy’. A series of case–control studies have generated a candidate set of EV-based protein biomarkers for AD. The initial study focussed on the main pathogenic proteins, Aβ42, p181-tau, pS396-tau, which were all shown to be elevated in AD cases compared to controls, with the exception of total tau (Fiandaca et al. Citation2015). Since this initial study, other groups have shown similar elevations in these markers in relation to progression from MCI to dementia (Winston et al. Citation2016) and in Down syndrome (Hamlett et al. Citation2016). Subsequent studies focussed on important intracellular pathways implicated in AD pathogenesis and used plasma EVs enriched for neuronal origin to show significant differences in key molecules. It has been shown that neuronal origin-enriched EVs from AD cases show: a pattern of Ser and Tyr phosphorylation of the insulin receptor substrate 1 (IRS-1) suggesting the presence of brain insulin resistance (Kapogiannis et al. Citation2015); elevated lysosomal enzymes (cathepsin D, LC3) and ubiquitin suggesting lysosomal dysfunction (Goetzl et al. Citation2015b); decreased cellular survival factors (REST) suggesting impaired responses to cellular stress (Goetzl et al. Citation2015a); and decreased synaptic proteins suggesting synaptic degeneration (Goetzl, Kapogiannis, et al. Citation2016). Most of these markers did not track disease severity and were not associated with cognitive performance, except for some synaptic proteins (synaptopodin, synaptotagmin and synaptophysin) (Goetzl, Kapogiannis, et al. Citation2016). In a variation of this methodology, one study used antibodies against the glutamate transporter (GLAST) to derive plasma EVs enriched for astrocytic origin and found elevations in enzymes involved in APP cleavage (BACE-1, γ-secretase), Aβ42 and ptau (Goetzl, Mustapic, et al. Citation2016). Whereas the sensitivity and specificity of many of these biomarkers were not sufficient for clinical diagnosis (e.g. Goetzl et al. Citation2015a, Citation2015b), a subset (ptau, Aβ42, p-IRS-1) achieved impressive classification accuracy in these initial studies (Fiandaca et al. Citation2015; Kapogiannis et al. Citation2015) and can be selected for larger-scale replication studies. In addition to protein-based EV biomarkers, a recent study used AIBL samples to show that a set of 16 EV-derived miRNAs perform well in predicting AD (Cheng et al. Citation2015).
In summary, blood-based biomarkers have significant advantages that can be used to enhance the utility of CSF and imaging biomarkers. They are cost and time efficient, readily acceptable to patients and accessible globally for primary care implementation. While there is a substantial amount of work to support many putative blood-based biomarkers across a range of potential COUs, much of this work remains in early discovery phases and requires a great deal of additional work, especially validation studies in independent cohorts, before consideration within clinical settings.
Post-mortem findings in AD and other dementia disorders
The histopathological examination of the brain using modern molecular-biological methods under standardised conditions represents the ‘gold standard’ of diagnosis, although the frequent overlap of various processes and multimorbidity of the aging brain cause considerable diagnostic challenges (Jellinger and Attems Citation2015; Kovacs Citation2016).
Alzheimer’s disease
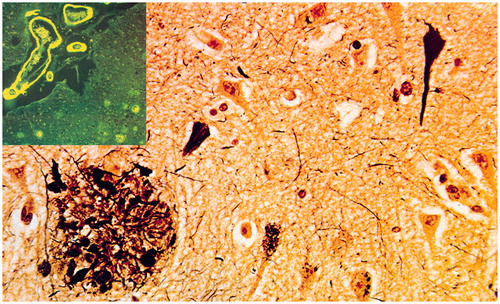
AD is morphologically characterised by the extracellular deposition of Aβ peptides (amyloid plaques, cerebral amyloid angiopathy) and accumulation of Tau protein within neurons (neurofibrillary tangles/NFT), dendrites (neuropil threads), and neuritic plaques in brain parenchyma, inducing defects of synaptic connections (). Current algorithms for the neuropathological diagnosis of AD are based on semi-quantitative assessment of plaques and NFTs and their age-adjustment in the CERAD protocol, topographic staging of neuritic/Tau pathology (Braak stages) and the progress and distribution of Aβ deposition which is different from Tau pathology. Combining the CERAD and Braak scores NIA-RI criteria relate dementia to AD-typical lesions with high, intermediate and low likelihood. The recent NIA-AA guidelines consider levels of AD pathology regardless of the clinical history (Montine et al. Citation2012). They include: (a) the recognition that AD pathology may occur in the absence of cognitive impairment; (b) an ‘ABC’ score of AD pathology incorporating assessments of Aβ plaques based on its phase (A), staging of NFTs based on the Braak staging system (B), and scoring of neuritic plaques based on semiquantiative assessment of at least five neocortical regions based on CERAD criteria (C); (c) more detailed approaches for co-morbid conditions, such as DLB, vascular brain injury and others. The NIA-AA guidelines distinguished pure AD from non-AD dementia and non-demented cases with a sensitivity of 71% and a specificity of 99%. However, these guidelines only consider the classical ‘plaque and tangle’ phenotype, and do not consider that AD neuropathology is heterogeneous, including subtypes, e.g. the limbic predominant or hippocampal sparing forms and primary age-related tauopathy (PART), previous tangle-predominant dementia, with Tau pathology mainly restricted to the limbic system (up to Braak stage IV), absence of Aβ pathology and low APOE ε4 frequency (Crary et al. Citation2014). AD in very old demented subjects differs in both intensity and distribution from that of younger age groups and there is considerable overlap between demented and non-demented oldest patients, and morphological differences exist between genetic/familial and sporadic AD (see Jellinger Citation2014).
Figure 3. Histological lesions in Alzheimer’s disease. Neurofibrillary tangles, neuropil threads, neuritic plaques (lower left) and amyloid angiopathy (upper left insert).
α-Synuclein aggregation disorders
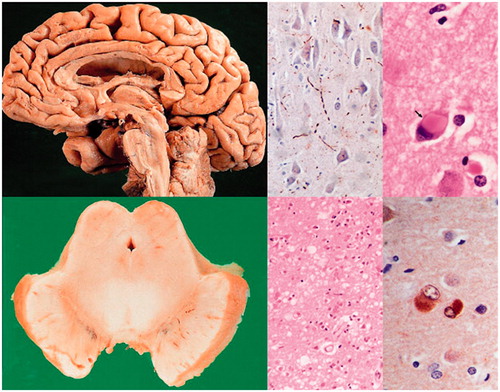
DLB shares many morphological features with PDD (). Staging systems are based on semi-quantitative assessment of α-synuclein (αSyn) pathology in specific brain regions, distinguishing six different stages (from olfactory bulb and brainstem to cortex) (Braak et al. Citation2006). DLB shows a variable mixture of αSyn and AD pathologies, which may act synergistically. In some studies, more than half of DLB brains had enough AD-like lesions to attain the pathological diagnosis of definite AD (Slaets, Le Bastard, Theuns, et al. Citation2013), but cognitive impairment may also be related to severe cortical and limbic αSyn pathology in the absence of significant AD pathology, although both pathologies may modify the clinical phenotype (Walker, McAleese, et al. Citation2015; Toledo et al. Citation2016).
Figure 4. Dementia with Lewy bodies. Diffuse brain atrophy (upper left), degeneration of substantia nigra (lower left), multiple Lewy bodies and Lewy neurites in brainstem and cerebral cortex (right).
Frontotemporal lobe degeneration (FTLD)
FTLD shows distinct patterns of progressive brain atrophy. Molecular correlates according to predominant protein aggregates are: microtubule-associated Tau protein (FTLD-Tau), TAR DNA binding protein-43 (FTLD-TDP-43), and fusion sarcoma protein (FTLD-FUS), but there are cases of overlapping pathology. Major genetic causes of FTLD are mutations in MAPT (Tau-gene), progranulin GRN and C9orf72, the latter being a common cause of FTLD and amyotrophic lateral sclerosis (FTLD-ALS). FTLD-TDP and ALS, but not FTLD-FUS, have properties of amyloid (Irwin et al. Citation2015; Kovacs Citation2016). Further details on the FTD neuropathology in the context of potential novel biomarkers are discussed in the FTLD section later in this paper.
Vascular dementia (cognitive impairment/VaD, VCI)
VaD, recently referred to as vascular cognitive disease includes a variety of cerebrovascular lesions, for which, due to the high variability of morphological findings and multifactorial pathogenesis, no generally accepted morphological criteria are available. Major types of VaD are multiple infarct encephalopathy, small-vessel and strategic infarct type dementia (microinfarcts in functionally important brain areas interrupting major neuronal circuitries), subcortical lacunae mainly involving basal ganglia; white matter lesions and microinfarcts (subcortical arteriosclerotic leukoencephalopathy Binswanger), large and small cerebral haemorrhages, hippocampal sclerosis; cerebral amyloid angiopathy (Kalaria Citation2016). Recent guidelines assessing 14 pathologies in 13 brain areas showed reproducible results but need further validation (Skrobot et al. Citation2016).
Mixed type neuropathology is diagnosed when a combination of various pathologies, in particular AD with cerebrovascular lesions and/or Lewy pathology is present, which occurs in up to 80% of elderly demented patients. Subcortical cerebrovascular lesions are more frequent in AD patients than in non-demented controls (Jellinger Citation2014).
Prion diseases (transmissible spongiform encephalopathies (TSE))
This rare fatal disorder characterised by tissue deposition of a misfolded isoform of the cellular prion protein, referred to as PrPSc, is subclassified according to morphological criteria. Human prion diseases include idiopathic forms (sporadic CJD, sporadic familial insomnia), inherited (genetic/familial) forms, e.g. Gerstmann-Sträussler-Scheinker disease (GSS), fatal familial insomnia) and acquired forms (variant CJD (transmission of bovine TSE to humans) and iatrogenic CJD (transmission of prions through pituitary hormones, transplantation of dura mater, cornea, etc.). Based on the histological lesions and genetic data, current classification of human prion diseases relates to the type, location and distribution of PrP deposits and plaques, and the molecular types, which allows a reliable identification of the different subtypes with high inter-laboratory accuracy (Kovacs Citation2016). Often prionopathy and AD-related pathology appear simultaneously (Tousseyn et al. Citation2015).
Rapidly progressive and early-onset dementias
Rapidly progressive dementia (RPD), being quickly fatal, is an important diagnostic problem. In addition to frequent prion diseases it includes rapidly progressing tauopathies and α-synuclein aggregation disorder, autoimmune infections, toxic-metabolic and neoplastic diseases. In patients with RPD, treatable disorders are frequently mistaken for CJD, and a rapidly progressive form of AD that may mimic CJD shows genetics and neuropathology that differ from classical AD, probably representing a distinct subtype of AD (Geschwind Citation2016).
In conclusion, neuropathology using harmonised definitions and standardised inter-laboratory methods, including quantitative assessment of essential lesions, can achieve a diagnosis or classification of dementia disorders in up to 90–95% of cases. In the majority of cases, except for those with known genetic or metabolic background, however, it may not be able to clarify the causes or aetiology of the particular disorder.
AD biomarkers in autopsy-confirmed cases
According to the Consensus Report of the Working Group on Molecular and Biochemical Markers of Alzheimer’s Disease, published in 1998, AD biomarkers should be able to detect a fundamental feature of the pathology. The diagnostic accuracy of biomarkers should also be documented in autopsy-confirmed dementia cases as the pathological diagnosis still is considered to be the reference standard.
As 4% of the more than 5,000 subjects whose CSF samples have been analysed since 2004 at the BIODEM lab at UAntwerp came to autopsy, it has been possible to set up validation studies in subjects with autopsy-confirmed diagnoses. Diagnostic performance was established for the core AD CSF biomarkers (Aβ1–42, Tau and pTau181) in 100 autopsy-confirmed dementia and 100 control subjects (Engelborghs et al. Citation2008). The existing model based on CSF Aβ1–42 and Tau aiming at discriminating AD dementia from control subjects (Hulstaert et al. Citation1999) were validated. The results obtained were very promising and showed that this model can identify all AD cases in the population (sensitivity, 100%; specificity, 90.72%). In an independent autopsy-confirmed cohort of AD patients and controls, the Tau/Aβ1–42 ratio resulted in sensitivity and specificity values of respectively 85.7% and 84.6% (Shaw et al. Citation2009). However, as discriminating AD from controls assumes a rather artificial clinical situation, new models were built (Engelborghs et al. Citation2008; Toledo et al. Citation2012; Toledo, Cairns, et al. Citation2013). It was shown that autopsy-confirmed dementia patients could be discriminated from controls with a sensitivity of 86% and a specificity of 89%; but, more importantly, Tau and Aβ1–42 optimally discriminated AD from pooled non-AD dementias and controls (sensitivity, 90%; specificity, 89%), and AD was optimally discriminated from non-AD using pTau181 and Aβ1–42 (sensitivity, 80%; specificity, 93%) (Engelborghs et al. Citation2008). Very comparable results were achieved in the OPTIMA cohort for the discrimination of AD from non-AD dementia patients, pTau/Aβ1–42 resulted in sensitivity and specificity values of, respectively, 88% and 100% (Seeburger et al. Citation2015). The Tau/Aβ1–42 ratio was shown to be useful to discriminate definite AD from FTLD subjects, too (Bian et al. Citation2008). A systematic literature review estimated the sensitivity and specificity values for CSF biomarkers to discriminate autopsy-confirmed AD from non-AD dementias at respectively 82% and 75% (Cure et al. Citation2014).
These studies have demonstrated the diagnostic value of each of the three AD CSF biomarkers and that sensitivity and specificity match the requirements as set forward by the Working Group on Molecular and Biochemical Markers of Alzheimer’s Disease (1998). It has been demonstrated in these autopsy-confirmed cohorts that the diagnostic accuracy of the AD CSF biomarkers is independent of the analytical platform (multi-analyte Luminex assay (INNO-BIA AlzBio3) in comparison to single-analyte ELISA tests (INNOTEST)) (Le Bastard et al. Citation2013; Struyfs et al. Citation2014).
In an extended cohort of 157 autopsy-confirmed AD and non-AD cases, of which 22 had a clinically ambiguous diagnoses, 18 out of 22 (82%) patients with clinically ambiguous diagnoses were correctly diagnosed using AD CSF biomarkers, meanwhile demonstrating the added diagnostic value of AD CSF biomarkers for differential dementia diagnosis (Le Bastard et al. Citation2010). Especially for differential dementia diagnosis, pTau181 is an essential component of the AD CSF biomarker panel (Koopman et al. Citation2009; Struyfs, Niemantsverdriet, et al. Citation2015).
As stated above, mixed pathologies can limit the diagnostic accuracy of the current AD CSF biomarker panel. A significant proportion of patients with DLB show AD co-pathology, plaques and neurofibrillary tangles. Autopsy-confirmed DLB patients with plaques showed lower CSF Aβ1–42 concentrations than DLB patients without plaques, but to the same degree as AD patients. So, concomitant amyloid pathology in DLB limits the use of Aβ1–42 for the differential diagnosis of AD versus DLB (Slaets, Le Bastard, Theuns, et al. Citation2013). However, when αSyn was added to the CSF biomarker panel, autopsy-confirmed AD patients could be discriminated from DLB patients, resulting in a sensitivity and specificity of 85% and 81%, respectively (Slaets et al. Citation2014). Also, as already mentioned previously in this paper, adding Aβ1–40 to the AD CSF biomarker panel improved the diagnostic accuracy from 74% to 80% to differentiate between (autopsy-confirmed) AD and non-AD patients (Slaets, Le Bastard, Martin, et al. Citation2013).
In case of atypical presentation of AD, suggesting CJD, determination of total CSF prion protein (t-PrP) levels is helpful, as CSF t-PrP concentrations were decreased compared with control participants and patients with AD. CSF t-PrP determination reached 82.1% sensitivity and 91.3% specificity to discriminate (autopsy-confirmed) CJD from AD patients (Dorey, Tholance, et al. Citation2015).
Genetic analyses in AD diagnostics
Genetic research has contributed systematically for more than 25 years to complete the genetic architecture of AD. In fact, genetic factors account for up to 80% of the attributable risk in common AD forms (Gatz et al. Citation1997; Gatz et al. Citation2006). This observation implicates genetic determinant probably in most of the pathophysiological pathways in AD. In other words, unravelling the genetics of AD offers probably one of the best ways to discover the underlying pathophysiological processes in AD. This genetic journey started in the early 1990s with the discovery of fully penetrant mutations in APP, Presenilin 1 (PSEN1), and Presenilin 2 (PSEN2), as the cause of autosomal-dominant forms of early-onset AD (EOAD) (Goate et al. Citation1991; Mullan et al. Citation1992; Rogaev et al. Citation1995; Sherrington et al. Citation1995). The discovery of highly penetrant pathogenic mutations in these genes has provided important clues about the pathogenesis of AD. In the case of presenilins, they are thought to be the catalytic subunit of the γ-secretase complex, which is formed by Psen1 or Psen2 together with PEN-2 (PS enhancer 2), Nicastrin and APH-1(anterior-pharynx defective) (Selkoe and Wolfe Citation2007). The γ-secretase complex is responsible for the cleavage of several type I membrane proteins within their transmembrane domains, among them the intramembrane cleavage of APP that leads to the formation of the β-amyloid peptide (Xia Citation2008; Lleo and Saura Citation2011). The mutations in PSEN1 and PSEN2 influence the γ-secretase mediated cleavage of APP leading probably to a premature release of longer hydrophobic and aggregation-prone peptides such as Aβ1–42. Interestingly, research has shown that these mutations are probably qualitative, i.e. they do not increase production of Aβ1–42 over Aβ1–40, but they affect the ratio between both species in favour of Aβ1–42. This altered Aβ1–42/1–40 may represent seeds for nucleation and amyloidosis seen in AD (De Strooper and Karran Citation2016). Further supporting the role of Aβ1–42 in AD pathology, mutations in APP leading to AD affect proteolysis of APP in favour of Aβ1–42 (Dimitrov et al. Citation2013), and APP duplications have been also identified in autosomal-dominant EOAD families (Rovelet-Lecrux et al. Citation2006). All these findings have reinforced the central role of the Aβ homeostasis in the pathology of AD, in particular Aβ1–42 production in dominant forms of AD. However, mutations in these three genes are rare with an overall estimated prevalence below 1%. In fact, mutation in PSEN1, PSEN2, and APP are found only in 5–10% of EOAD leaving most AD cases genetically unresolved (Goldman et al. Citation2011; Van Cauwenberghe et al. Citation2016). This also suggests that additional, as yet unknown, genes may underlay these unexplained EOAD cases. Furthermore, it should be noted that EOAD patients only represent 2–10% of all AD cases, and thus the vast majority of AD patients with LOAD will also test negative for mutations in these three genes.
Contrary to EOAD, LOAD is considered a multifactorial disease, i.e. individual disease risk is determined by genetic, environmental and demographic factors, as well as interactions between them. Hereby, the genetic component itself is complex and heterogeneous implicating several genetic factors which modulate the risk of suffering of AD, but each one alone is not sufficient to cause the disease.
For more than 20 years, the only known genetic susceptibility factor for LOAD was the APOE gene encoding the apoliprotein E (ApoE) (Corder et al. Citation1993; Strittmatter et al. Citation1993). In APOE, three major allelic variants are found which are called APOE-ε2, APOE-ε3 and APOE-ε4. Two sites of the amino acid sequence in ApoE differ in these allelic variants leading to three different protein isoforms (ApoE2, ApoE3 and ApoE4). In the early 1990s, genetic studies in familial and sporadic LOAD identified a strong genetic association between the APOE-ε4 allele and the susceptibility of LOAD. In fact, APOE is the strongest risk factor for LOAD, with one APOE-ε4 allele increasing AD risk by 3-fold, and two APOE-ε4 alleles increasing AD risk by 12-fold (Lambert and Amouyel Citation2011; Michaelson Citation2014). In addition, APOE-ε4 has a dose-dependent effect on age of onset (Corder et al. Citation1993). Interestingly, the estimated lifetime risk for AD is more than 50% for APOE-ε4 homozygotes and 20–30% for APOE-ε3 and APOE-ε4 heterozygotes, compared with 11% for men and 14% for women overall irrespective of APOE allele combination (Genin et al. Citation2011; Scheltens et al. Citation2016). For APOE-ε2, compelling evidence supports a protective effect and a delaying effect on age of disease onset (Corder et al. Citation1994; Farrer et al. Citation1997). APOE-ε3 is thought to be a neutral allele in respect to its effect upon susceptibility to AD. The effect of ApoE upon AD risk is thought to be mediated by its ability to bind to Aβ and effectuates the clearance of soluble Aβ and Aβ aggregations. In this regard, research has shown that ApoE4 seems to be less efficient in mediating Aβ clearance compared to ApoE3 and ApoE2 (Michaelson Citation2014). Thus, these findings on ApoE provided further support to the amyloid hypothesis and the central role of Aβ homeostasis in the pathogenesis of AD. However, several lines of evidence suggest that the strong effect of the APOE-ε4 allele on LOAD risk goes beyond its ability to bind Aβ. For instance, ApoE is expressed in several tissues such as liver, brain, macrophages and monocytes, and it is involved in several physiological processes, including transport of cholesterol and other lipids, neuronal growth, repair response after tissue injury, neurogenesis, synaptic plasticity and spine integrity, neuroinflammation, and activation of lipolytic enzymes (Liu et al. Citation2013). Interestingly, most of these processes have been involved in AD pathogenesis, and research has shown that in some of them ApoE seems to modulate AD pathology in an Aβ-independent manner (Yu et al. Citation2014). In addition, cardiovascular diseases constitute known risk factors for LOAD, such as the observation that APOE is a risk factor for different cardiovascular traits including hyperlipidaemia, coronary artery disease and atherosclerosis (Wilson et al. Citation1994; Song et al. Citation2004). Hence, APOE may modulate risk of LOAD through its effect upon risk for cardiovascular diseases.
Although APOE is the strongest genetic risk factor for LOAD, the effect of APOE-ε4 to AD susceptibility explains only a small fraction of the estimated heritability of 80% leaving most of the heritability of AD unexplained (missing heritability) (Ridge et al. Citation2013). The most pivotal influence on identifying this missing heritability has been the introduction of a hypothesis-free genetic strategy: the genome-wide association study (GWAS). Additionally, subsequent introduction of a statistical approach to the GWAS strategy, i.e. the meta-analysis of multiple independent GWASs, has helped to increase power and to reduce false-positive findings (Evangelou and Ioannidis Citation2013). Thus in 2009 the first two large-scale international collaborative GWAS confirmed APOE as the strongest genetic factor for LOAD, and most importantly increased the number of identified genetic risk loci. Since 2009, additional GWAS and meta-analysis thereof have increased LOAD-associated signals. These include signals close to, or within, candidate genes such as CLU (clusterin), PICALM (phosphatidylinositol binding clathrin assembly protein), CR1 (complement component (3b/4b) receptor 1), BIN1 (bridging integrator 1), MS4A6A/MS4A4E (membrane-spanning 4-domains, subfamily A, members 6A and 4E), CD33 (CD33 molecule), CD2AP (CD2-associated protein), ABCA7 (ATP-binding cassette, subfamily A (ABC1), Member 7), EPHA1 (EPH receptor A1) and ATP5H/KCTD2 genes (Harold et al. Citation2009; Lambert et al. Citation2009; Seshadri et al. Citation2010; Hollingworth et al. Citation2011; Naj et al. Citation2011; Boada et al. Citation2014). In 2013, the number of genome-wide significant susceptibility loci for AD was doubled by the mega meta-analysis of a sample of 74,046 persons reported by the International Genomics of Alzheimer’s Disease Project (Lambert et al. Citation2013). In this study, 11 novel association signals were reported, i.e. DSG2 (desmoglein 2), PTK2B (protein tyrosine kinase 2β), SORL1 (sortilin-related receptor, L(DLR Class) A Repeats Containing), SLC24A4 (solute carrier family 24 member 4), INPP5D (phosphatidylinositol-3,4,5-trisphosphate 5-phosphatase 1), MEF2C (myocyte-specific enhancer factor 2C), NME8 (NME/NM23 family member 8), ZCWPW1 (zinc finger CW-type and PWWP domain containing 1), CELF1 (CUGBP, Elav-like family member 1), FERMT2 (fermitin family member 2), and CASS4 (Cas scaffolding protein family member 4). Conversely to APOE, none of these novel signals increased the susceptibility to LOAD by more than 2-fold (odds ratio, OR = 2) (Lambert et al. Citation2013). Thus in view of their small ORs, genetic variants within these loci are unlikely to be causative. Despite this, the candidate risk genes named by GWAS provided further support to the amyloid cascade hypothesis because some these gene signal are linked to Aβ homeostasis and/or Tau pathology (Lambert and Amouyel Citation2011). On the other hand, clustering the genes in biological pathways revealed three main pathways involved in LOAD besides Aβ and Tau, cholesterol and lipid metabolism, immune system and inflammatory response, and endosomal vesicle cycling. This observation was further supported by an alternative approach to classical case–control GWAS called pathway analysis (Jones et al. Citation2010; IGAP Citation2015).
Thus, the past years have witnessed major advances in the understanding of the genetics of LOAD. However, awareness that genetic research into LOAD has not reached its limit is increasing. Ridge et al. (Citation2016), for example, have estimated that 69% of the genetic variance in AD remains unexplained by known AD-risk variants, leaving an important part of the heritability of LOAD as yet unexplained. The hope to catch this missing heritability has motivated development of novel approaches to search for rare variants (minor allele frequency <1%) that cannot be found by classical GWAS approaches. Herein, next-generation sequencing (NGS)/whole-exome sequencing have already enabled the identification of causative mutations in families and sporadic cases for whom linkage analysis was not possible, including mutations in SORL1 (Pottier et al. Citation2012) and TREM2 (Guerreiro et al. Citation2013; Jonsson et al. Citation2013). Furthermore, NGS has allowed the identification of rare variants in APP, PSEN1 and PSEN2, which increase the risk for AD in LOAD families (Cruchaga et al. Citation2012). These studies underscore the value of this technology in the search for rare variants/mutations in families and sporadic cases with no mutations in known AD genes, even in the investigation of small samples.
Finally, the ultimate goal of these genetic findings is to search for ways to translate genetic findings to routine clinical practice. From a translational point of view, identification of highly penetrant mutation in APP, PSEN1 or PSEN2 has led to valuable targets currently used in diagnosis and drug development (Goldman et al. Citation2011; Schneider et al. Citation2014). A most direct translational application of genetic findings in APP, PSEN1 and PSEN2 is molecular genetic diagnostic and predictive screening, even though the real utility of this genetic testing is very limited because, as mentioned before, causal mutations explain only a small fraction of AD patients. Nevertheless, the ability to provide definitive molecular diagnostics in familial cases is an important step towards personalised medicine. Furthermore, predictive testing also helps at-risk individuals from dominant AD families because it ends uncertainty of whether one has inherited the gene and also helps planning the future, including education, financial, family and career. Notwithstanding, before offering genetic testing, a multidisciplinary team, including clinicians, genetic counsellors, psychologists and social workers, should extensively evaluate which patient or at-risk individual may actually benefit from genetic testing (Goldman et al. Citation2011; Gauthier et al. Citation2013).
For GWAS findings, the application to clinical practice is more difficult for two main reasons. First, GWAS signals most probably do not represent the causative mutation(s), but rather they lie close to the real mutation(s) (Hardy and Singleton Citation2009). Second, all these variants showed modest to low effect on disease risk, which renders these variants useless in terms of distinguishing patients from controls, and in terms of guiding clinical managements. APOE-ε4 allele presence is neither sufficient nor necessary to cause AD. Some research has been devoted to explore the utility of GWAS signals combined in a genetic risk score (GRS), which provides a cumulative effect score based on the individual susceptibility variants. However, results from studies using GRS combining all or part of GWAS signals have been inconclusive concerning disease progression and clinical diagnosis (Sleegers et al. Citation2015; Lacour et al. Citation2016; Louwersheimer et al. Citation2016). In addition, sensitivity and specificity obtained in these studies render GRS inadequate for clinical practice. Interestingly, a recent study investigated the disease prediction accuracy using genome-wide genetic data regardless of whether variants were consistently associated with LOAD or not. Using more than 300,000 genome-wide variants, combined in one single genetic score, the authors of this work reached a disease prediction accuracy of 78.2% (Escott-Price et al. Citation2015). Although these results are far from the standards used for clinical practice, they underscore the added value of such a GRS in algorithms searching for individuals at risk for AD. Additional research is now fostered to identify the real causative variants underpinning GWAS signals, to explore gene–gene and gene–environment interactions of genetic variants. All this additional genetic information will definitely improve current predictive algorithms that include mainly non-genetic biomarkers and clinical data.
Pre-analytics in the CSF biomarkers analysis
Pre-analytical confounders affect the quality of samples and the reliability of biomarker data (Lewczuk, Beck, et al. Citation2006; Vanderstichele et al. Citation2012; Teunissen et al. Citation2014). Up to 70% of all biomarker-related problems occurring in laboratory diagnostics are due to pre-analytical errors (Lippi et al. Citation2011). Most of the pre-analytical errors consist of incorrect procedures during collection, handling, preparing or storing samples (Lippi et al. Citation2011). Therefore, recognising these confounders and controlling the pre-analytical conditions for CSF analyses will lead to improved reproducibility and quality of biomarker measurements. The following pre-analytical confounders have been studied extensively in CSF analysis and will be discussed here: sample withdrawal volume, blood contamination of CSF, types of sample collection and storage tubes, storage volume, centrifugation speed, storage temperature, delayed freezing of samples, long-term stability and the number of freeze–thaw cycles.
Collection volume
The volume of CSF taken from a patient during LP can influence CSF protein concentrations, because many brain-derived proteins have a rostrocaudal concentration gradient, i.e. a higher concentration in CSF sampled more proximal to the ventricles (Reiber Citation2001). For example, a slight decrease of CSF α-synuclein concentrations was found from rostral to caudal (Hong et al. Citation2010; Mollenhauer et al. Citation2012). In contrast, data on the rostro-caudal gradient of the AD biomarkers are conflicting: whereas some groups did not find such gradient (Bjerke et al. Citation2010; del Campo et al. Citation2012; Vanderstichele et al. Citation2012), others did, and found that they depended on the medical conditions of the patients (Brandner et al. Citation2014). In this situation, a standardised CSF collection volume by LP may be advised for biomarker analyses (e.g. 12 ml) (del Campo et al. Citation2012). Of note, no correlation between the volume of collected CSF and the risk of post-LP headache was found (Kuntz et al. Citation1992; Duits et al. Citation2016).
Blood contamination of CSF
Blood contamination can influence CSF biomarker concentrations and may occur during a traumatic LP (‘bloody tap’). Biomarker concentrations can be affected in opposite directions: (a) elevated protein concentrations, because the protein of interest is also abundant in blood, or (b) decreased protein concentrations, due to degradation of the protein of interest by blood proteases or disturbance by highly abundant proteins in blood plasma. Since the total protein concentration in CSF is approximately 0.5% of that in blood, the concentration in CSF of many proteins is affected by even minor amounts of blood contamination (You et al. Citation2005). A good example is the concentration of αSyn in CSF which is substantially increased by blood contamination, since erythrocytes also contain αSyn (Hong et al. Citation2010; Kang et al. Citation2013).
Although no significant changes in Aβ1–42 levels were found in CSF contaminated with blood compared to uncontaminated CSF (Bjerke et al. Citation2010), the CSF Aβ42 concentration decreased after addition of an amount of plasma that corresponds to a CSF/serum albumin ratio of 11–55 × 10−3, probably due to the binding of free Aβ to plasma proteins (Bjerke et al. Citation2010). Tau and other proteins could likewise be affected by binding to proteins or degradation by proteases present in the plasma (You et al. Citation2005; Park et al. Citation2015). The confounding effect of a traumatic puncture can simply be avoided by discarding the first millilitres of blood-contaminated CSF in the case of artificial bleeding, and starting collection of CSF when the sample is clear, as instructed by most international protocols (Teunissen et al. Citation2009; del Campo et al. Citation2012; Vanderstichele et al. Citation2012; Park et al. Citation2015; Reijs et al. Citation2015). In the case where blood contamination cannot be avoided, immediate centrifugation of the CSF sample is recommended to remove blood cells from the sample (Park et al. Citation2015), although plasma proteins will remain in the CSF. The effect of erythrocytes on the protein concentrations is for most CSF biomarkers negligible when their number is below 500 per µl; therefore this maximum limit is generally regarded as acceptable (Teunissen et al. Citation2014; Reijs et al. Citation2015). Quantification of haemoglobin concentrations, which can also be done in archived material, may also be used as a marker for possible blood contamination of the CSF, albeit the release of haemoglobin into CSF only occurs after lysis of erythrocytes. Furthermore, to reduce the risk of a traumatic LP, 25G needle compared to 20G needle has been shown to be beneficial (Bertolotto et al. Citation2016).
Collection and storage tubes and storage volume
One of the best studied pre-analytical confounders for the assessment of dementia biomarkers in CSF, and one that may dramatically affect the outcome of the analyses, is the type of collection and storage tubes for CSF. Protein properties (such as lipophilicity, hydrophobicity, isoelectric point) could have effects on the interaction of the protein with the tube material. Lipophilic proteins, such as Aβ, bind in a non-specific manner to tubes made of materials other than polypropylene. Hydrophilic pTau protein is, in general, less adsorbed to the tube walls compared to the more hydrophobic Aβ (Lewczuk, Beck, et al. Citation2006; Perret-Liaudet et al. Citation2012). However, adsorption of proteins can also be influenced by surface roughness of the tube or the polymer surface charge in relationship to the isoelectric point of the protein (Duncan et al. Citation1995; Sweileh et al. Citation2010; Perret-Liaudet et al. Citation2012; Poncin-Epaillard et al. Citation2012).
When comparing tubes made from other materials than polypropylene, such as glass or hard plastic tubes, such as polystyrene tubes, lower levels of Aβ42, Tau and, in some studies, pTau were recovered from the CSF collected in these non-polypropylene tubes (Andreasen et al. Citation1999; Bjerke et al. Citation2010; Lewczuk, Beck, et al. Citation2006; Perret-Liaudet et al. Citation2012). Additionally, the adsorption is higher for proteins if pure polypropylene tubes are used compared to tubes made of copolymers of polypropylene and polyethylene, which have lower adsorption properties (Sunderland et al. Citation2003). Treatment of the surface of the polypropylene tube with Tween-20 can reduce the binding of CSF Aβ peptides to the tube (Pica-Mendez et al. Citation2010), and use of siliconized low-binding tubes reduces adsorption of CSF αSyn (del Campo et al. Citation2012). Transfer of CSF into different tubes made of polypropylene or other materials for processing or storage purposes, can result in a 20–60% decrease in measured protein concentrations (Perret-Liaudet et al. Citation2012). Measured concentrations of Aβ42 decreased by approximately 25% with each consecutive transfer, whereas Aβ40 decreased approximately by 16% and Tau decreased by only 4% (Toombs et al. Citation2014).
Accurate planning of storage of CSF in appropriate aliquot volumes for biomarker analysis is preferred over repeated freeze–thawing (see also later in this paper) of the CSF for multiple uses, which usually leads to unpredictable changes in the biomarkers concentrations. Additionally, since long-term storage could theoretically lead to evaporation of fluids and therefore influence protein concentrations, storage of CSF at different volumes and temperature conditions was systematically studied. Significant evaporation was observed at room temperature but not at –80 °C or –20 °C (Willemse et al. Citation2015). Small polypropylene tubes (1–2 ml) with screw caps are the ideal storage tubes and the minimum recommended volume of aliquots is 0.1 ml (Teunissen et al. Citation2014) or between 0.25 and 0.5 ml (del Campo et al. Citation2012). Reducing storage volume from 75% to 50% of total tube capacity may decrease Aβ42 concentration by 3.7% (P = 0.03), whereas no change was observed in Tau and pTau concentrations (Leitao et al. Citation2015). Given the limited information available, currently it is safe to advise to fill storage tubes up to 75% of its capacity (del Campo et al. Citation2012; Teunissen et al. Citation2014; Leitao et al. Citation2015).
In general, polypropylene tubes are recommended for use in both CSF collection and long-term storage. However, tubes made of a copolymer of both polypropylene and polyethylene are preferred over those made of polypropylene alone. Treatment of tube surfaces (e.g. with Tween 20) before use may be beneficial in specific cases. Furthermore, preferably the tubes should be filled to 75% of its capacity.
Centrifugation speed
Centrifugation of CSF samples could be useful to remove (invisible) blood components prior to long-term storage (Park et al. Citation2015). When CSF samples that were not centrifuged, were compared to CSF samples that were centrifuged after 1, 4, 48 and 72 h after withdrawal, no influence on Aβ42, Tau and pTau concentrations was demonstrated (Schoonenboom et al. Citation2005). In the case of non-traumatic CSF samples, biomarker concentrations were not influenced by centrifugation (Le Bastard et al. Citation2015). Therefore, centrifugation of CSF (at 2,000 × g) for 10 min at room temperature (Reijs et al. Citation2015) can be considered before analysis and/or storage, but is not essential, unless the CSF is not clear. A lower centrifugation speed (e.g. 400–800 × g) is recommended if cells have to be preserved in the CSF for cell count (Teunissen et al. Citation2014).
Storage temperature and delayed freezing of samples
The delay between sampling and freezing may affect CSF protein levels. Aβ42, Aβ40, Tau and pTau have been reported to remain stable at room temperature for a period up to 24 h (Kaiser et al. Citation2007; Bjerke et al. Citation2010), 4–5 days (Zimmermann et al. Citation2011) or even 12–14 days (Schoonenboom et al. Citation2005; Simonsen et al. Citation2013) after LP. Thereafter, a decrease in protein concentrations was observed, probably due to proteolytic processes and degradation of proteins (Schoonenboom et al. Citation2005). Also storage of CSF samples at 4 °C for 2 days may reduce Aβ42 concentrations by 20%, but no significant effect was found for Tau and pTau (Schoonenboom et al. Citation2005). The concentration of αSyn is also affected: storage of CSF at room temperature for 4 h leads to significant alterations in αSyn levels (Simonsen et al. Citation2013). A 40% reduction in CSF αSyn concentration was found after storage for 4 h at 4 °C (del Campo et al. Citation2012). As a general guideline, CSF samples are frozen as soon as possible at –80 °C, and the stability of yet unstudied proteins in the CSF should be tested (Teunissen et al. Citation2014; Le Bastard et al. Citation2015; Reijs et al. Citation2015). However, sometimes immediate freezing of the CSF samples is not possible. International guidelines recommend to preferably store the CSF samples at room temperature before, during and after centrifugation (Teunissen et al. Citation2014), and limit the delay of freezing of the CSF samples to 4 h maximally (Park et al. Citation2015). Some guidelines are more strict in recommending a delay of no more than 30–60 min, with a maximum of 2 h between collection and freezing (or temporarily store the CSF samples at 4 °C for no more than 5 days) (del Campo et al. Citation2012; Vanderstichele et al. Citation2012; Teunissen et al. Citation2014; Reijs et al. Citation2015).
For transportation to an external laboratory, where routine AD biomarkers are to be analysed, special conditions, such as freezing or cooling of a sample, are not necessary and not recommended, if transportation time does not exceed 5-6 days (Zimmermann et al. Citation2011; Lelental et al. Citation2016).
Long-term stability and freeze–thaw cycles
CSF sample stability might be affected by its storage time (Schoonenboom et al. Citation2005). Previous studies showed that CSF samples stored for 1 year (Lelental et al. Citation2016), 2 years (Bjerke et al. Citation2010; Zimmermann et al. Citation2011), up to 6 years (Schipke et al. Citation2011) or even 10 years (Vanderstichele et al. Citation2012) at –80 °C remained stable for Aβ42, Tau and pTau, but Aβ40 levels were less stable. It has been suggested that CSF Aβ40 might be more vulnerable to degradation (Schipke et al. Citation2011). In conclusion, CSF can be stored for up to 10 years at –80 °C for analysis of AD biomarkers, although negative effects of extended storage periods on yet unstudied proteins cannot be excluded (del Campo et al. Citation2012; Vanderstichele et al. Citation2012).
Repeated freeze–thaw cycles can be an issue when proteins are less stable, such as Aβ42, in comparison to more stable proteins, such as Tau and pTau (Zimmermann et al. Citation2011). The influence of freeze–thaw cycles has previously been tested for up to six cycles (Schoonenboom et al. Citation2005; Zimmermann et al. Citation2011; Le Bastard et al. Citation2015; Leitao et al. Citation2015). The CSF Aβ42 concentrations decreased after three freeze–thaw cycles by 20%, while CSF Tau and pTau levels remained stable up to six freeze–thaw cycles (Schoonenboom et al. Citation2005; Le Bastard et al. Citation2015; Leitao et al. Citation2015). Therefore, aliquotting CSF in appropriate volumes for future use is preferred over repeated freeze–thawing, and a maximum of two freeze–thaw cycles is generally recommended for CSF samples (Lewczuk, Kornhuber, et al. Citation2006; Zimmermann et al. Citation2011; del Campo et al. Citation2012; Reijs et al. Citation2015).
Notwithstanding the fact that (pre- and post-) analytical parameters can affect the clinical classification, an exploratory study provided evidence that, for a specific context of use, the impact on clinical accuracy of biomarker concentration shifts might be lower than originally expected, as induced shifts of ±20% in only one of the three biomarkers has limited impact on the clinical accuracy of AD CSF biomarkers in MCI and autopsy-confirmed AD patients when using the IWG-2 criteria (Niemantsverdriet et al. Citation2016).
provides an overview of the pre-analytical confounders that may affect CSF analysis of Aβ40, Aβ42, Tau, pTau and αSyn proteins, and recommendations to control these confounders. Abiding by these recommendations may improve the reproducibility and quality of biomarker measurements. Additionally, standardised procedures of biobanking discussed later in this paper, will be helpful to validate assays for, and study (pre-analytical) confounders of, existing and novel CSF biomarkers within collaborative international studies.
Table 1. Overview of pre-analytical confounders and current recommendations in the CSF analysis of AD biomarkers.
Circadian variation as a confounder for AD and PD CSF biomarkers
Diurnal variations in AD biomarkers
Another pre-analytical factor influencing quality of the diagnostic-relevant outcome of the AD biomarkers measurements is timing of the CSF collection. It represents one of the most practical critical issues, and hence it is important to test whether diurnal variation influences the outcome of the biomarkers’ measurements. So far, only a few studies have addressed the issue of diurnal variation in CSF AD biomarkers, with inconsistent results.
Bateman et al. (Citation2007) observed that CSF Aβ levels varied significantly (1.5- to 4-fold) over 36 h in a group of 15 healthy individuals aged 23–78 years. A lumbar catheter was placed in all participants and 6 ml of CSF were collected hourly in polypropylene tubes. CSF Aβ1–x, A1–40, and A1–42 were measured by ELISA in each hourly CSF sample. During a time period of 36 h, the Aβ levels peaked at 12 and 23 h with troughs at baseline, and 25 h showing significant fluctuations of more than 50% within 6 h. A sinusoidal pattern of Aβ levels was described across participants, supposed to be due to time of day, activity or dynamic changes in the production or clearance rate of Aβ. This study was the first to arise the issue of a possible diurnal variation of CSF biomarkers that could represent a significant obstacle when using CSF biomarkers as diagnostic tools. In the study reported by Bjerke et al. (Citation2010), 14 psychiatrically and neurologically healthy subjects underwent knee surgery. CSF was serially collected by LP with an 18-Gauge Portex epidural needle at baseline, after 4–6 h (mean 5.3 h) and after 24 h. If compared to Bateman’s results, data showed more stable levels with a slight but significant decrease in CSF Aβ42 after 4–6 h, which tended to return to baseline levels after 24 h. A possible reason for these results is that, as opposed to Bateman’s study, a smaller CSF volume was taken; this could have led to a minor impact on the CSF dynamics.
More recently, Slats et al. (Citation2012) studied the within-subject variability of other AD biomarkers, i.e. Tau and pTau, and found no diurnal variation in CSF dynamics during a 36-h sampling (6 ml/h). While previous data were principally obtained in mostly young healthy participants, this study enrolled older subjects and patients with AD, in order to determine daily variability in these relevant age groups. Six patients suffering from mild AD (59–85 years, MMSE 16–26), and six healthy volunteers (64–77 years) underwent insertion of an intrathecal catheter, from which 6 ml of CSF were collected each hour for 36 h. Variability of CSF Aβ40, Aβ42, Tau and pTau concentrations was lower than expected, and the data observed by Bateman et al. were not confirmed. These findings suggest that CSF biomarker variability is relatively low in healthy older controls and AD patients. Also Moghekar et al. (Citation2012) examined CSF Tau along with Aβ but no diurnal fluctuation of the biomarkers was reported. Ten patients suspected of having idiopathic normal pressure hydrocephalus or pseudotumor cerebri were enrolled. Most of the patients had mild cognitive deficits associated with their suspected diagnosis (MMSE score range 20–30). All patients underwent insertion of a catheter into the lumbar subarachnoid space on the first day of hospitalisation. After monitoring of intracranial pressure for 18 h, drainage of CSF was initiated at noon and collection of CSF for analysis started at 18:00 h on the first day of drainage. Forty millilitres of CSF were withdrawn from the lumbar catheter every 6 h for 24 or 36 consecutive hours. The levels of Aβ42, Aβ40, Tau, and pTau, although significantly different between the patients, did not fluctuate appreciably over time (Moghekar et al. Citation2012).
Along with core biomarkers of AD, other proteins are currently studied as candidate biomarkers, with significant results in their role in CSF diagnostics. Biomarkers of the amyloidogenic pathway are being taken into account in AD diagnosis, since Aβ42 is produced from cleavage of APP, and several critical steps of amyloid metabolism can cause daily Aβ fluctuations resulting from, for example, fluctuations of neuronal activity during the day (Cirrito et al. Citation2005). Dobrowolska measured APP proteolytic products sAPPβ, sAPPα, Aβ40 and Aβ42 over 36 h in CSF from cognitively normal young and elderly participants, as well as in CSF from participants with AD (total of 49 participants). For all participants, an intrathecal lumbar catheter was placed between the L3–L4 interspace or the L4–L5 interspace. Every hour for 36 h, 6 ml of CSF and 12 ml of plasma were withdrawn. Diurnal fluctuations were observed in sAPPα, sAPPβ, Aβ40 and Aβ42, diminishing with increased age (Dobrowolska et al. Citation2014).
In another study, Cicognola et al. (Citation2016) investigated diurnal variability of classical and candidate CSF biomarkers in a cohort of neurosurgical patients carrying CSF drainage after neurosurgical intervention for tumours, head trauma or haemorrhages, or for monitoring CSF pressure. As candidate biomarkers they considered markers of amyloid metabolism (Aβ38, Aβ40, sAPPα, sAPPβ), synaptic loss (NG), neuroinflammation (YKL-40), neuronal damage (VILIP-1) and these related to genetic risk (APOE). Samples were collected from a cohort of 13 neurosurgical patients from either ventricular (n = 6) or lumbar (n = 7) CSF drainage at six time points during 24 h, 1–7 days following the neurosurgical intervention. Haemorrhagic CSF samples were excluded; if the drainage was placed after a trauma, haemorrhage or tumour surgery, CSF samples collected were acceptable if they were either clear or only slightly and stably xantochromic. Even if set on different ranges between subjects, the overall levels of the individual biomarkers were very stable over time and did not seem to be affected by external factors. None of the biomarkers showed significant diurnal variation. Site of drainage (lumbar versus ventricular) did not influence this result (Cicognola et al. Citation2016).
Diurnal variation in αSyn species
As it will be reviewed in more detail later in this paper, many studies have investigated the diagnostic and/or prognostic performance of CSF αSyn species, i.e. total, oligomeric and phosphorylated αSyn, in PD and AD cohorts, reporting conflicting results (Wang et al. Citation2015; Parnetti, Cicognola, et al. Citation2016).
With respect to CSF αSyn species diurnal variations, data are still scanty (Mollenhauer et al. Citation2016). Spies et al. (Citation2011) led a pilot study performing repeated CSF sampling in healthy elderly and AD patients. CSF samples of six healthy controls (59–85 years old) and six AD patients (64–77 years old) who underwent repeated CSF sampling from an indwelling intrathecal catheter with 1-h intervals were analysed. No linear trend in αSyn concentrations over 33 h was observed. In order to investigate the presence of a sinusoidal pattern they included a cosinor analysis in the model that did not identify sinusoidal variation in CSF αSyn concentrations. These results did not change when AD patients and healthy controls were analysed separately (Spies et al. Citation2011).
Taken together, diurnal variation does not seem to represent a major variability factor. This evidence is of utmost importance, since it implies that the diagnostic procedure of LP can be carried out at different time points during the day, without any influence on the results obtained for the AD biomarkers.
Biobanking
Following proper pre-analytical procedures, outlined above, assures high quality of the samples, which can be used for routine diagnostic analyses, as well as stored in repositories (biobanks), with the aim of research use in the future. Therefore, much effort has recently been devoted to optimisation of procedures for the CSF collection and biobanking (Teunissen et al. Citation2009; del Campo et al. Citation2012).
CSF is obtained by LP, a method that is fairly well accepted by patients and can be performed safely. For example, severe complaints occur in less than 1% of the punctures (Duits et al. Citation2016). Evidence-based recommendations to optimally perform the procedure, as well as other tools, such as a training video explaining the procedure step by step, are now in place (Engelborghs et al. Citation2017; Babapour Mofrad et al. Citation2017), which helps to reduce the risk of complications by adoption of procedural details that minimise risk factors, for example by application of small gauge needles, refraining from the use of syringe, and through education and providing comfort to the patients to reduce anxiety.
As mentioned, CSF can be centrifuged to remove cells (lymphocytes, erythrocytes), which is advised as cells consume CSF glucose, and cellular proteases able to modify proteins can be released from dying cells. Centrifugation, if used, is recommended to occur within 1 h after collecting the CSF sample. A study comparing effects of time between LP and centrifugation/storage on the low-molecular-weight proteome did not show a difference in detected proteins (Jimenez et al. Citation2007), but these results may not hold true for more sensitive methods that are becoming more and more available.
During aliquotting, low-binding biobank tubes should be used, again to minimise absorption of the CSF proteins. Special care must be taken to close the vials, as this may lead to evaporation of fluid. It was perceived that evaporation of stored fluids occurs during long-term storage, but a systematic experiment over 4 years showed that evaporation does not occur under normal freezer conditions (Willemse et al. Citation2015).
It may be obvious, but still not generally implemented, that freezing-proof and barcoded labels are not used. Barcoding requires electronic registration. Clinical samples are usually tracked by laboratory information management systems (LIMS), but the practice for biobanking is often different. Biobanking systems should employ barcodes, as failure in patient identification has been identified as an important source of variation for medicinal laboratories (Plebani Citation2006), which will also conceivably account for biobanking practice. There is increasing availability of software for biobanking, and these better serve the needs for body fluid sampling, i.e. systems can be linked to LIMS to avoid failures in patient identification, to provide overviews of number of samples and volume per patients, track and trace of samples via barcodes, and flexibility to, e.g. add clinical data or ethical consent information. Continuous, alarmed, tracking of freezer temperature 24/7 is standard of practice in biobanks, and underscores the high responsibility for biobank personnel for this precious resource.
An issue in long-term biobanking is the stability of such proteins at these conditions, which can span up to 20 years. This is an important issue, for which there is little evidence yet. Of course, long-term storage stability is not relevant for diagnostic practice, where samples are usually processed within weeks, but more important for large-scale biomarker studies using historically collected samples. One approach to define long-term storage for a biomarker is to experimentally generate Arrhenius plots. In this approach, samples are put at different temperatures during increasing intervals for a defined time period (e.g. 3 weeks), which generates a formula based on which long-term decline for longer periods and at different temperatures can be extrapolated (Kirkwood Citation1977). The disadvantage is the extrapolation, which assumes similar behaviour over prolonged periods and at different temperatures, which is not yet proven for every biomarker or matrix. Another approach is to analyse samples collected over a long period from a clinically homogeneous population. This is based on the idea that patient biology within clinically homogeneous groups does not vary across time. This approach can only be applied if the collection protocol has been unchanged over the years, as change in tubes or introduction of extra transfers to novel tubes could have led to lower Aβ levels. In this way, Aβ concentrations will be the same in AD patient groups now as they were 20 years ago, but if there was a difference then it would be due to changes of dependent variables, such as time.
Very recently, an international project in cooperation with Integrated BioBank of Luxemburg was launched to test inter-centre biomarkers variability resulting from different biobanking standard operating procedures (SOPs) across centres (Coordinators: C. Teunissen, F. Betsou and P. Lewczuk).
The Alzheimer’s Association International Quality Control (QC) programme
Taken together the issues in pre-analytics of the samples used for AD biomarkers analyses, as discussed above, it is not surprising that their intra- and inter-laboratory QC turned out nontrivial very shortly after the introduction of these modalities into research, and then routine, laboratories. This holds true particularly in case of methods based on the ELISA or other immunoassay techniques, involving manual pipetting steps in 96-well plates.
Further, it has to be stressed that the legal situation in many countries, as well as normalisation requirements defined by state institutions as well as by the International Standardization Organisation (ISO) put large pressure on the issues of laboratory measurements quality and its control (Waedt et al. Citation2012).
Outline and aims for the QC programme
The Alzheimer’s Association QC programme for CSF biomarkers was started in 2009, with the aim to establish an organisation to monitor the performance of CSF biomarker measurements between laboratories and to monitor longitudinal variations due to batch-to-batch variability in assay production (Mattsson et al. Citation2011). The long-term goal of the whole programme is to improve the quality of the whole chain of procedures in CSF biomarker measurements, which would result in stable results over time and harmonised values worldwide with the possibility to introduce uniform cut-off levels between laboratories. This would serve as the basis for an increased use of CSF biomarkers in clinical diagnostic routine practice, which would be of large benefit for the patients, especially when we hopefully will have disease-modifying drugs targeting amyloid and Tau pathology available.
An important goal of the QC programme is also, by making CSF biomarker variability objective, to stimulate other standardisation efforts, ranging from SOPs for LP, CSF handling and storage, analytical protocols and production procedures (Mattsson et al. Citation2011). In addition, a goal with the QC programme was also to stimulate biotechnology companies to develop novel high-quality versions of their assays, and to make novel assays on fully automated laboratory analysers.
The QC programme is based on across-laboratory analysis of QC CSF samples (aliquots of pooled CSF) that are sent to the participating laboratories for analysis of the AD CSF biomarkers. The programme is open for labs using any generally available kit for Aβ, Tau or pTau, and is designed to present each laboratory with three blinded challenges per year. Each round consists of three QC samples, with two samples per round having unique biomarker concentrations while one sample is identical in every round.
The early rounds in the QC programme
Results from the first two rounds presented results for 40 laboratories from Europe, the United States, Japan, Australia and South America (Mattsson et al. Citation2011). Results showed the expected between-lab variability of 13% up to 36%. A checklist for how the assays are performed in each lab was constructed with the aim to identify analytical factors that may underlie the variability, but no clear effect or differences between laboratories could be found (Mattsson et al. Citation2011). In a subsequent paper, results from the first ten rounds in the QC programme were presented (Mattsson et al. Citation2013), showing no clear improvement in between-lab performance. This may have been anticipated, since the outcome of any QC programme is only to monitor between-laboratory and longitudinal stability. Instead, just as in other areas of laboratory medicine, this needs to be done in complementary standardisation efforts.
The IFCC working group for CSF proteins
The International Federation of Clinical Chemistry Work Group on CSF proteins (IFCC WG-CSF) works in collaboration with GBSC, and includes researchers both from the academia and industry. The goal is to establish Reference Measurement Procedures (RMPs), or ‘gold standard’ methods for Tau and Aβ in CSF, and to develop a Certified Reference Material (CRM), meaning aliquots of a large CSF pool in which levels of the biomarkers have been set using the RMPs (Kuhlmann et al. Citation2016). After tests of homogeneity and stability, aliquots of the CRM will be distributed to kit vendors and large laboratories for harmonisation of levels between assay formats, and to secure long-term (batch-to-batch) stability of assays. Four independent laboratories have developed a selected reaction monitoring (SRM) mass spectrometry (MS) method for CSF Aβ42. Two such methods for the quantification of CSF Aβ 1–42 have been published (Korecka et al. Citation2014; Leinenbach et al. Citation2014) and accepted and listed by the Joint Committee for Traceability in Laboratory Medicine as RMPs (nos C11RMP9 and C12RMP1). The performance of these RMPs has also been examined in a Round Robin study, with excellent agreement between methods (Pannee, Gobom, et al. Citation2016). The Aβ42 SRM methods correlated well (R2 = 0.98) and showed high analytical precision with an intra-laboratory coefficient of variation (CV) of 4.7%, and when using one CSF sample as a candidate CRM, the inter-laboratory variability was 8.3% (Pannee, Gobom, et al. Citation2016). The validation of these RMPs is important for the development of a CRM and thereby for the standardisation of the AD CSF biomarker measurements, since they are needed for value assignment of the candidate CRMs.
Another important step for the development of a CRM is evaluation of the commutability, or the relationships of results from different methods for a reference material and for representative types of samples. Thus, a CRM for CSF Aβ and Tau is commutable only if it behaves in the same way as clinical CSF samples, which is necessary for using the CRM for calibration or trueness control, and in the end to ascertain correct clinical outcomes of assays. In contrast, the use of purified Aβ or Tau protein as a CRM is not recommended in laboratory medicine. A paper reporting two commutability studies on the AD CSF biomarkers was recently published (Bjerke et al. Citation2016), in which routine immunoassays and the LC-MS/MS RMP were employed to measure individual CSF samples and different formats of candidate CRMs. Results showed that only the native CSF pool was commutable, and suitable as a CRM, in contrast to different variants of artificial or spiked CSF (Bjerke et al. Citation2016). Based on these results, three CRMs based on native CSF with low, medium and high levels of Aβ1–42 concentrations will be used.
Seeing improvements in performance in the QC programme
Two of the immunoassays that have been in the QC programme since the start have been further developed and validated, including the MSD 96-Well MULTI-SPOT® Human Aβ42 V-PLEX Kit (Meso Scale Discovery, Gaithersburg, MD, USA), and the INNOTEST® β-AMYLOID (1–42) (with ready-to-use calibrators, Fujirebio Europe). This has resulted in lower between-laboratory CVs since their introduction in 2014, which now show a mean of 15.5% for the V-PLEX and 16.5% for the INNOTEST for CSF Aβ42 (round 14, 2014 to round 22, 2016). In comparison, the EUROIMMUN beta-Amyloid (1–42) ELISA method and the Luminex INNO-BIA AlzBio3 show CVs of 17.6% and 22.1%, respectively ().
Table 2. Performance of the analytical methods for CSF β-amyloid (Aβ42) in the Alzheimer’s Association Quality Control (QC) programme during 2014–2016.
Importantly, novel assays have been developed on fully automated laboratory analysers that show very stable measurements also between laboratories. The Elecsys β-Amyloid(1–42) assay (Roche Diagnostics, Penzberg, Germany) was the first fully automated assay in the QC programme. This method shows very high analytical performance with excellent lot-to-lot comparability (correlation coefficients >0.995) and repeatability CVs of 1.0%–1.6%, and is standardised against the MS RMP for CSF Aβ42 (Bittner et al. Citation2016). The Elecsys assay has been in the QC programme since 2014 (eight rounds), and shows very low between-laboratory CVs, with a mean of 4.2% (), which is a major improvement as compared with the other immunoassays.
Another assay on a fully automated laboratory analyser is the Lumipulse G β-AMYLOID 1–42 (Fujirebio Europe NV, Ghent, Belgium). This method shows very low between-assays and between-instrument CVs, and correlates well with the MS RMP for CSF Aβ42. The Lumipulse assay has been tested in two rounds of the QC programme, and showed a very low between-laboratory CV, with a mean of 6.8% (), which is very promising, although it should be mentioned that the results for both platforms were so far obtained only by low number and very specialised laboratories.
During the years since the start of the Alzheimer’s Association QC programme, technical developments and standardisation efforts have resulted in a marked improvement in performance for the core AD CSF biomarkers. Especially, two large biotech companies have developed fully automated assay versions of the CSF biomarker assays for Tau and Aβ in CSF that can be run on large clinical chemistry analysers. These assays show excellent performance with very low between-laboratory CVs. These developments will serve as the basis for the introduction of global cut-off values and for a general introduction of CSF biomarkers in early clinical diagnosis, which will be of great importance for patients the day we had disease-modifying therapies.
The Alzheimer’s Association QC programme is needed also in the future, since these achievements do not mean that the QC programme has lost its role in monitoring assay and laboratory performance. Instead, exactly as in other disease areas, there will be a continuous, and most likely growing, need for proficiency programmes for the AD CSF biomarkers in the future.
Magnetic resonance imaging and hippocampal atrophy in AD
In the recent decades, also imaging markers of neuronal injury in AD have been extensively studied. Although not specific, they are highly sensitive, and they are present long before clinical symptoms appear (Glodzik-Sobanska et al. Citation2005; Mosconi Citation2005). Medial temporal lobe (MTL) atrophy was one of the first identified characteristic imaging features of AD. Early studies employing CT with negative angulation showed that 70% of patients with minimal memory impairment and 87% of demented subjects had hippocampal atrophy, compared to only 20% of controls (de Leon et al. Citation1988). Moreover, 91% of MCI subjects who had hippocampal shrinkage at baseline declined to dementia, as compared to 19% of those who remained stable (de Leon et al. Citation1989). Since that study, the discriminative and predictive value of entorhinal, hippocampal and more general MTL atrophy was confirmed by hundreds of publications (Glodzik-Sobanska et al. Citation2005). In addition, to volumetric measurements of a priori selected regions, machine learning (Rathore et al. Citation2017) and other data-driven hypothesis-free techniques (such as independent component analysis, Willette et al. Citation2014) have been applied to structural MRI data performing particularly well in classifying AD patients and controls and predicting MCI conversion to AD.
Decreased uptake of FDG is another hallmark of AD. A pattern of temporo-parietal and posterior cingulate hypometabolism is well established (Mosconi Citation2005) (). More interestingly, it has been shown that, using a detailed anatomical sampling approach and MRI/PET coregistration, enables imaging of early entorhinal cortex (EC) hypometabolism predictive of future clinical decline (de Leon et al. Citation2001). Application of hippocampal mask derived from manual hippocampal tracing on MRI images revealed that hippocampal hypometabolism is not only present in both MCI and AD relative to controls (Mosconi et al. Citation2005), but also predictive of cognitive decline in healthy subjects (Mosconi et al. Citation2008). Overall, the precise application of anatomical sampling is supported by post-mortem studies showing the EC and the hippocampus as the earliest sites of neurofibrillary tangle involvement and subsequent spreading of pathology to neocortical regions.
Figure 5. Amyloid deposition (upper panel, white arrows) and glucose hypometabolism (lower panel, red arrows) in an AD patient. Images from [11C]PIB-PET and [18F]FDG-PET, respectively. SUVR, standardised uptake value ratio, presented as ratios to cerebellum).
![Figure 5. Amyloid deposition (upper panel, white arrows) and glucose hypometabolism (lower panel, red arrows) in an AD patient. Images from [11C]PIB-PET and [18F]FDG-PET, respectively. SUVR, standardised uptake value ratio, presented as ratios to cerebellum).](/cms/asset/6a8e5ff6-f224-492e-8a8e-ee0282afc90a/iwbp_a_1375556_f0005_c.jpg)
Although they are not included in current diagnostic guidelines, other imaging markers are being actively studied. Decreased cerebral blood flow (CBF) in MCI and AD patients has been documented. Moreover, impaired groups exhibit not only reduction in resting CBF but also impairment in vasoreactivity as measured by vasodilation in response to carbon dioxide increase (Glodzik et al. Citation2013). The areas showing resting and challenge abnormalities include multiple neocortical regions as well as the hippocampus. Proton magnetic resonance spectroscopy (H-MRS) has been employed for many decades and has consistently confirmed the decrease in N-acetylaspartate (NAA) levels: the marker of normal neuronal functioning. Reductions are measurable with global techniques, such as the whole-brain NAA approach, as well as with single-voxel spectroscopy (Glodzik et al. Citation2015; Ratai et al. Citation2016). Reductions precede volume loss, as demonstrated by a study where MCI subjects had significantly higher grey matter volumes than AD patients, but their NAA levels did not differ (Glodzik et al. Citation2015). Another feature of 1H-MRS in AD is an increase in myo-inositol levels (Ratai et al. Citation2016).
Comparison of CSF and Aβ-PET in early diagnostics; new emerging neuroimaging technics
Aβ and Tau pathology in AD can be assessed not only in the CSF, but also via PET. The last decade brought a proliferation of PET amyloid tracers including widely used first-generation 11C Pittsburgh compound B (PIB) and several recently FDA-approved fluorinated radiopharmaceuticals: florbetapir, florbetaben and flumetamol. Although the first- and second-generation tracers differ in their degree of cortical binding and signal-to-noise ratio, they exhibit a similar pattern of cortical retention in AD patients (Villemagne Citation2016). The pattern consists of high signal in frontal, parietal and lateral temporal cortices, striatum, cingulate and precuneus, with sparing of the MTL and occipital cortex (Villemagne Citation2016). The findings that about 25% of cognitively healthy individuals have appreciable amyloid deposition as demonstrated by PET imaging (Mathis et al. Citation2012; Villemagne Citation2016), and 60% of MCI patients have levels comparable to those seen in AD (Mathis et al. Citation2012), seem to support a long silent pre-clinical phase of the disease.
PET imaging of Aβ
The development of a PET radioligand with a high affinity for aggregated Aβ revolutionised the field of AD by providing a way to visualise amyloid plaque deposition in vivo. The first such tracer was 11C-labelled N-methyl 11C-2-(4-methylaminophenyl)-6-hydroxybenzothiazole, also known as PIB (Wang et al. Citation2002). Histological work using autoradiography and immunohistochemistry indicated that this tracer has a high affinity for fibrillar and cored plaques (Klunk et al. Citation2003; Klunk et al. Citation2004; Bacskai et al. Citation2007). PET amyloid tracer binding is increased in individuals with an AD diagnosis, those with MCI who later develop dementia due to AD, and approximately one-third of older adults who are cognitively normal at the time of the PET scan (Vlassenko et al. Citation2011; Johnson et al. Citation2012; Vlassenko et al. Citation2012; Risacher and Saykin Citation2013). Similar to what is seen with CSF Aβ42, the APOE ε4 allele is associated with greater PET amyloid deposition across both pre-clinical and clinical phases of the disease (Morris et al. Citation2010; Johnson et al. Citation2012; Risacher and Saykin Citation2013).
The pattern of binding observed with amyloid PET tracers mirrors that seen in histopathological evaluation (Braak and Braak Citation1991a, Citation1991b). The greatest deposition is observed in the precuneus, posterior cingulate, medial frontal, lateral parietal and lateral temporal cortices. These regions are part of the functional brain network known as the default mode network (Buckner et al. Citation2005), which is highly connected with the rest of the brain. In both LOAD and ADAD PET deposition is most prominently seen early in the course of the disease in the precuneus and posterior cingulate gyrus, before appearing in other regions. After initial presentation, patterns of deposition are quite diffuse, with increased PET tracer binding present throughout the brain, even during pre-clinical stages of the disease.
PET amyloid scans can be visually read as ‘positive’ or ‘negative’. A positive scan is one that has high cortical uptake and indicates moderate to severe Aβ deposition. As an alternative to visual reads, data can be processed to provide a quantitative measure of plaque burden. Typically values from a set of key regions are averaged together to provide a summary measure of Aβ deposition. This quantitative data can either be examined as a continuous variable or transformed into a binary designation of positivity or negativity. As with CSF Aβ42 levels, approximately one-third of cognitively normal elderly individuals are amyloid positive by PET. The frequency of PET positivity increases with advancing age (Jack, Wiste, Weigand, et al. Citation2014), and also rises to 60% in MCI and 90% in clinically diagnosed AD cases (Johnson et al. Citation2012). Over time cognitively normal and MCI individuals who are positive for amyloid PET (or CSF Aβ42) have an elevated risk for subsequent cognitive decline (Johnson et al. Citation2012; Risacher and Saykin Citation2013; Vos et al. Citation2013; Vos et al. Citation2016).
Due to the relatively short (∼20 min.) half-life of 11C, PIB usage is limited to facilities that have cyclotrons. Since the initial introduction of PIB, 18F compounds with a longer half-life (∼110 min.) have been developed (Morris et al. Citation2016). These 18F tracers have similar properties to PIB and demonstrate a high affinity for fibrillary Aβ but have more non-specific binding in white matter. This greater white matter binding observed with many 18F tracers alters the presentation for visual reads and requires the numerical quantification of deposition to compensate for ‘spillover’ from white matter into cortical regions.
PET imaging of Tau
Developing Tau imaging deserves a special mention. Multiple fluorinated tracers are currently being studied. So far, a distinctive pattern of inferior temporal and posterior parietal retention in AD patients has been described. Furthermore, it has been documented that the degree of binding correlates with the severity of dementia symptoms (Okamura et al. Citation2016).
Tau PET imaging is a nascent technique but may provide a new resource to characterise the development and spread of tangle pathology in vivo. As briefly introduced in previous sections, there are six different Tau isoforms that can be grouped based upon whether they have three or four repeats (3R and 4R) of the microtubule-binding domain. Some tauopathies have only 3R Tau (e.g. Pick’s disease), others only 4R (e.g. progressive supranuclear palsy (PSP)), or a mixture of 3R and 4R (e.g. AD). In these neurodegenerative disorders the deposition of Tau is not uniform throughout the brain; there are disease-specific regional patterns of Tau deposition. In AD, post-mortem histopathological work shows that NFT pathology is first observed in the transentorhinal region before spreading in turn to the EC, hippocampus, and the rest of the MTL (Braak and Braak Citation1991a; Citation1991b). From the confines of the MTL the pathology spreads to the association neocortex and finally into primary sensory cortices. NFTs are also observed in typical aging, but this pathology is constrained to the MTL. Tau PET imaging can quantify both how much aggregated Tau is present in the brain and also the spatial pattern of its deposition. Early work has demonstrated increased tracer binding in lateral temporal regions in pre-clinical individuals and further uptake in the temporal lobe, lateral occipital cortex and temporal parietal junction in later disease stages (Chien et al. Citation2013; Gordon, Friedrichsen, et al. Citation2016; Johnson et al. Citation2016). While early work with Tau PET has been promising, more studies must be performed to understand the selectivity of these tracers to AD and other neurodegenerative disorders and their specificity to tau inclusions and different strains.
Comparison between CSF and PET markers
Amyloid PET ligand retention is negatively correlated with CSF Aβ42 levels but has no significant relationship with either Aβ38 or Aβ40 (Fagan et al. Citation2009; Janelidze, Zetterberg, et al. Citation2016; Lewczuk et al. Citation2017). This relationship is consistent with plaques being primarily composed of Aβ42 fibrils, with CSF Aβ42 reductions resulting from an active sequestration into aggregated forms (i.e. plaques). The high correspondence between markers provides strong evidence that these measures capture the same underlying pathological process despite measuring different forms of the pathological protein (fibrillar Aβ with PET and soluble Aβ with CSF). However, the concordance between these two markers is not perfect, with a proportion of individuals consistently observed who are considered amyloid-negative by PET but amyloid positive by CSF Aβ42 or, less often, vice versa: amyloid positive by PET and amyloid-negative by CSF Aβ42 or Aβ42/40 ratio. Some of this discordance has been shown to reflect individuals who are simply low producers of Aβ since normalising the Aβ42 values to overall Aβ levels (e.g. using a ratio of Aβ42 to the more abundant Aβ40 species) reduces the amount of discordance () (Janelidze, Zetterberg, et al. Citation2016; Racine et al. Citation2016; Lewczuk et al. Citation2017). Emerging data also support a temporal delay, where reductions in CSF Aβ42 are detectable prior to amyloid positivity by PET (Bateman et al. Citation2012; Palmqvist et al. Citation2016; Vlassenko et al. Citation2016). When biomarkers are measured early in the disease, this temporal lag would contribute to a discordance. Therefore, while amyloid PET and CSF Aβ42 are often considered interchangeable, CSF Aβ42 (and/or the Aβ42/Aβ40 ratio) likely detects the earliest changes in Aβ pathology, but CSF Aβ42 levels then plateau during early symptomatic stages. Increases in amyloid PET become detectable after initial changes in CSF, but PET measures continue to increase later into the course of the disease.
Figure 6. Scatterplots of cortical amyloid PET load using [11C]PiB and Aβ1–42 concentrations (A) and Aβ42/40 ratio (B). Vertical line represents dichotomous cut-off for PiB positivity. Horizontal lines represent the best-performing cut-offs of the respective CSF biomarkers calculated in the present study. Green areas comprise CSF/PET concordant results (either CSF–/PET– or CSF+/PET+), yellow areas comprise discordant results with normal CSF and abnormal PET (CSF–/PET+), and red areas include results with abnormal CSF and normal PET (CSF+/PET–). Note: (a) better concordance between Aβ42/40 and PET compared to Aβ1–42 and PET, and (b) significantly more CSF+/PET– than CSF–/PET + discordant cases for both CSF biomarkers. Reprinted slightly modified from (Lewczuk et al. Citation2017) with kind permission from IOS Press. The publication is available at IOS Press through http://dx.doi.org/10.3233/JAD-160722.
![Figure 6. Scatterplots of cortical amyloid PET load using [11C]PiB and Aβ1–42 concentrations (A) and Aβ42/40 ratio (B). Vertical line represents dichotomous cut-off for PiB positivity. Horizontal lines represent the best-performing cut-offs of the respective CSF biomarkers calculated in the present study. Green areas comprise CSF/PET concordant results (either CSF–/PET– or CSF+/PET+), yellow areas comprise discordant results with normal CSF and abnormal PET (CSF–/PET+), and red areas include results with abnormal CSF and normal PET (CSF+/PET–). Note: (a) better concordance between Aβ42/40 and PET compared to Aβ1–42 and PET, and (b) significantly more CSF+/PET– than CSF–/PET + discordant cases for both CSF biomarkers. Reprinted slightly modified from (Lewczuk et al. Citation2017) with kind permission from IOS Press. The publication is available at IOS Press through http://dx.doi.org/10.3233/JAD-160722.](/cms/asset/acfd5624-54f1-4e60-bc39-c7b20c6611a7/iwbp_a_1375556_f0006_c.jpg)
While there is an established body of work examining Aβ with both CSF and PET, only recently have similar analyses been possible for Tau. Initial studies have shown positive correlations between CSF Tau and pTau and PET measures of tauopathy (Chhatwal et al. Citation2016; Gordon, Friedrichsen, et al. Citation2016). However, such work is very preliminary. Additional studies are needed to confirm both the strength and temporal associations between the two modalities and better characterise the exact relationship between Tau markers in CSF and PET.
Overview of the current AD diagnostic guidelines
Overview of current AD diagnostic guidelines
As reviewed and stressed on several occasions in this paper, biomarker research conducted in the last decades has shifted AD conceptualisation from a clinical-pathological entity to a clinical-biological one and AD is now defined as a pathological continuum that can be arbitrarily divided in three stages: pre-clinical (abnormal biomarkers and no or only subtle cognitive impairment), MCI or prodromal AD (abnormal pathophysiological biomarkers and episodic memory impairment) and dementia (abnormal biomarkers and clear cognitive and functional impairment). By enabling the assessment of AD pathophysiology in vivo and independently of dementia, biomarkers have not only produced a major shift in both AD conceptualisation but also in its diagnosis, as well as playing an important role in drug development (Cummings Citation2011).
The possibility of assessing relevant AD pathophysiology in living persons through biomarkers has resulted in a change in guidelines and diagnostic criteria for AD. Two sets of criteria recently published will be discussed in more detail in this paper; one by the IWG that has recently been revised (IWG-2 (Dubois et al. Citation2014)) and the other by working groups assembled by the NIA and the Alzheimer’s Association in the US (McKhann et al. Citation2011). In short, although both groups define AD as a pathological continuum, the NIA-AA defines different clinical syndromes and the pre-clinical stage, which are diagnosed with their own specific algorithm. The NIA-AA divided the clinical phase of AD into MCI and AD dementia but employ different approaches to the diagnosis in each stage of the illness.
MCI due to AD (Albert et al. Citation2011). The clinical criteria for MCI are the same as those previously published. The NIA-AA criteria stratify the diagnosis of MCI with biomarkers to determine the likelihood that the syndrome is due to AD. A single positive biomarker of either amyloid abnormalities or neurodegeneration supports intermediate likelihood of MCI due to AD and two biomarkers, one of amyloid type and one of neurodegeneration type, support high likelihood of MCI due to AD.
AD dementia (McKhann et al. Citation1984). The NIA-AA criteria apply an approach that differs from the approach to MCI due to AD. Ten categories of dementia of the AD-type are established.
By contrast, a single diagnostic algorithm that can be applied at any stage of the disease continuum reinforcing our understanding of AD as a clinical-biological entity, is proposed by the IWG. The work performed by both the IWG and the NIA-AA is still evolving, so slight modifications in the proposed diagnostic criteria are expected. Moreover, harmonisation efforts are currently underway so hopefully these two sets will eventually merge into a single one. Both IWG and NIA-AA criteria agree in the integration of AD biomarkers in the diagnostic process and in the recognition of an asymptomatic (pre-clinical) stage that can be determined through these biomarkers (Sperling et al. Citation2011; Dubois et al. Citation2014). Nevertheless, whereas biomarker abnormalities are required for diagnosis according to IWG criteria, the NIA-AA ones use biomarker information (if available) to assess the likelihood (high, intermediate or unlikely) that a clinical syndrome is due to AD. In addition, whereas the NIA-AA criteria support the diagnosis of AD in asymptomatic individuals with biomarker evidence for Aβ accumulation, for the IWG-2, these persons are considered to be in an at-risk state of the disease. Finally, it is to mention that IWG criteria for typical AD require an objective impairment in episodic memory whereas a less strict approach is considered by NIA-AA criteria for the diagnosis of MCI due to AD.
Overview of the current research criteria
IWG criteria (Dubois et al. Citation2007, Citation2014)
The International Working Group on the Research Criteria for Alzheimer’s Disease emphasises a single clinical-biological set of criteria across the spectrum of the symptomatic phases of the disease consisting of:
a specific clinical phenotype: an amnestic syndrome of the hippocampal type is the keystone of the clinical syndrome of typical AD (Dubois and Albert Citation2004). It is best identified by tests that control for an effective encoding of the to be remembered items and that facilitate their retrieval. Using memory tests with cueing, either at bedside (5-Word Test) (Dubois et al. Citation2002) or by neuropsychologist (Free and Cued Selective Reminding Test – FCSRT) (Grober et al. Citation1988) is recommended because of their good specificity for AD (Dierckx et al. Citation2009; Mormont et al. Citation2012; Wagner et al. Citation2012).
Other memory tests, particularly those based on list learning and delayed recall, can also be effective in identification of the amnestic syndrome of AD. These tests include different versions of the paired-associate learning and the Rey auditory verbal learning tasks (Fowler et al. Citation2002; Estevez-Gonzalez et al. Citation2003; Lowndes et al. Citation2008). An amnestic presentation may not always be the case in AD, and other clinical phenotypes can be associated with post-mortem evidence of AD pathology (Murray et al. Citation2011). Therefore, the IWG has introduced the concept of ‘atypical forms of AD’ with specific clinical phenotypes that include non-amnestic focal cortical syndromes, such as logopenic aphasia, bi-parietal atrophy, PCA and frontal variant AD.
the presence of AD biomarker. Biomarkers are supportive features of a diagnostic framework that is anchored around a core clinical phenotype. The AD diagnosis evoked in case of a specific clinical phenotype (either typical or atypical) needs confirmation from the presence of one or several AD biomarkers. Among these, in vivo evidence of AD pathology (CSF changes of Abeta and Tau levels or positive amyloid PET) is the most specific (Dubois et al. Citation2014) and should be required for research purposes or atypical cases.
For the IWG, the diagnosis of AD is made on the basis of both clinical and biological evidence, with a high level of specificity and predictive validity. The diagnostic algorithm begins with a characteristic clinical phenotype (typical or atypical) and then requires supporting biomarkers that reflect the underlying AD process or pathology. The availability of specific in vivo biomarkers of AD pathology has moved the definition of AD from a clinical-pathological entity to a clinical-biological entity. As biomarkers can be considered as surrogate markers of the histopathological changes, the clinical diagnosis can now be established in vivo and reference to dementia may no longer be needed.
Proposal for a new lexicon for AD
The new conceptual framework of AD suggests redefining a common lexicon (Dubois et al. Citation2010) concerning AD and related entities:
(1) Alzheimer’s disease
AD should now be a label defining the clinical disorder which starts with the onset of the first specific clinical symptoms of the disease and which encompasses both the prodromal and dementia phases. AD now refers to the whole spectrum of the clinical phase of the disease and is not restricted to the dementia syndrome.
(2) AD dementia
It is likely to still be meaningful to identify the dementia threshold as a severity milestone in the course of disease. The presence of a dementia adds a set of management issues for the clinician to address including those related to patient autonomy such as driving, financial capacity, as well as those related to care living. The transition between the two states may be arbitrary when the underlying disease is a continuous process.
(3) Prodromal AD
The prodromal stage of AD refers to the early symptomatic pre-dementia phase of the disease, characterised by a specific clinical phenotype of the amnestic syndrome of the hippocampal type with positive pathophysiological biomarkers. The memory disorders can be isolated or associated with other cognitive or behavioural changes that may not be severe enough to interfere significantly with activities of daily living.
(4) Atypical AD
Atypical forms of AD refer to well-defined, but less common, clinical phenotypes that occur with AD pathology. These include cortical syndromes of logopenic aphasia, PCA and frontal variants of AD. The diagnosis of atypical AD is supported by positive pathophysiological biomarkers of AD.
(5) Mixed AD
Mixed AD is defined by the co-occurrence of Alzheimer’s pathology with other biological causes of cognitive decline, mainly cerebrovascular disease or Lewy body pathology. Patients should fulfil the diagnostic criteria for typical AD and additionally present with clinical and brain imaging/biological evidence of other co-morbid disorders such as cerebrovascular disease or DLB.
(6) Pre-clinical states of AD
There is a growing interest in the long pre-clinical phase of AD. This pre-clinical phase refers to cognitively normal individuals with biomarker evidence of Alzheimer pathology. Positive retention of amyloid PET or low Aβ level in the CSF is being reported in up to 30% of older normal controls (Rowe et al. Citation2003). These normal individuals may or may not later convert to prodromal AD. Such evolution to a clinical disease may depend on several factors including genetic factors (such as APOE genotype), other risk factors (such as vascular factors) or protective factors (diet, cognitive reserve) and co-morbidities (e.g. T2DM). In the absence of knowledge about what factors combine to influence conversion, these normal individuals who are biomarker positive have been defined as ‘asymptomatic at risk for AD’ or ‘asymptomatic amyloidosis’, because a large percentage of them will not progress to a symptomatic clinical condition. This is not the case of cognitively normal individuals sharing an autosomal-dominant monogenic AD mutation (Bateman et al. Citation2012). Because of the full penetrance of the mutations, these individuals will inevitably develop a clinical AD if they live long enough. They are at a ‘pre-symptomatic’ state for AD.
Research versus clinical criteria
While these newer criteria both aim to allow for the diagnosis of AD earlier and, more accurately, they depend on the availability of suitable biomarkers. According to a report of Alzheimer’s Disease International (AsDI Citation2009), 58% of people with dementia live in low- and middle-income countries. Even in developed countries, there is still a lack of availability of high-tech investigations for biomarkers outside tertiary or research centres. Therefore, the new diagnostic approach can only apply in expert centres with facilities to assess a large spectrum of biomarkers, viable assessment procedures and with access to normative data. In this context, such criteria may be useful for complex diagnosis and for early dementia cases.
Ethical implications of the new biomarker-based diagnostic criteria for AD
Ethical challenges arising from new AD diagnostic criteria
Biomarker-based criteria discussed in the previous section are currently being applied in academic settings and incorporated as inclusion criteria in clinical trials. In this scenario, a number of distinct ethical issues in research and clinical settings arise that are considered in the following sections.
Ethical challenges in research studies
Ethical issues arising from AD biomarkers are mainly related with studies and trials involving asymptomatic, pre-clinical individuals, in relation to determining appropriate risk/benefit ratios and whether or not biomarker status information that would normally not be received in routine clinical practice should (or should not) be disclosed (Lingler and Klunk Citation2013; Roberts et al. Citation2013; Kim et al. Citation2015). The main risks deriving from disclosure of biomarker status include placing a cloud of uncertainty over participants that may affect their daily lives and/or performance in specific procedures, and the complexity of conveying clinically non-relevant biomarker status of uncertain prognosis. On the other hand, main benefits comprise the protection of biomarker-negative individuals from risks and harms related to clinical studies’ procedures, and the positive impact that this information may have on people’s lives. The relevance of differentiating between study types (observational versus interventional) to favour disclosure or not, was recently highlighted (Molinuevo et al. Citation2016).
When considering the prospect of long-term studies in pre-clinical AD, to avoid the impact of knowing on participants’ performance, together with disclosing clinically non-relevant biomarker or genetic status of uncertain prognosis, blinded enrolment (i.e. when biomarker status is not disclosed) was recommended for observational studies, unless the aim of the study is to investigate the impact of disclosure on outcome. By contrast, transparent enrolment (i.e. requiring disclosure) was favoured for interventional studies, since protecting the subjects that are biomarker negative from risks and harms related to the intervention prevail over the motivations noted above to support blinded enrolment. Furthermore, a recent systematic analysis comparing the ethics of transparent versus blinded enrolment in AD prevention trials provided strong arguments that there are no special risk-benefit, informed consent, or fair participant selection issues that require blinded enrolment.
An important additional argument for the transparent design (i.e., requiring gene or biomarker disclosure) is that this design better reflects the future clinical practice of drug prescription to those who learn that they have an altered AD biomarker. A design that includes biomarker disclosure would therefore more closely resemble routine clinical practice and so can provide information about the success of this potential clinical future. Furthermore, blinded designs require risk-negative participants to be enrolled in order to avoid ‘disclosure by enrolment’; thus, transparent enrolment has the advantage of minimising the number of participants enrolled to attain sufficient statistical power to obtain clinically meaningful results. New trials currently under design, such as the new API trial with APOE ε4 homozygotes, will be disclosing APOE status (Green et al. Citation2009).
Research designs that disclose risk information can further protect subjects by implementing safeguards. Before disclosing genetic or biomarker status, the investigator ought to assess if the potential participant is emotionally capable of enrolling in a study. Data from the REVEAL study clearly show that those who exhibited a high degree of emotional stress before undergoing genetic testing were more likely to have emotional difficulties after disclosure (Green et al. Citation2009). For those included, one way to reduce potential stress is to provide continuous counselling throughout the study or through social forums where open discussions can take place as this has been shown to have a direct positive effect on stress and anxiety (Billings and Moos Citation1985).
Ethical issues in clinical practice
All medical decisions generate consequences for the patient and society. Medical practice should therefore be performed under the guidance of the following ethical principles: beneficence, nonmaleficence, autonomy, justice, integrity, dignity and vulnerability. With regard to AD diagnosis, as it was stated in the AD-Bill of Rights: ‘Every person diagnosed with Alzheimer’s disease or a related disorder deserves to be informed of one’s diagnosis’. Furthermore, patient advocacy groups, such as the US Alzheimer’s Association have also been emphatic on this point ‘Except in unusual circumstances, physicians and the care team should disclose the diagnosis to the individual with AD because of the individual’s moral and legal right to know’.
Therefore, the major ethical issues, and their corresponding ethical principles, governing early diagnosis (including early diagnosis supported by biomarkers) are self-determination (autonomy), efficacy (beneficence) and safety (nonmalfeasance), and from the previous quotes it is inferred that the ruling principle is currently autonomy, since self-determination has grown as a fundamental right of the individual, which is especially important in the early diagnosis of a neurodegenerative disease such as AD.
Beneficence is the ethical principle closely related to the benefit, outcome for the patient and the efficacy of the intervention. Nowadays there is no aetiological treatment for AD, so the potential benefits of early prodromal diagnosis are to decrease the anxiety of uncertainty, to allow for the early introduction of (not only pharmacological) interventions, and to help the individual and his/her family prepare for dementia’s onset. Most of these potential benefits are relative and depend on the attitude, beliefs, personality, character and even spirituality of the individual, reinforcing again the fundamental importance of the autonomy ethical principle. Furthermore, the psychological benefits of early diagnosis are individual-related, and they may similarly depend on the person’s character, personality and probably on the level of anxiety introduced by uncertainty. In this sense, the participant willing to know biomarker results supporting an early diagnosis and who may benefit from it, most likely belongs to a self-selected subgroup of people. This fact implies a straight link with the governing principle of the programme: autonomy.
Autonomy is the ethical principle related to individual freedom, personal decision-making and self-determination. As mentioned above, it is the ruling principle of medical practice and we believe it should also be the governing principle of early prodromal diagnosis, since the decision of wishing to know or not to know should be individually taken by a competent individual and its potential benefit may be mediated through an autonomous decision. Autonomy should be reassured through self-soliciting diagnosis, permanent capacity to change one’s will, confidentiality and strict informed consent. Informed consent embodies the need to respect persons and their autonomous decisions. In this sense, competent consent is essential to justify subjects (Emanuel et al. Citation2000) involvement in the pre-dementia or prodromal diagnosis of AD. Competence is a pivotal concept in decision-making in medical practice, allowing individuals to manifest autonomy, their right to decide by themselves.
In summary, the will to know if a memory problem represents the beginning of AD, hence the need to disclose biomarker results, is the main driving factor for seeking an early diagnosis. Furthermore, it is the keystone of the ethical principle of autonomy and the driver for trying to perform an early diagnosis on behalf of the patient. This should still be put in relation to that we have no effective treatment, as well as the risk for a false-positive diagnosis (Winblad et al. Citation2016).
The concept of suspected non-AD pathophysiology (SNAP)
Origins of the SNAP construct
SNAP is a biomarker-based construct denoting individuals who have a normal Aβ biomarker pattern, but have an abnormal biomarker of neurodegeneration or neuronal injury (Jack et al. Citation2012). The roots of the SNAP construct lie in the design of the above-discussed NIA-AA recommendations for the diagnosis of AD (Albert et al. Citation2011; Jack et al. Citation2011; McKhann et al. Citation2011; Sperling et al. Citation2011). The NIA-AA recommendations defined three clinical stages of AD: pre-clinical, MCI and dementia (Albert et al. Citation2011; Jack et al. Citation2011; McKhann et al. Citation2011; Sperling et al. Citation2011). In addition, pre-clinical AD was divided into three stages. Imaging and CSF biomarkers were integrated into the NIA-AA recommendations with two important criteria shaping how this was done (Jack et al. Citation2011). First, most biomarker research programmes employed primarily either imaging or CSF biomarkers, not both. Therefore, biomarkers had to function similarly in environments where either CSF or imaging was the dominant biomarker method. Second, the NIA-AA recommendations were designed for individuals in the AD pathway; they were not intended to encompass all cause dementia/cognitive impairment nor general cognitive aging. The assumption was therefore made that neurodegeneration/neuronal injury was related to AD tauopathy. The rationale for this assumed link between tauopathy and neurodegeneration/neuronal injury in AD was based on autopsy data (Ingelsson et al. Citation2004), as well as a proposed sequence of biomarker events where amyloidosis was an upstream event which promoted tauopathy (Jack et al. Citation2010, Citation2013). Tauopathy was directly responsible for neurodegeneration/neuronal injury, which, in turn, was the most proximate cause of clinical symptoms (Jack et al. Citation2010, Citation2013). These considerations led to the following implementation of biomarkers in the NIA-AA recommendations. Individuals were designated as either normal or abnormal for biomarkers of Aβ and Tau related-neurodegeneration/neuronal injury (Albert et al. Citation2011; Jack et al. Citation2011; McKhann et al. Citation2011; Sperling et al. Citation2011).
The SNAP construct emerged when the NIA-AA pre-clinical AD staging recommendations were applied to a clinically normal cohort (Jack et al. Citation2012). In these individuals who were over age 70, 31% fell into stages 1–3 of pre-clinical AD, 43% were amyloid normal and neurodegeneration normal (A − N−) and 23% were amyloid normal and neurodegeneration abnormal (A − N+). The A − N+ group was labelled SNAP on the assumption that this was a pathologically heterogeneous group with a variety of non-Alzheimer’s pathologies (Jack et al. Citation2012).
To reflect NIA-AA staging while accounting for SNAP, many research groups subsequently adopted a two-class biomarker construct in which participants were assigned to one of four biomarker categories: A − N−, A + N−, A − N + (SNAP) or A + N + (Knopman et al. Citation2012; Roe et al. Citation2013; van Harten, Smits, et al. Citation2013; Vos et al. Citation2013; Wirth et al. Citation2013; Jack, Wiste, Weigand, et al. Citation2014; Mormino et al. Citation2014; Toledo et al. Citation2014; Ivanoiu et al. Citation2015; Jack et al. Citation2015; Wisse et al. Citation2015; Burnham et al. Citation2016; Gordon, Blazey, et al. Citation2016; Jack, Therneau, et al. Citation2016). This two-class NIA-AA staging plus SNAP biomarker construct has been useful because it provided a common framework for different research groups to communicate findings from their own research cohorts.
Characteristics of clinically normal and MCI SNAP subjects
Early studies describing SNAP were not focussed on this group alone but instead were intended to compare individuals in different biomarker groups using the two-class NIA-AA staging plus SNAP biomarker construct. In these studies the A–N– group was often used as the reference in group-wise comparisons. Different biomarker methods were used to classify individuals in these studies. Some used imaging alone (Jack et al. Citation2012; Knopman et al. Citation2012; Wirth et al. Citation2013; Mormino et al. Citation2014; Ivanoiu et al. Citation2015), others CSF alone (Roe et al. Citation2013; van Harten, Smits, et al. Citation2013; Vos et al. Citation2013), or CSF combined with imaging (Toledo et al. Citation2014). Studies focussed on individuals who were clinically cognitively normal or MCI (Petersen et al. Citation2013a; Prestia et al. Citation2013; Caroli et al. Citation2015; Vos et al. Citation2015). The proportion of SNAP among clinically normal individuals over 65 years of age was consistent across these studies at roughly 25%. While the proportion of SNAP among MCI was less consistent, most likely due to smaller numbers, overall around 25% of MCI individuals also seem to fall into the SNAP category (Petersen et al. Citation2013a; Prestia et al. Citation2013; Vos et al. Citation2015; Caroli et al. Citation2015).
A consistent finding among all studies was that the proportion of APOE ε4 carriers among SNAP, both clinically normal and MCI, was far lower than among A + N+ or A + N– individuals. Another consistent finding was that SNAP individuals tended to be older than the A–N– reference group. Less consistent findings concerned sex predilection. Some studies found SNAP was more common in men than women, others did not. Baseline cognitive performance was also not consistent among studies. Some found that among clinically normal individuals, SNAP had worse baseline performance than the A–N– reference group (Mormino et al. Citation2014), while other studies did not find this difference (Burnham et al. Citation2016).
A question that arose soon after the introduction of SNAP was whether this construct was simply an artefact of classification, i.e. was it simply a collections of individuals who lie just on the normal side of the amyloid biomarker threshold and just on the abnormal side of the neurodegeneration/neuronal injury threshold? Burnham et al. (Citation2016) recently addressed this by performing a series of analyses addressing imaging and clinical characteristics of the four biomarker groups with and without removing individuals close to the biomarker thresholds. They found no difference in their results when individuals close to the classification thresholds were removed, thus proving that in most individuals SNAP was not a classification artefact.
Clinical/cognitive outcomes
One of the most meaningful potential uses of biomarker classification is as an aid in predicting clinical/cognitive outcomes. Every study to date that has examined outcomes has found that the A + N+ group has the worst clinical/cognitive outcomes of all biomarker groups. This has been true in cohorts composted of individuals who were clinically normal or MCI at baseline, and in cohorts where imaging or CSF was used for biomarker classification. The findings for SNAP participants, however, have not been uniform. Some studies found no difference in cognitive outcomes between SNAP and the A–N– reference group (Mormino et al. Citation2014; Burnham et al. Citation2016), while other studies found SNAP have worse outcomes than A–N– individuals (Petersen et al. Citation2013b; Jack, Therneau, et al. Citation2016).
Imaging outcomes
As stated above, longitudinal MRI and FDG-PET provide meaningful measures of the progression of neurodegeneration. The data on SNAP and imaging outcomes is inconsistent. Some groups found that rates of hippocampal atrophy are not different in SNAP compared with the A–N– reference group (Burnham et al. Citation2016; Gordon, Blazey, et al. Citation2016). Other groups, however, found greater rates of decline in hippocampal volume, cortical thickness and FDG metabolism in SNAP compared to A–N– individuals (Jack, Wiste, Knopman, et al. Citation2014; Knopman et al. Citation2016).
Controversies and future research
Publication of the SNAP construct has raised controversies (Chetelat Citation2013). Two obvious areas of controversy are outlined in the prior sections: what are the clinical and imaging outcomes in SNAP compared to other biomarker groups? A third controversy concerns the likely pathological substrates of SNAP. When SNAP was first described, we assumed that these individuals represented a heterogeneous collection of the many non-AD pathologies that increase in prevalence with age (Jack et al. Citation2012), including CVaD, DLB, TDP 43, hippocampal sclerosis, argyrophylicgrain disease and PART (Schneider et al. Citation2007; Schneider et al. Citation2009; Nelson et al. Citation2011; Sonnen et al. Citation2011; Crary et al. Citation2014). Pathological heterogeneity was assumed to occur not only across individuals but also within individuals, because most elderly individuals have more than one of these age-related pathological processes at autopsy (Schneider et al. Citation2007, Citation2009; Nelson et al. Citation2011; Sonnen et al. Citation2011).
We assumed that one of the pathologies underlying SNAP was PART. PART and SNAP share several important features (Crary et al. Citation2014; Jack Citation2014). Both are common in clinically normal elderly; APOE ε4 is underrepresented in both; both increase in prevalence with age; and MTL pathology features prominently in both. Two of the first four subjects who met criteria for SNAP and later came to autopsy also appear to have met autopsy criteria for PART (Vos et al. Citation2013). However, recent imaging studies have challenged this idea. Both Mormino et al. (Citation2016) and Wisse et al. (Citation2015) reported that Tau was not elevated in SNAP relative to the A − N− reference group.
A new classification scheme for biomarkers used in Alzheimer’s and cognitive aging research may help resolve some of the controversies about SNAP described above. This classification scheme is labelled ATN (Jack, Bennett, et al. Citation2016), and it groups biomarkers into three categories: (A) biomarkers of fibrillary Aβ deposition or associated pathophysiology (Blennow and Hampel Citation2003; Klunk et al. Citation2004); (T) biomarkers of paired helical filament Tau or its associated pathophysiology (Blennow and Hampel Citation2003; Villemagne et al. Citation2015; Brier et al. Citation2016; Johnson et al. Citation2016; Scholl et al. Citation2016, Schwarz et al. Citation2016); (N) biomarkers of neurodegeneration or neuronal injury. Each biomarker category is rated as normal (–) or abnormal (+). Individual scores might appear as A + T–N+, or A + T–N–, etc. Individuals with an A–T + N–, A–T–N + or A–T + N+ fall under the original definition of SNAP (Jack et al. Citation2012). The ATN classification construct will enable researchers to examine multi-modality biomarker associations where the effects of tauopathy and neurodegeneration/neuronal injury are segregated in individuals who meet criteria for SNAP ().
Figure 7. Tau PET and MRI in an A–T + N+ SNAP subject. Clinically normal 81-year-old male participant in the Mayo Clinic Study of Aging. Abnormal Tau PET uptake (AV1451) is present in the medial, basal, lateral temporal lobes bilaterally (left panel). Non-specific AV1451 uptake is present in the basal ganglia bilaterally. This participant also has medial temporal lobe atrophy (right panel) and a normal amyloid PET scan (PIB, not shown). This individual’s ATN profile was A–T + N+.
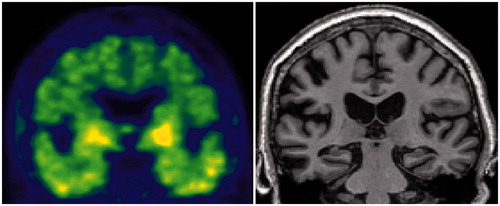
Legal and regulatory issues in early AD diagnostics: EMA statements
From a regulatory perspective, the European Medicines Agency (EMA) accepts both the IWG and the NIA-AA sets of criteria for diagnosis of AD, for research purposes, and for trial enrichment. The current position of EMA on the diagnostic guidelines is summarised in a draft guidance recently published (EMA Citation2016). This guideline follows the view that considers AD a pathophysiological continuum with a long-term pre-symptomatic stage preceding many years the clinical manifestation.
The aim of the above-cited EMA/CHMP draft guideline was to evaluate, among others, the impact of new diagnostic criteria for AD, taking into consideration also the asymptomatic and pre-symptomatic disease stages on clinical trial design; and the use of biomarkers in the different phases of drug development. However, adequate standardisation and validation of biomarkers for regulatory purposes is still lacking (Noel-Storr et al. Citation2013; Dubois et al. Citation2014). This also reflects the continuous advances in the diagnostic area of research. In this frame, a step forward is represented by the recent approval in the EU of the radiopharmaceuticals 18F-florbetapir, 18F-florbetaben and 18F-flutemetamol for PET imaging of Aβ plaques in the brain. These diagnostic ligands are used in patients evaluated for AD, following an accurate clinical assessment versus other forms of cognitive impairment; their usefulness is being investigated in large observational cohorts. Besides PET, also CSF biomarkers are currently considered, although it is recommended to measure multiple parameters such as Aβ1–42, total Tau or its hyperphosphorylated form (Hampel et al. Citation2014; Medina and Avila Citation2014).
While the core clinical criteria still remain fundamental, biomarkers may increase the specificity of diagnosis (Hampel et al. Citation2014). Unquestionably, standardisation and harmonisation in their use for early diagnosis of AD along the development of clinical trials needs continuous adjustment. In this context, validation of reliable and sensitive instruments to measure cognitive, functional, behavioural and neuropsychiatric symptoms especially in early disease stages are strongly encouraged by EMA and other regulatory bodies.
CSF biomarkers in clinical trials for AD
The growing use of CSF biomarkers in clinical practice and research studies has had an impact on clinical trials that have incorporated them, assisting in participant selection and monitoring of target engagement. Furthermore, they have the potential to demonstrate evidence of disease modification. It is anticipated that the standardisation of pre-analytical and analytical conditions, together with the implementation of fully automated assays of current and novel biomarkers, will increase the use of CSF markers in clinical trials. This may facilitate more efficient trial design that eventually will lead to successful treatments. The main potential applications of the CSF biomarkers in trials are to facilitate the selection of participants (cohort enrichment), to verify drug–target engagement, and to provide biological evidence of disease modification (Lleo et al. Citation2015; Parnetti, Eusebi, et al. Citation2016).
CSF biomarkers for inclusion/selection
The first report of a randomised trial that used CSF to enrich a study population of patients with MCI was published in 2015, and showed that only half of their participants had biological evidence of AD (Coric et al. Citation2015). The study was important because it demonstrated the value of CSF biomarkers in trials, in particular in a heterogeneous patient population such as MCI. Moreover, these data helped to explain previous trial failures in which the selection of participants was inadequate, thereby decreasing the power of these trials to reach their expected outcomes.
The most widely used biomarker for participant selection in clinical trials is Aβ1–42, either alone or in combination with total Tau. For example, the phase II study of the γ-secretase inhibitor Avagacestat required that patients had either low CSF Aβ1–42 levels or a high total Tau to Aβ1–42 ratio in addition to meeting clinical criteria for MCI (Coric et al. Citation2015). Two trials with the anti-amyloid antibody gantenerumab in patients with prodromal (clinicaltrials.gov ID: NCT01224106) and mild AD (clinicaltrials.gov ID: NCT02051608) also required low levels of Aβ1–42 in CSF for inclusion. Data released from the trial in prodromal AD also supported the value of CSF measures in selecting the patient population and it is expected that more trials will incorporate the same design.
CSF biomarkers as a measure of target engagement
The capacity of CSF biomarkers to track pathophysiological changes in CNS makes them excellent tools to verify drug–target engagement in clinical trials. This is a critical aspect since many of the previous trials in AD failed because they lacked adequate target engagement. The basic principle is that a change in the levels of specific markers that are related to the mechanism of pharmaceutical action would indicate that the drug is reaching its target. Many pharmacological studies have included changes in one or more CSF biomarkers among their primary or secondary endpoints. In this respect, trials with β-secretase inhibitors represent the best example of the successful use of a CSF marker as a measure of target engagement. Several trials with β-secretase inhibitors (LY2811376, LY2886721, E2609 and MK-8931) have detected a reduction in CSF levels of Aβ1–42, Aβ1–40, the sAPPβ or other subproducts of APP (Bell et al. Citation2013; Portelius et al. Citation2014; May et al. Citation2015). Other fragments, such as Aβ5–42, Aβ5–x or sAPPα, have been found to be increased in CSF, suggesting an enhanced alternative processing of APP following β-secretase inhibition (Mattsson, Rajendran, et al. Citation2012; May et al. Citation2015).
A similar approach has been used in trials with γ-secretase inhibitors and modulators. Some trials found a decrease in CSF levels of Aβ1–42, Aβ1–40 (Bateman et al. Citation2009; Tong et al. Citation2012; Coric et al. Citation2015) and Aβ1–38 (Tong et al. Citation2012), and an increase in CSF levels of Aβ1–14, Aβ1-15 and Aβ1–16 (Portelius et al. Citation2010; Portelius, Fortea, et al. Citation2012; Portelius, Zetterberg, et al. Citation2012). Other studies, however, did not find significant differences in levels of Aβ1–42 or Aβ1–40 compared to a placebo group (Siemers et al. Citation2006; Galasko et al. Citation2007; Fleisher et al. Citation2008; Portelius, Zetterberg, et al. Citation2012; Doody et al. Citation2013; Imbimbo et al. Citation2013; Doody et al. Citation2015). Peptidomic approaches could also be useful in the identification of biomarkers to verify target engagement. The analysis of the CSF peptidome by liquid chromatography and mass MS prior to and following a single dose of the γ-secretase inhibitor semagacestat led (Holtta et al. Citation2016) to the identification of 11 peptides that were altered following pharmaceutical intervention.
The effects of anti-amyloid immunotherapy have also been evaluated using CSF biomarkers, although data are more difficult to interpret than in the studies of β- and γ-secretase inhibitors. None of the trials with the active immunisation compounds, AN1792 and CAD-106, were able to show changes in the levels of amyloid-derived CSF biomarkers (Gilman et al. Citation2005; Winblad et al. Citation2012). Likewise, treatment with the monoclonal antibody bapineuzumab did not change amyloid marker levels in CSF (Blennow et al. Citation2012). In contrast, patients treated with solanezumab, a humanised monoclonal antibody designed to target soluble Aβ, did show an increase of total Aβ1–40 and Aβ1–42 levels in CSF (Siemers et al. Citation2010; Farlow et al. Citation2012; Doody et al. Citation2014). Although the primary clinical outcome was not achieved in that study, the authors hypothesised that the changes observed in CSF levels could indicate a shift of Aβ from the CNS to the periphery or perhaps a mobilisation between compartments reflecting a change in the balance between fibrillar and soluble Aβ (Farlow et al. Citation2012; Doody et al. Citation2014). Two phase I dose-escalation studies with ponezumab, another monoclonal antibody, also determined post-treatment CSF Aβ1–42 levels but showed contradictory results (Landen et al. Citation2013; Miyoshi et al. Citation2013). In summary, trials with β- and γ-secretase inhibitors have clearly shown that CSF biomarkers can be used to verify drug-target engagement and a similar paradigm can be applied to other therapeutic strategies.
CSF biomarkers as a measure of disease modification
There is evidence that adequate markers of target engagement might not necessarily capture disease-modifying effects (Mattsson, Carrillo, et al. Citation2015). The theragnostic value of each biomarker should be individually assessed based on its association to cognitive or functional endpoints. To date, all drugs attempting to modify the course of AD have failed in their primary clinical endpoints. For this reason, it is difficult to address the question of whether CSF biomarkers can predict clinical response. In addition, the total number of patients with CSF measures in clinical trials is still low, further limiting the possibilities to draw firm conclusions.
Total Tau and pTau levels have been investigated as surrogate markers of disease modification and as indicators of the downstream effects in anti-amyloid treatments. The trial with AN1792, the first active Aβ immunisation study showed that antibody responders had a reduction in CSF total Tau levels compared to those patients who received placebo (Gilman et al. Citation2005). However, treatment with CAD106, another active immunotherapy, did not change the levels of Tau or pTau (Winblad et al. Citation2012). Most trials with passive immunisation have also included Tau markers in CSF in a subset of subjects. Treatment with bapineuzumab was associated with a decrease in CSF pTau levels in both the phase II and phase III trials (Blennow et al. Citation2012; Salloway et al. Citation2014). However, this effect was not observed after treatment with solaneuzumab (Doody et al. Citation2014). These findings could be interpreted as if treatments that act on fibrillar Aβ have a greater impact on downstream neurodegeneration than those targeting soluble Aβ (Lleo et al. Citation2015). Results from ongoing studies with these and other anti-amyloid treatments might shed new biological evidence for the role of CSF markers to detect disease modification.
In addition to Tau and pTau, other proteins have been investigated in CSF to monitor the pathophysiological pathways in AD. These novel biomarkers could provide further insights in clinical trials. Tau-independent markers of neuronal damage, such as NF-L, VLP-1, or the heart-type fatty acid-binding protein, could give additional information about disease modification effects in trials with anti-Tau therapies, in which levels of total Tau and pTau could be the result of target engagement (Parnetti, Eusebi, et al. Citation2016). Synaptic markers (NG, SNAP-25), markers of neuroinflammation/microglial activation (YKL-40 or CCL2) and markers of protein homeostasis and lysosomal dysfunction (LAMP-1 and LAMP-2) could be used as indicators of disease progression (Alcolea et al. Citation2014; Cavedo et al. Citation2014; Alcolea et al. Citation2015; Parnetti, Eusebi, et al. Citation2016). Markers to detect common associated neuropathological comorbidities such as Lewy body or TAR DNA-binding protein 43 pathologies should also be further investigated in clinical trials of AD (Cavedo et al. Citation2014; Mattsson, Carrillo, et al. Citation2015; Parnetti, Eusebi, et al. Citation2016).
Future directions
There are still some crucial issues that need to be improved in order to achieve an optimal implementation of CSF biomarkers in clinical trials. On the one hand, more observational longitudinal studies with larger sample sets are needed to determine the patterns of biomarker change along the natural course of the disease. On the other hand, there is an urgent need to harmonise the assays across different platforms and to develop international reference materials and methods and global cut-points (Carrillo et al. Citation2013). The publication of international recommendations to standardise pre-analytical conditions (del Campo et al. Citation2012; Vanderstichele et al. Citation2012) and the launch of global initiatives to survey and monitor inter-centre variability in analytical procedures (Mattsson et al. Citation2011, Citation2013) have been major advances in this respect. Finally, it is anticipated that as some trials show clinical benefit in the ongoing AD trials, the field will be able to draw more solid conclusions about whether CSF markers of neurodegeneration can be used alone or in combination as surrogate markers of efficacy (Box 1).
CSF biomarkers in subjective cognitive decline
Epidemiological studies have shown that the purely subjective feeling of cognitive decline with still normal performance on standard cognitive tests (subjective cognitive decline, SCD) is associated with an increased risk of future cognitive decline and dementia (Mitchell et al. Citation2014). Moreover, there is increasing evidence that the combination of SCD with biomarkers may be particularly useful to identify AD very early at the pre-MCI stage, which makes this approach highly attractive for clinical trials and dementia prevention.
MRI studies have provided evidence that SCD is often associated very subtle AD-like patterns of brain atrophy (Peter et al. Citation2014; Perrotin et al. Citation2015; Schultz et al. Citation2015). Even though a recent meta-analysis has revealed no higher prevalence of amyloid positivity in individuals with SCD in comparison to controls (Jansen et al. Citation2015) individual PET studies have shown an increased likelihood of amyloid positivity in SCD and a correlation of SCD severity with amyloid deposition (Amariglio et al. Citation2015; Perrotin et al. Citation2016; Zwan et al. Citation2016). The discrepancy between studies is mainly related to the lack of standardisation of the definition and assessment of SCD. To address this, an international working group (SCD initiative) recently published consented research criteria of SCD, which are recommended to use in trials (Jessen et al. Citation2014).
With regard to CSF biomarkers, Visser et al. (Citation2009) observed an AD-type CSF profile in 51% of the SCD patients and 32% of control subjects in a multicentre European memory clinic study. Antonell et al. (Citation2011) studied 24 controls and 19 SCD cases. They observed pathological measures of Asz42 in 26.3%, of Tau or pTau in 15.8%, and of both, Aβ42 and Tau or pTau in 10.5% of the SCD cases. In the controls, 29.2% showed pathological Aβ42 only, 4.2% pathological Tau or pTau only, and 4.2% pathological Aβ42 and Tau or pTau. In a recent analysis of the ADNI datatset, Risacher et al. (Citation2015) found lower Aβ1–42 and higher Tau/pTau concentrations in APOE ε4-positive in comparison with APOE ε4-negative subjects. APOE ε4-positive SCD individuals had significantly higher pTau concentrations than APOE ε4-positive controls.
Interestingly, in addition to studies in SCD, Wolfsgruber et al. (Citation2014, Citation2015) reported an association of CSF AD biomarkers with particular memory concerns in MCI, which was independent of the association with cognitive performance. The particular concern was also associated with cognitive decline in MCI.
In a longitudinal memory clinic cohort of 127 patients with SCD, Aβ42 and Tau were abnormal in 20 patients (both 16%), and pTau in 32 patients (25%) at baseline. Aβ42 was the strongest predictor of progression to MCI or AD with an adjusted HR of 16.0. The adjusted HR associated with Tau was 2.8 and with pTau 2.6 (van Harten, Visser, et al. Citation2013). In the same cohort, SCD patients with either pathological Aβ42 only or both Aβ42 and Tau or pTau showed decline over time in memory, executive functions and global cognition, while SCD patients without pathological CSF markers showed improvement or stable performance over time (van Harten, Smits, et al. Citation2013). Finally, in a Swedish longitudinal study of 122 SCD subjects with a 2-year follow-up, Hessen et al. (Citation2015) observed cognitive decline in those with pathological Tau concentration at baseline.
While the above studies reported prediction of decline by biomarkers in SCD subjects, a recent study from the AIBL cohort, based on amyloid PET predicted cognitive decline in healthy elderly, who were amyloid positive by SCD. The authors reported that an individual, who is amyloid positive, has an increased risk (HR = 5.1) of cognitive decline, if he or she reports SCD (Buckley et al. Citation2016). This study confirms the model that SCD may correspond to the late stage of pre-clinical AD, at the initial stage of decompensation of brain function (Jessen et al. Citation2014).
Clinical application of the CSF biomarkers in AD: Dementia Competence Network contribution
In recent years large-scale, multicentre studies have addressed AD biomarkers from different perspectives. The German Dementia Competence Network (DCN) was launched in 2002 by 14 academic centres of excellence in Germany and is funded by the German Federal Ministry for Education and Research (BMBF). The primary goals of the DCN are, among others, (a) to establish procedures for the standardised multicenter acquisition of clinical, biological and imaging data, for centralised data management; (b) a comprehensive clinical characterisation of MCI and incipient dementia; and (c) to test whether CSF- and blood-based biological markers, as well as clinical and neuropsychological assessments, can be combined to measure the progression of MCI and early AD over 3 years. The DCN has built a structured multicentre cohort. In 2,200 patients with MCI or mild dementia a multidimensional phenotyping with clinical, neuropsychological, neuroimaging, blood and CSF biomarkers was performed. Clinical follow-up examinations were performed up to 3 years (Kornhuber et al. Citation2009).
To reduce inter-laboratory variability, standards for the pre-analytical and analytical processing of biological samples (blood and CSF) have been developed as an important prerequisite for NDD (Lewczuk, Kornhuber, et al. Citation2006). Comprehensive biological sample characterisation allowed the world’s first successful GWAS on amyloid markers in CSF with innovative contributions to research on pathogenesis of AD (Ramirez et al. Citation2014). The work by Wiltfang et al. (Citation2007) showed that the common sole determination of Aβ1–42 was not sufficient to reflect the Aβ status, and demonstrated that a quotient consisting of Aβ1–42 and Aβ1–40 correlated significantly better with the degree of neurodegeneration indicated by Tau protein, than Aβ1–42 alone. The results of this work have now been confirmed by other groups (Dorey, Perret-Liaudet, et al. Citation2015; Janelidze, Zetterberg, et al. Citation2016; Racine et al. Citation2016).
The experience with established CSF dementia biomarkers Aβ1–42, Aβ1–40, Tau and pTau indicate an urgent need for additional markers, improving the diagnosis, differential diagnosis and the assessment of progression. Lewczuk et al. (Citation2010) measured sAPP in CSF to improve NDD. The DCN cohort was also used to demonstrate Aβ peptide abnormalities in the plasma of patients with neurochemical dementia markers typical of AD.
The interplay between amyloid and mitochondrial function has involved studies in an MRS study. In AD patients, the N-acetyl-aspartate concentration in the brain tissue, a putative marker of mitochondrial function, correlated with Aβ42 in CSF. This finding indicates an interaction of Aβ and neuronal mitochondrial dysfunction as key mechanism of AD pathology (Jessen et al. Citation2011).
The results of the CSF biomarkers of the DCN cohort were used to validate a cued recall memory deficit in prodromal AD (Wagner et al. Citation2012) and, as discussed above, to validate the Erlangen Score Algorithm (originally developed based on a different cohort (Lewczuk et al. Citation2009)) for the prediction of the development of dementia due to AD in pre-dementia subjects (Lewczuk, Kornhuber, et al. Citation2015). The Erlangen Score Algorithm (Lewczuk et al. Citation2009) inspired the diagnostic criteria of the NIA-AA for MCI (Albert et al. Citation2011). Furthermore, in the MCI patients of the DCN cohort, SCD is related to CSF biomarker abnormalities (Wolfsgruber et al. Citation2015).
The CSF biomarkers of the DCN cohort were also used in meta-analyses together with other dementia cohorts. One study defined the prevalence of cerebral amyloid pathology in persons without dementia (Jansen et al. Citation2015). Another study validated research criteria for the diagnosis of AD in patients with MCI (Vos et al. Citation2015).
The DCN has not only gathered a range of biomarkers, such as neuropsychology, structural MRI, MRS and DNA, but also joined with large genetic consortia such as GERAD to help to identify common variants associated with AD. For details regarding other biomarkers, the reader is referred to further publications by the DCN and genetic consortia, for example: (Harold et al. Citation2009; Teipel et al. Citation2010; Hollingworth et al. Citation2011; de Souza Silva et al. Citation2013; Morgen et al. Citation2013; Heilmann et al. Citation2015). Taken together, the contributions of the DCN greatly improved our understanding of the CSF biomarkers in AD.
BIOMARKAPD contribution
The BIOMARKAPD project was run during 2.5 years and was the first EU-Joint Programme Neurodegenerative Disease (JPND) project including 52 partners from 21 countries (51 European and one Canadian centre) with the goal to standardise the sampling and measurement for the already known biomarkers, as well as to develop new ones for AD and PD. This has been done by developing and validating protocols for these processes and to give training courses for the staff, and why now most of the centres in Europe are performing this procedure in a common, standardised way. BIOMARKAPD also developed protocols for analysis of the AD biomarkers CSF Aβ, Tau and pTau, as well as a new PD biomarker αSyn, both for clinical practice and clinical trials. We have also identified NG (a candidate biomarker reviewed in more details in the following sections of this paper) as a new CSF biomarker on the function in nerve synapses in AD, and DJ-1 in CSF as a new biomarker candidates for PD.
BIOMARKAPD has performed the largest subject-level meta-analysis on the prevalence of amyloid abnormality in non-demented subjects; a novel ELISA for NG, a dendritic marker, was validated clinically. The marker was found to be increased in AD CSF in a disease-specific manner; the validation of a novel fully automated method for CSF Aβ measurement was built upon the result from the BIOMARKAPD study. This will further increase the accuracy of Aβ measurements; a capillary isoelectric focussing immunoassay for Aβ fragments was developed and validated, which may be useful to monitor treatment effects of β-secretase inhibitors against AD.
Structural highlights
The BIOMARKAPD consortium had a unique multidisciplinary design which made it possible to cover the whole process from biomarker discovery to implementation. We were also able to show that a large number of participants can function together if the structure is thoroughly outlined, the work is well defined with clearly allocated sub-tasks and clear goals. A certified reference method for CSF Aβ and 5 L of CSF for the development of a reference material for Aβ has been collected. A new reference model for Tau and pTau will build upon this model. Central and virtual biobanks with samples collected according to the new standardised way have been set-up.
The BIOMARKAPD project resulted during the study period in 135 publications in international journals and a number of sub-studies have been published after the end of the project. The work within this project will continue in the Society for CSF Analysis and Clinical Neurochemistry (http://www.neurochem.info/html/home).
Longitudinal changes in the CSF biomarkers in the ADNI participants
On the other side of the Atlantic Ocean, the first phase of the ADNI started in 2004 aiming, among others, at the longitudinal within-participant assessment of progression of the disease in an elderly population (mean age of 75 years) (Weiner et al. Citation2015b). Subsequent Phases include ADNIGO/2 and starting in August 2016, the ADNI3 phase (Weiner et al. Citation2015a) includes new additional participants as well as carryover participants from earlier phases who remain in the study. Integral to the ADNI study is standardisation of imaging, biochemical and genetic biomarker measurements. In this discussion we focus on the longitudinal changes in CSF Aβ1–42, Tau and pTau181 concentrations measured in ADNI participants who are an elderly group, an important point to keep in mind when considering these and studies in other age groups. The ADNI1 study required LPs in at least 50% of participants at BASELINE study entry and at 1 year. An add-on study resulted in the collection of annual CSF samples out to 3–4 years in 142 ADNI1 participants (18 AD, 74 MCI, 50 cognitively normal). Longitudinal CSF samples have been collected out to 4 years in the ADNIGO/2 phases and analyses of these are planned for early 2017. In this review we describe results for the ADNI1 longitudinal dataset. The changes in CSF Aβ1–42, Tau and pTau181 in ADNI1 participants over time, from BASELINE visit out to 3–4 years have been described in several publications (Beckett et al. Citation2010; Vemuri et al. Citation2010; Lo et al. Citation2011; Landau et al. Citation2013; Toledo, Xie, et al. Citation2013; Mattsson, Insel, et al. Citation2015). During 1 year following BASELINE little change was observed for these three CSF biomarkers except for a modest increase in Tau in cognitively normal controls (Beckett et al. Citation2010, Vemuri et al. Citation2010). The relative stability of CSF Aβ1–42, Tau and pTau181 was shown in another study (in MCI and AD participants) over a 2-year time period (Zetterberg, Pedersen, et al. Citation2007). Sampling out to at least 3–4 years is needed to detect longitudinal changes in CSF (Stomrud et al. Citation2010; Lo et al. Citation2011; Landau et al. Citation2013; Toledo, Xie, et al. Citation2013; Mattsson, Insel, et al. Citation2015). There are several noteworthy findings in these analyses of the ADNI longitudinal CSF Aβ1–42, Tau and pTau181 concentrations including (a) reductions in Aβ1–42, were greater in cognitively normal than in MCI or early AD participants, a finding consistent with the model of Jack et al. (Citation2010) for the relationships between biomarker changes and cognitive changes over time, wherein the greatest rate of change for Aβ1–42 occurs at early pre-clinical stages of the AD continuum (Jack et al. Citation2010; Jack et al. Citation2013); (b) a decline from ‘normal’ (defined as above the 192 pg/ml cutpoint for Aβ1–42 in the ADNI study) to ‘pathological’ (below the 192 pg/ml cutpoint value) in some cognitively normal and MCI participants; (c) there were three observed types of ‘decline status’ for Aβ1–42 in individual participants, namely, (i) stable pathological: non-decliner participants whose Aβ1–42 trajectories were stable but all pathological (below the cutpoint concentration value); (ii) stable normal: non-decliner participants whose Aβ1–42 trajectories were stable but all concentration values were above the cutpoint concentration value; or (iii) decliners: participants whose Aβ1–42 trajectories were declining from above cutpoint, normal, to below cutpoint, pathological, during the 3-4 year observation period (Landau et al. Citation2013; Toledo, Xie, et al. Citation2013; Mattsson, Insel, et al. Citation2015).
There are interesting implications of these data. The results described above for the ADNI1 study provide evidence for variable rates of decline in CSF Aβ1–42 that are consistent with the documented presence of disease heterogeneity in this late-onset AD study population (Toledo, Cairns, et al. Citation2013; Cairns et al. Citation2015). Analyses of the data for those subjects whose last sample was collected at 36–48 months (n = 89) have revealed (Toledo, Xie, et al. Citation2013) that, in participants in the ADNI1 longitudinal study, CSF Aβ1–42 was pathological in virtually all APOE ε4 carriers, and that all but one of the Ab normal non-decliners was APOE ε4 negative. These results are consistent with the observation that APOE ε4 positivity predisposes individuals to earlier decline in CSF Aβ1–42 concentrations (Peskind et al. Citation2006). A recent pilot study in cognitively normal middle-aged participants in the Adult Children Study described within-subject decreases of CSF Aβ1–42 at greater frequency in APOE ε4 allele carriers, compared to non-carriers in early middle age subjects in this study (Sutphen et al. Citation2015). An analysis of the cognitively normal ADNI1 participants whose CSF Aβ1–42 BASELINE values were normal showed that over 3–4 years this subset split into two groups, those whose Aβ1–42 values remained stable and above the 192 pg/ml cutpoint and those whose values declined below the cutpoint concentration (Mattsson, Insel, et al. Citation2015). The strongest predictor of Aβ1–42 decline were BASELINE Aβ1–42 levels in the lowest third of the above-cutpoint range of values associated with the cognitively normal participants (Mattsson, Insel, et al. Citation2015). This observation raises the important question around the clinical utility of Aβ1–42 as a potential continuous biomarker test parameter as contrasted with a dichotomous variable. Future studies in larger numbers of study participants and using the next generation of immunoassays will be required to assess this question. These data are another important example of the heterogeneity of biomarker findings in ADNI participants that likely reflect the observed disease heterogeneity (Kang et al. Citation2015).
The observed heterogeneity was likely not due to run-to-run variability or reagent batch effects, since in all of the studies cited in this section the longitudinal CSF samples for each study participant were analysed in the same analytical run. Regarding pTau and Tau, findings of interest were: MCI and AD diagnoses were associated with lower and higher concentrations, respectively, of Aβ1–42 and Tau, but not pTau181 (Toledo, Xie, et al. Citation2013). According to analyses of the chronology of biomarker changes in ADNI1 participants using linear regression models adjusted for age, gender and APOE ε4 genotype, pathological values of BASELINE Aβ1–42 predicted later increases in pTau181, but neither Tau or pTau181 BASELINE values predicted changes in Aβ1–42 over time (Toledo, Xie, et al. Citation2013). The observed time dynamics are consistent with observations in autosomal-dominant participants in the Dominantly Inherited Alzheimer Network (DIAN) study in which the proposed timeline for CSF Aβ1–42, Tau and pTau181, based largely on cross-sectional data and using the expected year of symptom onset for each participant (Bateman et al. Citation2012; Fagan et al. Citation2014). Planned further analyses in expanded numbers of the ADNI and other study cohorts over longer periods of time will be essential to confirm these results and provide greater insight and understanding of disease heterogeneity in late-onset AD, and inform clinical trial planners and ultimately routine clinical practice on expected CSF biomarker trajectories and their relationships to cognitive decline.
Potential novel biomarkers
Several investigations have been recently undertaken in order to examine novel candidate biomarkers which may better reflect the pathophysiological mechanisms underlying the progression of the disease (Lewczuk, Kamrowski-Kruck, et al. Citation2010; Hampel et al. Citation2012; Cavedo et al. Citation2014; Hampel et al. Citation2014; Henriksen et al. Citation2014; Mapstone et al. Citation2014; Mroczko et al. Citation2014; Fiandaca et al. Citation2015; Lista et al. Citation2015; Mroczko et al. Citation2015; Lista and Hampel Citation2016; Lista et al. Citation2016).
Among others, these biomarkers include CSF NG, a candidate marker for synaptic dysfunction and/or loss, CSF NF-L, a marker of axonal degeneration (this marker just recently re-emerged as relevant to AD; the marker has a long-standing history in, e.g. multiple sclerosis and amyotrophic lateral sclerosis), and CSF triggering receptor expressed on myeloid cells 2 (TREM2), a candidate marker of microglial activation (see http://www.alzforum.org/alzbiomarker for updated meta-analyses (Olsson et al. Citation2016)).
Neurogranin: a marker of synapse loss in AD?
The very first toxic effects of Aβ, preceding Tau pathology, may be synaptic impairment and dendritic loss (Herms and Dorostkar Citation2016). To examine this more closely, we need reliable biomarkers for dendritic loss, and in this context, NG, a neuron-specific dendritic protein that is mainly expressed in the cortex and hippocampus by excitatory neurons (Represa et al. Citation1990; Guadano-Ferraz et al. Citation2005) may be a promising candidate. NG plays a key role in synaptic plasticity, enhancing synaptic strength by regulating the availability of calmodulin (CaM) upon Ca2+-mediated protein kinase C activation (Zetterberg and Blennow Citation2015). Further, phosphorylation of NG has been shown to be essential for the induction of long-term potentiation in pyramidal cells of the CA1 region of the hippocampus, where it is highly enriched in dendritic spines (Fedorov et al. Citation1995; Chen et al. Citation1997). NG levels are significantly lower in the cortex and hippocampus of AD patients as compared to controls (Davidsson and Blennow Citation1998; Reddy et al. Citation2005).
In 2010, a semi-quantitative immunoprecipitation western blot method showed increased CSF NG concentrations in the CSF of patients with AD compared with cognitively normal controls (Thorsell et al. Citation2010). Different sandwich immunoassays for the protein have since been developed and the results suggest that CSF NG indeed is a valid biomarker for dendritic loss in AD. Cross-sectional studies show increased CSF concentration of NG in both AD and in the MCI stage of the disease (De Vos et al. Citation2015; Kester et al. Citation2015; Kvartsberg, Duits, et al. Citation2015; Kvartsberg, Portelius, et al. Citation2015). Additionally, Kester et al. (Citation2015) showed longitudinally stable levels in AD but increased levels over time in cognitively normal individuals, which suggests that CSF NG may reflect pre-symptomatic synaptic dysfunction or loss. Further, CSF NG concentration correlates with cognitive deterioration and disease-associated changes in metabolic and structural biomarkers over time, as recently shown in the ADNI study (Portelius et al. Citation2015). Surprisingly, CSF NG increase appears to be specific to AD; other neurodegenerative diseases show control-like concentrations (Wellington et al. Citation2016). The research field is now awaiting the first results on whether CSF NG concentration normalises in response to treatment with novel disease-modifying drug candidates against AD.
Neurofilament light: a Tau-independent marker of neuroaxonal degeneration?
There are two major types of intermediate filaments in the nervous system: neurofilaments and glial filaments. Neurofilaments exist as 10-nm filaments in the axoplasm of neurons, where they give tensile strength to dendrites and axons. They are composed of three major polypeptides with molecular masses of 200, 150 and 68 kDa, respectively. As the name implies, neurofilament light is the lightest of the three components (Zetterberg Citation2016).
The first ELISA for NF-L was developed in the mid-1990s (Rosengren et al. Citation1996). Rosengren and colleagues showed that CSF NF-L concentration was increased in amyotrophic lateral sclerosis, particularly so in patients with pyramidal tract involvement, and that increased concentrations also characterised AD, VaD and normal pressure hydrocephalus, but with lower magnitude of the rise compared with that seen in ALS (Rosengren et al. Citation1996). The authors concluded that CSF NF-L was a promising biomarker for neurodegeneration in general; a conclusion that has later been confirmed, e.g. in studies examining atypical PD (Hall et al. Citation2012; Magdalinou et al. Citation2015) and FTD (Scherling et al. Citation2014). Given the high expression of NF-L in large calibre myelinated axons, studies on multiple sclerosis soon followed. Researchers found that CSF NF-L is increased in both relapsing-remitting and primary progressive multiple sclerosis, that CSF NF-L concentration indicates ongoing axonal injury and reflects the intensity of the process, that CSF NF-L concentration normalises within 6–12 months in multiple sclerosis patients following initiation of clinically effective treatment, and that CSF NF-L thus is a promising biomarker for disease intensity and progression, as well as for treatment response (Teunissen and Khalil Citation2012). Similar results on CSF NF-L dynamics have been obtained in stroke, TBI, HIV-associated dementia and a broad range of other neuroinfectious conditions. For a long time researchers found increased CSF NF-L concentrations in AD, but this was often attributed to co-morbidity of vascular disease (Bjerke et al. Citation2010). It has now, however, become evident that CSF NF-L increase is an inherent feature of AD, and that increased CSF NF-L concentrations, along with biomarker evidence of classical AD pathology, predict a more rapid disease progression (Zetterberg et al. Citation2016). The marker appears to be a non-specific marker of disease intensity in neurodegenerative diseases, and could potentially be used to detect treatment effects, in a similar way as to which it has been successfully been employed in the field of multiple sclerosis (Gunnarsson et al. Citation2011).
CSF sTREM2: a novel biomarker of microglial activation?
In the CNS, the triggering receptor expressed on myeloid cells 2 (TREM2) is specifically expressed on microglia as a transmembrane protein that is processed by α- and γ-secretases (Colonna and Wang Citation2016). TREM2 mutations cause neurodegenerative diseases and were recently linked to AD (Guerreiro et al. Citation2013; Jonsson et al. Citation2013). The ectodomain is shed into the CSF in response to microglial activation (sTREM2) and was first measured in CSF from MS patients, who had increased concentrations as compared to controls. Increased CSF sTREM2 concentrations were recently reported in both dementia and MCI stages of AD and CSF sTREM2 correlate with CSF Tau but not CSF Aβ42 concentrations, suggesting that microglial activation occurs in close connection with onset of neurodegeneration (Heslegrave et al. Citation2016; Piccio et al. Citation2016; Suarez-Calvet et al. Citation2016). The association of CSF sTREM2 with protective versus harmful microglial activation is presently unknown; longitudinal studies with repeated CSF samplings over time are needed to determine this.
Novel technologies in biomarkers research
A common limiting factor of biomarker research is the access to well-characterised samples with regard to diagnosis and pre-analytical factors. For this reason it is desirable to use methods with low demand on sample volumes in order to be able to investigate as many different biomarker candidates as possible in a given set of samples. Another constraint is the sensitivity of the assays that are used in the search. Even though an ordinary ELISA is quite sensitive a biomolecule cannot be investigated and evaluated for its potential as a biomarker if its concentration is consistently below the limit of quantification for the assay. In this article a technology is considered novel if it, in addition to not being older than approximately 10 years, has supreme sensitivity or much less demand on sample volume compared with an ordinary ELISA. On the other hand, biotechnology companies are extremely active in the marketing of their technologies, and the figures regarding supreme sensitivity of all novel methods should be taken with a pinch of salt. The determination of the sensitivity of an immunoassay depends strongly on several factors, e.g. identity of the antibodies, the source of the calibrator and way of calculating the limit of detection/quantification. As long as these factors are not fixed any method comparison to judge the sensitivity would be like comparing apples and oranges.
Single-molecule counting
The single-molecule counting (SMC) technology developed by Singulex (Wu et al. Citation2006; Todd et al. Citation2007) marked the start of ultra-sensitive immunoassays claiming a 100 times higher sensitivity compared to contemporary immunoassay platforms. In this bead-based technology the sandwich complex (capture antibody-analyte-detection antibody), which is at the heart of many immunoassays, is broken up and only the fluorescently labelled detection antibody is quantified as single events as they are drawn into a capillary and pass a laser beam that excites the fluorophore, and give a signal above the threshold of the background noise. The sum of the number of such discrete events in a sample is the signal that is used for calculating the concentration of the analyte. At higher concentrations the probability increases for the occurrence of more than one antibody passing the beam at the same time and then a switch is automatically made to measure the total amount of light emitted, which allows for a high dynamic range of the platform. An Erenna instrument is needed to run SMC assays, and the platform is open, which allows for in-house assays to be developed. For the time being multiplex is not an option for the SMC technology.
Single-molecule array
Quanterix has invented and commercialised the single-molecule array (Simoa) technology (Rissin et al. Citation2010), which is a bead-based digital ELISA claimed to be 1,000-fold more sensitive than an ordinary ELISA. The reason for the label ‘digital’ is that after the sandwich complex is formed, using an enzyme-conjugated detection antibody, the beads are trapped in 50-fl wells together with the fluorogenic substrate, and the small reaction volume allows for a detectable signal even if only one sandwich complex is present on a bead. At higher concentrations the probability of more than one sandwich complex per bead increases and the detection make a transit from digital to analogue signal treatment to expand the dynamic range. A dedicated analyser, Simoa HD-1, is needed and it is possible to make in-house assays. The option of multiplexing is now also available on the platform (Rissin et al. Citation2013; Rivnak et al. Citation2015).
Proximity extension assay
The proximity extension assay (PEA) utilises real-time polymerase chain reaction (PCR) as a signal generator (Fredriksson et al. Citation2002; Lundberg et al. Citation2011). In PEA partly complementary DNA strands are conjugated to two different antibodies allowing for the DNA strands to hybridise when both antibodies come in proximity to each other upon binding to the analyte. The design of the complementary DNA parts prevents hybridisation in the absence of binding of both antibodies to the analyte. In the presence of DNA polymerase and deoxynucleotides a double-stranded PCR template is formed, which can be multiplied and quantified using real-time PCR. PEA has been commercialised by the company Olink, and their Proseek multiplex assays can be used in any laboratory, given that the necessary instruments are available, but the company also offers a fee-for-service. PEA is not a multiplex in the sense that all analytes are analysed in one go, rather there are separate reactions, but even so only a 1-ml sample is needed for a 92-plex assay. The manufacturers claim that the sensitivity is, comparable or better than ELISA, down to fg/ml.
Slow off-rate modified aptamer scan
Nucleotides can be used for detection, as in PEA, but also for binding specific target molecules and this property is utilised in the slow off-rate modified aptamer scan (SOMAscan) commercialised by SOMAlogical (Rohloff et al. Citation2014). In SOMAscan, nucleotid-based aptamers are conjugated to biotin and bound to streptavidin-coated beads via a linker containing both a fluorophore and a photocleavable spacer. After sample incubation followed by a wash, the bound proteins are biotinylated, and the biotin-protein-aptamer-fluorophore complex is dissociated from the beads using light photocleavage. After removal of the beads, new streptavidin-coated beads are added, to which the complex can bind and at the same time allow for non-specific interactions to dissociate. Next, the proteins are eluted from the aptamer-fluorophore complex. After a wash the aptamer-fluorophore complex is released from the beads under denaturing conditions and the aptamers are hybridised to complementary strands on a microarray chip and quantified by fluorescence. By design, the intensity of the fluorescent signal reflects the concentration of the analyte in the sample, the sensitivity is typically as low as ELISA systems, and the dynamic range is claimed to be 8 orders of magnitude. It is also possible to use qPCR or Luminex systems for quantification. SOMAlogical offers more than 1,300 analytes on a fee-for-service basis but it also possible to set up the system in any laboratory, and there are also external laboratories trained (e.g. Neurochemistry Lab VUmc) to perform the analysis for research purposes.
Immunomagnetic reduction
When antibody-coated magnetic nanoparticles interact with antigen the magnetically induced oscillation decreases in a concentration-dependent way. This effect is called immunomagnetic reduction (IMR) and is the principle used in the detection system utilised on the platform developed by the company MagQu (Chieh et al. Citation2008). The technology has been shown to be an order of magnitude more sensitive than a conventional ELISA (Horng et al. Citation2006). MagQu offers an assay service, where samples are sent to and analysed by the company. Instruments for measuring IMR and reagents for making in-house assays are available for purchase from MagQu.
S-plex
Meso Scale Discovery has recently launched a sample-testing service called S-plex. Even though the assays can be analysed using their already established electrochemiluminescence plate readers the detection is improved and the company claims that the S-plex has a 100–1000 times greater sensitivity than ELISAs. The plan is to make the technology available outside the company. However, according to a company representative, the novel extra sensitive detection process is a company secret not to be revealed even after the release of the S-plex to external laboratories.
Flexmap 3D
Luminex has been a player on the multiplex arena for more than 20 years and their xMAP technology is based on the principles of flow cytometry. The antibody-coated beads are filled with different ratios of two fluorophores that identifies which analyte that is bound and the detection antibody is labelled with another fluorophore which is used for generation a signal. Initially there was a limitation of 100 different dye combinations, but when the FLEXMAP 3D platform was launched in 2007 this number increased to 500. It is the introduction of a third dye in the beads that has allowed for the increase in possible discrete dye combinations. The platform is open allowing for in-house multiplex assays to be developed in addition to other companies to manufacture and vend kits for the platform.
Magpix
Luminex has also a platform, MAGPIX, which utilises magnetic beads filled with two different dyes and with a limit of 50-plex assays. It might seem as a step back decreasing the number of possible analytes but for many applications it is a quite sufficient number. Instead of measuring the beads one by one, as in FLEXMAP 3D, the beads are drawn to a plate using magnetism and then exited with light. Pictures are taken and image analysis allow for identification and quantification. The same openness applies to MAGPIX as to FLEXMAP 3D when it comes to in-house method development.
Mass spectrometry
One thing that the above-mentioned technologies all have in common is the use of antibodies in a way that the analytes are measured indirectly. There are potential pitfalls connected to this, e.g. heterophilic antibodies and non-specific binding, which can give false results. Many of the problems with immunochemical methods can be avoided using quantitative MS (Scherl Citation2015). As a principle MS is almost 100 years old, but after the invention of the soft ionisation methods, allowing for organic compounds to be analysed, the evolution has been, and still is, fast. Today MS competes well with the sensitivity of immunoassays but for the time being immune assays in general have higher throughput of samples.
Biomarkers in frontotemporal lobar degeneration
FTLD comprises a group of neurodegenerative disorders with overlapping symptomatology and histopathology (see also the section on neuropathology above in this paper). The common feature is the degeneration of the frontal and anterior temporal lobe, and at present the following syndromes are assigned to the FTLD spectrum (Seltman and Matthews Citation2012): the three types of FTD including the behavioural variant of FTD (bvFTD) and the semantic and non-fluent variants of primary progressive aphasia (svPPA and nfvPPA), FTD with motor neuron disease (FTD-MND), PSP and corticobasal syndrome (CBS). These syndromes can further be classified as behavioural variant (bvFTD), language variant (svPPA and nfvPPA) and motor variant (FTD-MND, PSP and CBS) of FTLD.
As outlined earlier in this paper, FTLD is neuropathologically characterised by proteinaceous aggregates in the brain, but there are differences in the protein composition. Intracellular, Tau-positive aggregates (FTLD-Tau) are found in 36%–50% of FTLD cases; most nfvPPA show FTLD-Tau pathology in contrast to only few svPPA patients. PSP and CBS also show predominantly FTLD-Tau pathology with some exceptions for CBS. The presence of aggregates positive for the TAR DNA-binding protein of 43 kDa (TDP-43) accounts for about 50% of FTLD patients; this type of pathology is found in FTD-MND, in most svPPA patients and only seldom in nfvPPA or CBS. The third characteristically aggregated protein is FUS (FTLD-FUS) and bvFTD patients appear with all three types of neuropathology (Rabinovici and Miller Citation2010; Bang et al. Citation2015).
To date, diagnosis of FTLD syndromes is based on clinical symptoms only (Litvan et al. Citation1996; Gorno-Tempini et al. Citation2011; Rascovsky et al. Citation2011; Armstrong et al. Citation2013) and is hampered by the great overlap of the clinical manifestation within the FTLD subtypes and with other types of dementia (e.g. AD) or movement disorders (e.g. PD).
Candidate biomarkers that might help in the early and differential diagnosis of FTLD were recently summarised (Feneberg et al. Citation2012; Oeckl et al. Citation2015; Oeckl, Metzger, et al. Citation2016; Oeckl, Steinacker, et al. Citation2016). AD represents the most important disorder in the differential diagnosis of FTD. Especially if patients present with predominant language deficits one has to distinguish the logopenic variant of PPA, which is mostly associated with underlying AD pathology (Gorno-Tempini et al. Citation2011). Tau, pTau181 and Aβ42 are the most promising biomarker candidates to help in differentiation between FTD and AD. Several studies investigated these biomarkers in FTD and AD as summarised in different meta-analysis: CSF Aβ42 is reduced (Tang et al. Citation2014) and Tau (van Harten et al. Citation2011) and pTau181 (van Harten et al. Citation2011) are increased in AD compared to FTD. In fact, in the new criteria for bvFTD a typical biomarker profile of AD would lead to an exclusion of bvFTD. However, this point is certainly a matter of discussion.
In recent years, studies focussed on the validation of these results in larger patient cohorts and the combination of the three biomarkers to increase sensitivity and specificity. Skillback et al. (Citation2014) could show increased Tau and pTau181 and reduced Aβ42 concentrations in AD in a cohort of more than 5000 patients. Several other studies confirmed these observations (Alcolea et al. Citation2014; Baldeiras et al. Citation2015; Ewers et al. Citation2015; Magdalinou et al. Citation2015; Struyfs, Van Broeck, et al. Citation2015; Timmer et al. Citation2015). The combination of Aβ42 and pTau181 (as Aβ42/pTau181 ratio) differentiated better AD and FTD patients (Skillback, Farahmand, et al. Citation2014). This was supported by two other studies reporting increased sensitivity (80%–86%) and specificity (82%) of the ratio Aβ42/pTau181 compared with the three biomarkers alone (Baldeiras et al. Citation2015; Struyfs, Van Broeck, et al. Citation2015).
Although up to half of FTD cases show Tau pathology (Bang et al. Citation2015), unexpectedly CSF Tau is normal or only slightly altered in FTD patients in contrast to its marked increase in AD. This leads to a more general discussion of whether CSF Tau is a marker of Tau pathology or more a marker of synaptic impairment (Halbgebauer et al. Citation2016). Further, some studies suggest a Tau/pTau ratio as as good discriminatory biomarkers between Tau and tdp-43 pathology (Pijnenburg et al. Citation2015).
Tau isoforms such as pTau181 are expected to be more specific, but data for FTD is sparse. Different forms of Tau phosphorylation (pTau231 and pTau199) have been investigated in FTD but they are increased in AD too (Hampel et al. Citation2004), and more efforts is needed to identify FTD-specific Tau isoforms.
Other products of the APP/Aβ metabolism have been suggested as promising biomarker candidates in the past, e.g. Aβ1–37 and Aβ1–38 (Oeckl et al. Citation2015), and a recent study by Struyfs et al. (Citation2015) confirmed an increased accuracy of the FTD versus AD diagnosis when using Aβ1–37 and Aβ1–38. sAPP has been shown to be elevated in AD and MCI compared with FTD in some studies (Gabelle et al. Citation2011; Perneczky et al. Citation2011; Alexopoulos et al. Citation2012; Alcolea et al. Citation2014), whereas previous data for sAPP were inconsistent (Gabelle et al. Citation2011; Perneczky et al. Citation2011). Magdalinou et al. (Citation2015) did not observe differences in sAPPα and sAPPβ between AD and FTD in their recent study. However, the evidence for these candidate biomarkers is still too low and needs further validation in larger patient cohorts. In addition, the confirmation of differences between FTD and AD with techniques other than immunoassays, as has been described (Pannee et al. Citation2013), would be desirable.
NF-L and phosphorylated neurofilament heavy chain (pNF-H) are important proteins of the axonal cytoskeleton, and their increased concentrations in the CSF are considered as a marker of axonal damage (Petzold Citation2005). In FTD, CSF NF-L concentration has been shown increased compared to AD (de Jong et al. Citation2007; Landqvist Waldo et al. Citation2013). In a large cohort of patients, Skillback et al. (Citation2014) confirmed increased NF-L concentrations in FTD, but overlap between the groups was still large, indicating that NF-L alone might not be optimal to differentiate AD and FTD. On the other hand, if used in combination with the classic AD biomarkers, NF-L can introduce information about an additional type of pathology and increase diagnostic sensitivity and specificity as shown by de Jong et al. (Citation2007). Although no study focussed on NF-L differences between the FTD subtypes bvFTD, svPPA and nfvPPA in recent years, previous studies (Landqvist Waldo et al. Citation2013; Scherling et al. Citation2014) observed no differences, which further supports its usefulness in the discrimination of AD and FTD in general. Most recently elevated levels of NF-L were also described in blood (Meeter et al. Citation2016; Rohrer et al. Citation2016). Further studies will show if NF-L can indeed be used as diagnostic or prognostic marker in FTD.
New biomarker candidates were discussed for the differential diagnosis of AD and FTD, such as endostatin (Salza et al. Citation2015), NG (Janelidze, Hertze, et al. Citation2016), ubiquitin (Oeckl et al. Citation2014), β-synuclein (Oeckl, Metzger, et al. Citation2016) and YKL-40 (Olsson et al. Citation2013; Magdalinou et al. Citation2015).
Data on CSF biomarkers in C9orf72 and MAPT mutation carriers are still sparse. Elevated phosphorylated TDP43 concentrations in CSF and plasma was found in a small cohort of FTD patients with C9orf72 mutation compared with sporadic FTD and controls (Suarez-Calvet et al. Citation2014, Teunissen et al. Citation2016), although diagnostic use of TDP43 was questionable (Steinacker et al. Citation2008; Feneberg et al. Citation2014). Interestingly, in the C9orf72 mutation, carriers’ increased CSF concentrations of poly(GP) expression, as a result of the hexanucleotide repeat extension, were seen (Su et al. Citation2014). In patients with mutation of the progranulin gene, decreased levels of progranulin in blood and CSF were observed as loss of ‘protein’ (Ghidoni et al. Citation2008; Van Damme et al. Citation2008).
Summarising, to date the AD core biomarkers Tau, pTau181 and Aβ42, as well as NF-L, are the most promising biomarker candidates for the differential diagnosis of FTLD, which is supported by several studies. Tau, pTau181 and Aβ42 already show a satisfactory diagnostic power to differentiate AD and FTD when used in combination (ratio of Aβ42/pTau181 and Aβ42/Tau), which can be further improved by including NF-L concentrations.
CSF and blood biomarkers in amyothrophic lateral sclerosis
ALS, the most common phenotype of motor neuron disease, is characterised by progressive weakness due to degeneration of upper and lower motor neurons culminating in death, typically from respiratory failure, with a median survival of 30 months from symptom onset (Kiernan et al. Citation2011). Although the incidence of ALS is not dissimilar to multiple sclerosis, its prevalence is greatly reduced as a result of its typically much more rapid progression. ALS overlaps histopathologically, and in some cases clinically, with a subset of FTLD, through cytoplasmic inclusions of the 43 kDa TAR DNA binding protein, TDP-43, present in 97% of all cases (Mackenzie et al. Citation2007). ALS is clinically heterogeneous, with significant variability in rate of disease progression, and a range of monogenetic associations so that it is increasingly viewed as a syndrome (Turner and Swash Citation2015).
The development of markers to distinguish ALS from other causes of progressive motor weakness, to improve the stratification of patients, and to assess therapeutic efficacy is a major focus of research (Turner et al. Citation2009). A range of cellular pathways, including glutamatergic excitotoxicity, oxidative stress, mitochondrial dysfunction and neuroinflammation have been associated with ALS pathogenesis (Turner et al. Citation2013). In common with other neurodegenerative diseases, biofluids are viewed as an attractive potential source of objective markers of disease activity. A broad range of CSF and blood constituents have been examined over the course of four decades, ranging from amino acids and neurotransmitters, to proteins more specifically implicated in the pathogenesis of ALS.
Neurofilaments
Although non-specific to ALS, elevated CSF and blood levels of NF-L and phosphorylated neurofilament heavy chain are currently the leading biomarker candidate in ALS (Turner and Gray Citation2016).
The accuracy of CSF NF levels to distinguish patients with ALS from healthy controls is well established (Boylan et al. Citation2013; Zetterberg, Jacobsson, et al. Citation2007), with one recent study reporting an electrochemiluminescent assay for NF-L as having a sensitivity of 97% and a specificity of 95% in this setting (Lu, Macdonald-Wallis, et al. Citation2015). The extrapolation of this for use as an adjunct to diagnosis in clinic is limited by the use, thus far, of controls who are healthy or suffer from disorders not encountered in the differential diagnosis of ALS. Serum and plasma NF-L correlate well with CSF levels, though performance in distinguishing ALS from healthy controls is somewhat diminished, with a sensitivity of 89% and a specificity of 75% for serum (Lu, Macdonald-Wallis, et al. Citation2015). No significant difference between plasma levels of pNF-H were seen in patients with ALS compared to controls (Lu, Petzold, et al. Citation2015).
The utility of CSF neurofilaments in the diagnosis of ALS, measuring CSF NF-L and pNF-H, as well as Tau and pTau, was explored in 455 patients, including 253 patients with ALS (including the upper motor neuron-restricted variant primary lateral sclerosis, PLS) and 85 patients with conditions said to mimic ALS (Steinacker et al. Citation2016). Both NF-L and pNF-H performed comparably at distinguishing MND patients from mimics with a sensitivity of 77% and 81% and specificity of 88% and 80%, respectively, at the optimal cut-off values. The strength of this study lies in the large number of subjects and comparison with disease rather than healthy controls, although the mimic group was not typical for those most challenging to differentiate from ALS in the clinic setting.
CSF levels of both pNF-H and NF-L appear to correlate positively with disease progression rate and negatively with survival from symptom onset (Brettschneider et al. Citation2006; Ganesalingam et al. Citation2011; Lu, Macdonald-Wallis, et al. Citation2015; Lu, Petzold, et al. Citation2015). No significant change in the level of either NF chain in CSF or blood has been observed over time, with the caveat that longitudinal sampling is inevitably limited in patients with rapidly progressive disease (in whom fluctuation in NF levels might be most likely to occur). These two properties make NFs attractive markers for use in clinical trials, to enable stratification of subjects at recruitment and to detect a suppression of disease activity (or lack thereof) prior to the emergence of clinically detectable outcomes. This has not yet been explored in the context of a therapeutic trial.
Finally, in a cross-sectional study of asymptomatic carriers of genetic mutations associated with a high-risk of developing ALS, NF levels were not significantly different from those of healthy controls (Weydt et al. Citation2016). This supports the view, from combined MRI and CSF studies in symptomatic ALS patients, that significantly raised CSF NF-L levels using current assay technology, reflect large white matter tract degeneration (Menke et al. Citation2015).
Aggregated proteins
Intraneuronal aggregates of hyperphosphorylated TDP-43 are the pathological hallmark of nearly all cases of ALS. Several studies have detected elevated CSF TDP-43 levels in patients with ALS compared to both healthy controls and neurological disease controls, a finding which runs contrary to that of PD and AD, in which CSF αSyn and Aβ1–42 levels, respectively, are decreased (Motter et al. Citation1995; Mollenhauer et al. Citation2008; Kasai et al. Citation2009; Noto et al. Citation2011). Counterintuitively, patients with lower CSF TDP-43 also had shorter survival from symptom onset. Attempts to replicate the association of CSF TDP-43 levels with disease activity in ALS have led to the suggestion that the low levels of CSF TDP-43 detectable with current commercial assays may be blood derived (Feneberg et al. Citation2014). More research is needed to understand the variable nature and location of the pathological forms of TDP-43 found in ALS.
The major component of aggregates in 20% of familial ALS (2% of all cases) is Cu/Zn superoxide dismutase (SOD-1), linked to mutations in SOD1. No difference in CSF levels of SOD-1 between ALS patients (including those with SOD1 mutations) and healthy controls has been demonstrated, including measurement of misfolded forms (Jacobsson et al. Citation2001; Zetterstrom et al. Citation2011). Interestingly, NF levels were also not significantly raised in this group, despite a clinical ALS phenotype (Zetterberg, Jacobsson, et al. Citation2007). Measurement of SOD-1 does not, therefore, appear to be a promising route for the development of diagnostic assays, although may still prove useful in the development of a pharmacodynamic measure for emerging antisense oligonucleotide therapies for SOD1 mutation carriers (Winer et al. Citation2013).
Cystatin C, a component of ALS-specific intraneuronal inclusions found in lower motor neurons (Bunina bodies) has been shown to be decreased in CSF of patients in both proteomic and candidate-driven studies (Ranganathan et al. Citation2005; Tsuji-Akimoto et al. Citation2009; Ryberg et al. Citation2010; Wilson et al. Citation2010; Collins et al. Citation2015). Although a correlation was noted between cystatin C levels and rate of disease progression, cystatin C has proved to have limited accuracy at distinguishing ALS patients from neurological controls, with sensitivity ranging from 23% to 53% and specificity from 52% to 88% (Wilson et al. Citation2010).
Cytokines, growth factors and oxidative stress
There is evidence of activation of the immune system in ALS, but primary versus secondary roles in pathogenesis still require clarification (Evans et al. Citation2013). Perturbations in immune signalling molecules remain a focus of study as potential indicators of disease activity or severity. CSF levels of transforming growth factor β1 (TGF-β1) have been examined in ALS, with one showing elevated levels in CSF and serum only in patients judged to have terminal clinical status when compared to healthy controls, and another demonstrating elevated levels in plasma as well as a weak positive correlation with disease duration (r = 0.66) (Houi et al. Citation2002; Ilzecka et al. Citation2002). Levels of the pro-inflammatory cytokine IFN-γ in serum and CSF measured by ELISA were elevated in ALS patients compared with healthy controls as well as a positive correlation with disease progression rate as measured by rate of change in the revised ALS Functional Rating Score (serum r = 0.44, CSF r = 0.56) (Liu et al. Citation2015).
Several studies have employed multiplex panels of cytokines and growth factors in CSF and serum (Tanaka et al. Citation2006; Mitchell et al. Citation2009; Mitchell et al. Citation2010; Tateishi et al. Citation2010; Furukawa et al. Citation2015). Of 16 cytokines common to all four CSF studies, only granulocyte colony stimulating factor (G-CSF) was consistently elevated, while interleukin 17 (IL-17, a pro-inflammatory cytokine) was elevated in three out of four studies. G-CSF has not been separately validated in a large cohort and neither its diagnostic accuracy nor long-term variability has been established.
Elevation of IL-17 has been reproduced in one study comparing CSF of 22 ALS patients with 19 patients suffering other neurological conditions (as well as elevation of IL-23, responsible for induction of IL-17) (Rentzos et al. Citation2010). Again, this has not been subjected to interrogation of diagnostic accuracy or long-term stability in a large cohort.
Uric acid, an anti-oxidant found abundantly in serum, is found at lower levels in the serum of ALS patients compared to healthy controls and those with a limited number of neurological diseases. Lower levels also correlated with faster disease progression (Keizman et al. Citation2009; Zoccolella et al. Citation2011; Oh et al. Citation2015). However, elevate urate has been reported in other neurodegenerative disorders (Pakpoor et al. Citation2015), and an emerging protective association of premorbid gout suggests a more complex generic interaction of this pathway in the pathogenesis of neurodegenerative disorders (Fang et al. Citation2013).
Biomarkers in Parkinson Disease and DLB
DLB is a neurodegenerative dementia with additional symptoms including visual hallucinations, fluctuations in alertness, slowness of movement, trouble walking and rigidity. Neuropathologically, DLB and PDD share many features, suggesting a pathological continuum of the two disorders.
Unfortunately, so far the field of PD lacks specific biomarkers to identify the risk of developing the disease (marker of trait), to signal the manifestation of the disease (disease state), to signal the speed of its progression and response to therapy (marker of rate) or to predict its course (marker of fate).
αSyn has been identified as a main component of Lewy bodies, which are a neuropathological characteristic of PD and DLB, as well as of glial inclusions in multiple system atrophy (MSA) (Spillantini et al. Citation1997).
PD is an increasingly prevalent neurodegenerative disorder. αSyn aggregates lead to neuronal loss. All nerve cells with less myelin (and higher energy turnover) are more prone to Lewy body and Lewy neurite formation and consecutive damage, while myelin and short axons are resistant (Braak et al. Citation2003). The spread of this αSyn pathology follows a stereotypic pattern of involvement of the central nervous system (Braak et al. Citation2003).
The clinical diagnosis of PD is made exclusively by motor symptoms and their improvement by dopaminergic substitution when more than 50% of dopaminergic neurons are already degenerated. The accuracy of the clinical diagnosis according to UK Brain Bank Criteria has been reported to be around 85% in clinical diagnoses by movement disorder specialists and up to 50% based on autopsy verification (Adler et al. Citation2014). An overlap with other neurodegenerative disorders has been reported.
In congruency with the AD biomarkers, the quantification of αSyn in biological fluids as a biomarker of αSyn-related neurodegenerative disorders has received much attention in the last years as systematically reviewed in (Simonsen et al. Citation2016). Total αSyn can be reliably measured with different assays; in CSF it has been shown to be decreased in PD and in the other αSyn aggregation disorders, MSA and DLB, in single centre (Tokuda et al. Citation2006; Mollenhauer et al. Citation2008; Mollenhauer et al. Citation2011; Hall et al. Citation2012), and in PD also in multicentre studies (Kang et al. Citation2013; Kang et al. Citation2016), but with significant overlap of single values between patient groups. Increased αSyn has also been shown in plasma EVs performing at least as well as CSF αSyn in diagnostic classification (Shi et al. Citation2014). Therefore, and due to the complexity and the clinical heterogeneity of the disease, it is highly likely that a panel of biomarkers is as necessary as accurate biomarkers for PD.
Alternative splicing and post-translational modifications of proteins result in an increased aggregation potential and oligomer formation and accumulation (Beyer and Ariza Citation2013). While the underlying aetiologies for αSyn aggregation are not well understood, environmental exposures and genetic mutations have been shown to trigger the misfolding and aggregation of αSyn (Breydo et al. Citation2012). The result of αSyn and its aggregates is neurotoxicity with malfunction of cellular processes and alteration of its normal physiological function (Bennett Citation2005). αSyn in Lewy bodies has been shown to be phosphorylated (at S87, S129 or Y125), ubiquitinated (K12, K21, K23), truncated (at its C terminus) and oxidised (by tyrosine nitration). Besides the monomeric αSyn species mentioned above, oligomeric and post-translationally modified αSyn can be detected in the CSF, but it is largely unknown to what extent monomeric and oligomeric αSyn levels and post-translational modifications in the CSF reflect the protein’s condition in the CNS or correlate with disease progression or severity (Schmid et al. Citation2013). Post-translational modifications of αSyn are hypothesised to show better accuracy and other marker proteins have been proposed for the diagnosis of PD, but thorough validated studies with independent cohorts and longitudinal samples are lacking (Schmid et al. Citation2013). Single studies have shown increased levels of oligomeric αSyn levels in CSF of PD (Majbour et al. Citation2016) and DLB subjects (Hansson et al. Citation2014) that may even change during progression of the disease. Phosphorylation of serine 129 of αSyn is a pathological event and levels can be quantified in CSF in single assays showing increased levels in PD (Wang et al. Citation2012; Majbour et al. Citation2016).
The proximity to the central nervous system makes CSF an attractive matrix for biomarker studies and this biofluid has been investigated primarily, but recent studies have also shown the presence of αSyn in peripheral fluids, likely due to involvement of peripheral organs in PD (Del Tredici et al. Citation2010). Studies have shown that αSyn is also present in other extracellular fluids, including blood and saliva. αSyn levels in blood are highly abundant, especially in erythrocytes (El-Agnaf et al. Citation2003; Barbour et al. Citation2008; Mollenhauer et al. Citation2008; Scherzer et al. Citation2008; Devic et al. Citation2011). Conflicting results have been reported for plasma αSyn levels, with two studies reporting elevated αSyn in PD (El-Agnaf et al. Citation2006; Lee et al. Citation2006), one study with decreased levels (Li et al. Citation2007), and one with no difference (Park et al. Citation2011). The variability in these results may be related to the variation between methodologies used in these studies. The lack of consistency and the large overlap of single values in the all studies may be attributed to assay and antibody differences, different processing of samples and the contamination of the CSF with erythrocytes, which few of the studies accounted for. But also clinical heterogeneity might cause this overlap. Larger biomarker studies like the Parkinson Progression Marker Initiative of the Michael J. Fox Foundation (www.ppmi-info.org) will enable further investigations of subtypes and confounding factors.
Outside the central nervous system, αSyn pathology appears to precede the pathology in the substantia nigra, which could offer the potential for the development of a surrogate biomarker for early diagnosis through the quantification of αSyn in peripheral tissue and/or extracellular body fluid. According to Braak, αSyn pathology spreads in a stereotypic pattern, affecting the peripheral dorsal motor nerve of the vagus nerve located in the submucosa of the gastrointestinal (GI) tract at a very early stage and spreading centrally to the CNS to involve the substantia nigra in the mid-stage and typical symptomatic motor part of PD. In fact, αSyn was found in PD patients in neurons of the autonomic nerve systems in biopsies from the colon tissue, salivary glands and skin (Lebouvier et al. Citation2008; Lebouvier et al. Citation2010; Cersosimo et al. Citation2011; Shannon et al. Citation2012; Beach et al. Citation2013; Donadio et al. Citation2014). This is currently subject of investigation for example in the Systemic Synuclein Sampling Study (S4; https://www.michaeljfox.org/page.html?s4).
CJD biomarkers
Routine parameters
The basic routine tests in the CSF are generally normal in patients with CJD. In advanced stages, a moderate increase in total protein levels in the CSF can be observed. Oligoclonal bands are rare and no inflammatory reaction is observed (Jacobi et al. Citation2005).
14-3-3 Test
A large number of studies demonstrated that a positive 14-3-3 protein detection is highly sensitive for sporadic CJD (sCJD) diagnosis and correlates with clinical diagnosis in 85%–94% of cases (Sanchez-Juan et al. Citation2006; Stoeck et al. Citation2012). 14-3-3 protein levels increase with disease progression and a decrease in end-stage disease. This biomarker became important in the differential diagnostic procedure, and AD and potentially reversible dementia (in up to 30%) were identified as most important differential diagnoses (Van Everbroeck et al. Citation2004; Heinemann et al. Citation2007; Kelley et al. Citation2009; Chitravas et al. Citation2011). The sensitivity, specificity and predictive values of 14-3-3 have been discussed extensively. A multicenter European study on more than 10,000 patients demonstrated high specificity of the test of around 95% in the context of neurodegenerative disorders. Most false positives occurred in inflammatory diseases and in stroke patients as well as after epileptic seizures, i.e. medical conditions, which can be easily differentiated from CJD syndrome (Sanchez-Juan et al. Citation2006; Stoeck et al. Citation2012).
With respect to methodological problems, the analysis of 14-3-3 protein is done using western blotting and there is no generally accepted standard for which results should be compared or which isoform should be detected. Therefore, the evaluation of 14-3-3 test results can be subject to interpretative problems and requires experience from laboratory personnel. To overcome this difficulty, several quantitative methods such as ELISA and protein capture assays were developed. External QC schemes are extremely important to ensure the quality of the analyses (Schmitz, Ebert, et al. Citation2016).
Tau
Another important marker involves the analysis of total Tau protein and its phosphorylated isoforms. Tau levels in CSF are markedly elevated in patients with CJD and the phosphorylated forms remain low. While several pTau assays for detection of Tau phosphorylated at different sites are commercially available, no comparative analysis has been performed to define the best detection methodology, optimal conditions and optimal test variables. A retrospective cohort study on more than 9000 CSF samples performed in routine clinical testing, cross-referencing to the Swedish Mortality Registry, found AUC values of >0.9 for the CSF Tau/pTau ratio to differentiate CJD from non-CJD, AD and other dementias (Skillback, Rosen, et al. Citation2014).
Molecular disease phenotype, genes and CSF alterations in CJD: PRNP codon 129 genotype
CSF biomarker levels have been demonstrated to be influenced also by several genetic determinants. The major well-known genetic factor influencing prion biomarkers accuracy is the codon usage at position 129 of the prion protein gene (PRNP). In sCJD, a combination of methionine–valine polymorphism at position 129 (MM, MV, VV), along with prion typing (type 1 or 2 depending on the electrophoretic mobility of the pathological PrPSc protein) defines the molecular type of the disease. The different molecular subtypes present well-defined histopathological features and differ by age at onset and disease course (Parchi et al. Citation2009; Parchi et al. Citation2012).
Tau levels differed considerably between PRNP codon 129 genotypes in sCJD and are considerably higher in PrP type 1 MM and MV patients but lower in those presenting VV genotype (Sanchez-Juan et al. Citation2006; Humpel Citation2011; Karch et al. Citation2015; Gmitterova et al. Citation2016).
Influence of sCJD molecular typing is also reported for other biomarkers such as 14-3-3, neuron-specific enolase, and S100 proteins. For 14-3-3, differences among molecular subtypes appear to be related to the PrP type rather than to the codon 129 genotype (Castellani et al. Citation2004; Gmitterova et al. Citation2016; Leitao et al. Citation2016). Higher 14-3-3 protein levels are observed in the classical sCJD subtypes MM1 and MV1 compared to patients presenting atypical subtypes (MV2). Increased sensitivity was detected in PrP type 1 than in PrP type 2, whereas the lower levels were observed in the subtypes associated to longer disease duration (Castellani et al. Citation2004; Gmitterova et al. Citation2009).
Role of in vitro protein misfolding amplification assays in prion disease diagnostics
The self-propagating replication of the abnormally folded host-derived prion protein (PrPC) is characteristic for human prion diseases. The pathogenic conversion mechanism of PrP is the basis for a number of different in vitro protein misfolded amplification assays which enables for the first time to study the conversion processes of PrPSc in vitro. Several in vitro conversion-systems are available now (Saborio et al. Citation2001; Colby et al. Citation2007; Atarashi et al. Citation2008; Atarashi et al. Citation2011).
The test systems have been adapted to the human CSF. The real-time quaking-induced conversion (RT-QuIC) allows amplifying the minimal amount of misfolded PrP to detectable levels in a reasonable time frame of up to 80 h (Schmitz, Cramm, et al. Citation2016).
In the RT-QuIC assay, samples are subjected to shaking, which breaks PrP-aggregates into new reactive seeds for conversion and incubation. With each cycle the amyloid reaction product can increase exponentially. Aggregated PrP is monitored by the use of thioflavin-T. The RT-QuIC has been applied to human brain tissue, CSF or the olfactory neuroepithelium. Meanwhile, the CSF RT-QuIC has been standardised and validated thoroughly and was proven to be highly reproducible and stable (Cramm et al. Citation2016). The diagnostic accuracy is very high: a specificity of almost 100% and a sensitivity of 85% (Atarashi et al. Citation2011; McGuire et al. Citation2012; Sano et al. Citation2013; Cramm et al. Citation2016).
The concept of protein misfolding was previously thought to be related solely to prion diseases. Since similar characteristics are discussed for other misfolded proteins, the RT-QuIC methodology has considerable diagnostic potential that may become relevant also for other misfolded proteins/diseases and will result in an increase of the application spectrum of this test (Salvadores et al. Citation2014; Stancu et al. Citation2015). Indeed, a RT-QuIC test detection for αSyn has been reported recently (Fairfoul et al. Citation2016). Furthermore, it was recently shown that the total level of PrP in CSF could be measured by a less time consuming ELISA and it was proven to be highly accurate in an autopsy-confirmed cohort for the detection of definite CJD compared to definite AD and controls. It was shown that the concentration in definite CJD was decreased compared to the levels in definite AD and controls. Also, when considering clinical differential diagnosis between CJD and atypical AD phenotypes, the total levels of PrP in CSF reached a diagnostic accuracy of 82.1% sensitivity and 91.3% specificity (Dorey, Tholance, et al. Citation2015).
CSF and blood biomarkers of cerebral amyloid angiopathy
Vascular cognitive impairment and dementia and cerebral amyloid angiopathy
Vascular cognitive impairment and dementia (VCID) is a form of dementia that is triggered by damage to cerebral blood vessels or cerebrovascular disease (Sachdev et al. Citation2014). Cerebral amyloid angiopathy (CAA) is a prominent form of small-vessel disease that can cause VCID and haemorrhage in the elderly (Arvanitakis et al. Citation2011; Viswanathan and Greenberg Citation2011). CAA results from the accumulation of various amyloid proteins within and along leptomeningeal and intracortical capillaries, small and medium-sized arteries and arterioles of the brain (Vinters Citation1987; Rensink et al. Citation2003; Attems et al. Citation2011). The most prevalent form of CAA involves the accumulation of the Aβ peptides, which is present at varying levels in >80% of older healthy individuals (Rensink et al. Citation2003; Arvanitakis et al. Citation2011; Attems et al. Citation2011; Boyle et al. Citation2015). The Aβ peptide composition of CAA is clearly different from that in senile plaques, with Aβ40 being the predominant isoform, whereas in senile plaques Aβ42 prevails (Verbeek et al. Citation1997). CAA is the most common vascular co-morbidity found in the brains of AD patients (Rensink et al. Citation2003; Attems and Jellinger Citation2004), and studies have reported that cerebral microvascular Aβ deposition is associated with dementia in individuals afflicted with AD (Attems and Jellinger Citation2004; Attems et al. Citation2011; Boyle et al. Citation2015).
Cerebrovascular accumulation of Aβ is presumably caused by a defective clearance of Aβ. Cerebral clearance pathways for Aβ are thought to involve several mechanisms that likely act in concert including: (a) drainage of Aβ along perivascular pathways via the glymphatic pathway (Iliff et al. Citation2012); (b) transport of Aβ across the blood–brain barrier into the systemic circulation (Deane et al. Citation2009); and (c) enzymatic or phagocytic clearance by brain cells (e.g. microglia/astrocytes) (Miners et al. Citation2011).
Identification of CAA in individuals
Currently, clinical evidence for the presence of CAA is based on the presence of haemorrhagic manifestations of the disease (Viswanathan and Greenberg Citation2011): intracerebral haemorrhages (ICH) in a lobar location, small microbleeds with a lobar distribution, or superficial siderosis. This latter lesion comprises a distinct pattern of blood-breakdown product deposition limited to cortical sulci over the convexities of the cerebral hemispheres (Charidimou et al. Citation2015). These manifestations, are the basis of the widely used ‘Boston criteria’ for CAA, which are currently used for the clinical diagnosis of CAA in patients (Smith and Greenberg Citation2003; Linn et al. Citation2010); on the other hand the Boston criteria do not provide definitive proof of the disease, but at best yields a diagnosis of ‘probable CAA’. Final proof of the presence of CAA is still based on its histological detection following a (rarely performed) brain biopsy or confirmation at autopsy. Another limitation of the Boston criteria is that they are based on the presence of cerebral haemorrhages and do not allow for detecting early stages of the disease since haemorrhages likely occur during relatively late stages of the disease. In fact, neuropathological findings demonstrate that abundant CAA is prevalent without the presence of microbleeds or superficial siderosis, in particular in patients with AD (Greenberg and Vonsattel Citation1997; Yamada Citation2000). Biomarkers for CAA for diagnostic purposes or monitoring treatment effects should ideally be sensitive, specific, and reflect severity of amyloid burden. Intracerebral haemorrhages, microbleeds and superficial siderosis are not optimal biomarkers for CAA, since they are not amyloid specific and cannot be considered a continuous variable. Thus, there is a need for biomarkers for early stages of CAA prior to the presence of haemorrhagic lesions detected by neuroimaging.
CSF and blood biomarkers of CAA
Currently, biomarkers to detect CAA are scarce and there are only a few studies aimed at identifying biomarkers for CAA. It has been recently demonstrated that the pattern of Aβ42/40 deposition as found in CAA is reflected in the composition of CSF of CAA patients, i.e. by decreased levels of both Aβ40 and Aβ42 peptides in the CSF. This is in contrast to AD, where the relative paucity of accumulation of parenchymal Aβ40 accumulation is reflected in normal CSF Aβ40 levels (Verbeek et al. Citation2009). These results have subsequently been confirmed in other cohorts of patients with AD by independent groups (Renard et al. Citation2012; Tamura et al. Citation2014). Recently, these studies were complemented by a study on patients with superficial siderosis (Renard et al. Citation2016), in which a similarly decreased Aβ40 concentration in the CSF of CAA patients was reported.
Tau proteins (both total and phosphorylated forms) are only marginally elevated in the CSF from CAA patients compared to controls, but are substantially lower than those found in AD patients (Verbeek et al. Citation2009; Renard et al. Citation2012). Probably these marginally elevated Tau protein levels are attributable to low-level of concomitant AD pathology (neurofibrillary tangles) in pure CAA patients.
Microbleeds are often considered as a late-stage manifestation of CAA, visible on T2* or SWI MRI sequences. This view, however, can be challenged as microbleeds may also have vasculopathic causes, such as fibrinoid necrosis or a cavernoma (van Veluw et al. Citation2016). Previous studies demonstrated an independent correlation between decreased CSF Aβ42 and the occurrence of cortical microbleeds in a heterogenous cohort of dementia patients (Shams et al. Citation2016). Patients with AD and with multiple microbleeds (defined as more than eight) also had lower CSF Aβ42 levels, and increased Tau and pTau levels compared to AD patients without microbleeds (Goos et al. Citation2009). The associations between the occurrence of microbleeds in AD patients and CSF Aβ42 and Tau, without differences in the CSF Aβ40 levels, were confirmed in two other publications (Goos et al. Citation2012; Kester et al. Citation2014).
A rare complication of CAA comprises CAA-related inflammation (CAA-ri), also known as Aβ-related angiitis. Patients with Aβ-related angiitis are clinically characterised by acute/subacute neurological impairment, headache, behavioural changes, seizures and focal neurological deficits. During the acute phase of CAA-ri, increased levels of anti-Aβ autoantibodies can be found in the CSF, as well as increased levels of Tau and pTau proteins (Piazza et al. Citation2013).
Several monogenic, familial, forms of CAA exist that result from mutations that reside within the Aβ peptide sequence of APP gene including the Dutch-type Aβ E22Q mutation and the Iowa-type Aβ D23N mutation (Levy et al. Citation1990; Van Broeckhoven et al. Citation1990; Grabowski et al. Citation2001; Van Nostrand et al. Citation2001). So far, no studies have been published on the relation between CSF Aβ levels and CAA in these patients, with the exception of a single case with E22Q (Verbeek et al. Citation2009). However, decreased plasma Aβ42, but not Aβ40, levels have been reported in Dutch E22Q mutation carriers (Bornebroek et al. Citation2003). In patients with sporadic CAA, plasma Aβ40, but not Aβ42, concentrations were associated with white matter hyperintensities (Gurol et al. Citation2006), indicating that circulating Aβ peptides may be an indicator of cerebral microvascular damage. Moreover, in patients with multiple CAA-related intracerebral haemorrhages, both plasma Aβ42 and Aβ40 concentrations were higher than in controls (Hernandez-Guillamon et al. Citation2012).
Future prospects
Relatively few studies have addressed body fluid biomarkers for CAA. Currently, the identification of CAA in patients relies on the presence of a large lobar haemorrhages, cerebral microbleeds and superficial siderosis, which are late manifestations of the accumulation of Aβ. Moreover, these haemorrhagic manifestations are not specific for CAA, but may occur in other neurological diseases. Demonstration of reduced concentrations of both Aβ40 and Aβ42 peptides in the CSF, in the absence of increased phosphorylated Tau proteins, may indicate CAA. Larger studies will be needed to demonstrate the clinical application of these CSF biomarkers for CAA. Since it is currently not possible to detect CAA development at stages prior to the occurrence of haemorrhage manifestations, animal models in which the gradual development of CAA can be studied, will be crucial to the development of fluid biomarkers that will be able to track early stages of cerebrovascular amyloid deposition. Specific animal models, either transgenic or non-transgenic, of CAA would facilitate biomarker development. Such animal models will also be instrumental to study the imaging abnormalities that occur as a consequence of CAA and to study disease progression and to develop potential interventions specifically targeted to CAA.
Cost-effectiveness of the CSF biomarkers in AD and other dementia disorders
Finally, extremely important are the health-economic aspects of the biomarkers research and the application of the biomarkers as a routine diagnostic tool in dementia disorders.
The worldwide care costs of dementia were estimated US $818 billion in 2015 (Prince et al. Citation2015). National care budgets are limited, which forces governments to select among all available healthcare technologies for reimbursement in clinical practice. Choices are ideally based on cost-effectiveness evidence, such that the available budget is spent on the selection of interventions that result in the maximum societal health gain, in other words, to get the best value for money (Knapp Citation2015).
Whether CSF biomarkers, extensively discussed in this paper, are cost-effective depends on evidence on incremental costs and incremental effects (in terms of health or health-related quality of life) between a situation in which CSF biomarkers are used to set the diagnosis compared to a situation in which CSF biomarkers are not used (and only is being relied on tests from the usual care diagnostic workup) in people with a cognitive disorder. Such evidence is likely not available from randomised trials due to limitations of blinding and follow-up duration. As an alternative, a so-called decision analytic model is regularly used to simulate the likely effects of diagnostic tests in terms of costs and quality of life combining various pieces of evidence (Schaafsma et al. Citation2009), such as diagnostic accuracy, test costs and the effect of treatment on health-related quality of life in the subgroup tested positive.
Current evidence
A systematic review was performed to identify studies evaluating the cost-effectiveness of diagnostic interventions for AD (Handels et al. Citation2014), and was updated to October 2016 (using only one rater RH of the evidence). This revealed one study on the costs per correct diagnosis when using CSF biomarkers to decide upon off-label Donepezil treatment in MCI (Valcarcel-Nazco et al. Citation2014) using a decision analytic model. The study reported lower costs per correctly diagnosed patient when using CSF (€1,336) versus using standard clinical diagnostic criteria (€3,167). The results are subject to two major limitations. First, the simulation study relied on the assumption that off-label treatment is both effective and reduces costs in MCI, which contradicts available evidence (Raschetti et al. Citation2007; Russ and Morling Citation2012; Cooper et al. Citation2013). Second, the study did not report on the impact of the improved diagnostic accuracy on a person’s health. Therefore, this evidence is considered insufficient for reimbursement decision-making.
Challenges and recommendations
Schemes similar to the typical four-phased evaluation of new pharmaceuticals also exist for the evaluation of new diagnostic tests (Lijmer et al. Citation2009). Evidence on the first phases of technical efficacy, diagnostic accuracy, diagnostic thinking efficacy and patient outcomes efficacy often precede studies on the last phase of cost-effectiveness. A great deal of studies have reported evidence on the second phase (van Rossum et al. Citation2010; Ritchie et al. Citation2014; Olsson et al. Citation2016) and few studies on the third phase (Duits et al. Citation2015; Meijs et al. Citation2015; Handels et al. Citation2016). However, there is neither evidence on patient outcomes efficacy for CSF nor other advanced diagnostics for AD (Dubois et al. Citation2015). Various studies have evaluated psychological reactions related to receiving a diagnosis or prognosis of MCI or dementia (Frank et al. Citation2006; Lingler et al. Citation2006; Joosten-Weyn Banningh et al. Citation2008; Robinson et al. Citation2011; Rahman et al. Citation2012; Beard and Neary Citation2013, Paulsen et al. Citation2013; Dubois et al. Citation2015; Johnson et al. Citation2015) with mixed outcomes, among which relief, worrying, planning activities, stress and stigmatisation. Future studies should attempt to empirically estimate health effects caused by adding a LP to the standard diagnostic workup and using the CSF biomarker test results for medical management or advice. Such effects could be any emotional, social, behavioural or cognitive effects as well as any effects from pharmacological or non-pharmacological interventions that have been decided based upon the test result (Bossuyt and McCaffery Citation2009). Likewise, costs should be empirically estimated by measuring visits to care professionals, hours of informal care and productivity losses. This is ideally done in a randomised setting (Ferrante di Ruffano et al. Citation2012) to extract the effect attributed to the CSF biomarker results. However, such design has its limitations in terms of a relatively short time frame and the number of intervention arms to reflect various possible test pathways. A decision analytic model could be used to simulate long-term effects and a wide range of test pathways in terms of combinations and test-stopping rules (Schaafsma et al. Citation2009). Such a model could also include the impact of a false-positive and false negative diagnosis or prognosis on a person’s health and care consumption.
Another challenge for routine CSF testing relates to the medical infrastructure. An LP requires personnel time, training and facilities. Although CSF samples can be sent to central laboratories for analysis, the capacity needs to be scaled up to meet the incidence rates of MCI and mild dementia if the LP becomes standard procedure in memory clinics (Wimo et al. Citation2014).
If disease-modifying treatment (DMT) becomes available in the future, the health-economics of CSF analysis likely change. Although the framework for evaluation as described above can still be applied it is the dynamic with the health-economic impact of treatment that completely changes. DMT costs are likely multiple times higher than the costs of the lumbar puncture, of which reported prices range between €130 and €622 per LP (Jedenius et al. Citation2010; van Rossum et al. Citation2010; Wimo et al. Citation2013). CSF might serve as a tool to predict treatment response rather than to identify AD pathology or to determine the prognosis of disease progression. Although these three concepts are highly related, the optimal cut-off to indicate the result as abnormal in order to identify AD aetiology (e.g. when correlation to post-mortem is optimum) might be different from the optimal cut-off to decide upon providing DMT (to ensure optimal treatment response resulting into maximum health gain at minimal use of care resources). For example, when DMT is relatively expensive and health improvement is minor, preventing overtreatment is important from a health-economic viewpoint. CSF analysis can be used to verify persons expected to have AD in order to prevent false-positive diagnoses and ensure that the costs of overtreatment are kept to a minimum. Vice versa, if DMT is relatively cheap and health effects are substantial, preventing undertreatment is important, for example by verifying persons expected not to have AD using CSF (Handels et al. Citation2015). The latter is important to ensure the opportunity to improve a person’s health by DMT is not lost by a false-negative diagnosis. Small improvements in treatment decision-making could largely improve the cost-effectiveness of DMT, which are relatively easily offset by the costs of obtaining CSF biomarkers. This potential of CSF biomarkers also applies to other AD imaging and biomarker tests as has been shown by various simulation studies (Biasutti et al. Citation2012; Guo et al. Citation2012; Skoldunger et al. Citation2013).
Box 1. Evidence supporting a role for CSF biomarkers in clinical trials in AD.
Statement of interest
None to declare.
Acknowledgements
This is an EU Joint Programme – Neurodegenerative Disease Research (JPND) project, supported through the funding organisations under the aegis of JPND (www.jpnd.eu). The research leading to these results has received support from the Innovative Medicines Initiative Joint Undertaking under EMIF grant agreement n° 115372, resources of which are composed of financial contribution from the European Union’s Seventh Framework Programme (FP7/2007-2013) and EFPIA companies’ in kind contribution. This study has been supported by a grant from the German Federal Ministry of Education and Research (BMBF): Kompetenznetz Demenzen (01GI0420).
Piotr Lewczuk is supported by funds from the Leading National Research Centre (KNOW), and grants for neurodegenerative diseases, Medical University of Białystok, Białystok, Poland, and received consultation and lectures honoraria from Innogenetics/Fujirebio Europe, IBL International, AJ Roboscreen, Beckman Coulter, Virion/Serion GmbH, and Roche.
Piotr Lewczuk and Natalia Ermann were supported by the German Bundesministerium für Bildung und Forschung (grant 01ED1203D) within the BIOMARKAPD Project of the JPND.
Sid E. O’Bryant receives funding from the NIH/NIA under awards AG054073, AG051848 and from the Alzheimer?s Association. He has patents pending related to blood biomarkers in Alzheimer?s disease. He has served on an advisory board and received honoraria from Roche Diagnostics. He is a consultant to and owns stock in Cx Precision Medicine, Inc.
Henrik Zetterberg is a Walllenberg Academy Fellow and supported by grants from the Swedish and European Research Councils.
Harald Hampel is supported by the AXA Research Fund, the Fondation Université Pierre et Marie Curie and the ‘Fondation pour la Recherche sur Alzheimer’, Paris, France. The research leading to these results has received funding from the programme ‘Investissements d’avenir’ ANR-10-IAIHU-06 (Agence Nationale de la Recherche-10-IA Agence Institut Hospitalo-Universitaire-6). He serves as Senior Associate Editor for the journal Alzheimer’s & Dementia; he has been a scientific consultant and/or speaker and/or attended scientific advisory boards of Axovant, Anavex, Eli Lilly and company, GE Healthcare, Cytox Ltd, Jung Diagnostics GmbH, Roche, Biogen Idec, Takeda-Zinfandel, Oryzon Genomics, Qynapse, Merck, Sharp & Dohme (MSD); and receives research support from the Association for Alzheimer Research (Paris), Pierre and Marie Curie University (Paris), Pfizer & Avid (paid to institution); and has patent applications, but receives no royalties.
Mony de Leon has funding from the NIH AG022374, AG013616, AG012101, AG008051, and from the Cohen Veterans Bioscience Foundation. He has several imaging and CSF-based patents that are managed by New York University.
John Q. Trojanowski is supported by the following grants from the National Institutes of Health: AG10124, AG17586, AG024904, and NS053488.
Simone Lista has received lecture honoraria from Roche.
Ron Handels reports personal fees from Piramal (2016) outside the submitted work and grants from BIOMARKAPD (EU JPND project) to conduct this study; grants from Actifcare (EU JPND project), grants from European Brain Council (VoT project; public-private collaboration), grants from Dutch Flutemetamol Study (public-private collaboration), grants from ROADMAP (IMI2; public-private collaboration) outside the submitted work; personal fees from Piramal (advisory), personal fees from Roche (advisory) outside the submitted work.
Jens Wiltfang is supported by an Ilídio Pinho professorship and iBiMED (UID/BIM/04501/2013), at the University of Aveiro.
Anne M. Fagan is supported by NIH grants including P50AG005681, P01AG003991, P01AG026276 and UF01AG03243807. Dr. Fagan is on the Scientific Advisory Boards for Roche Diagnostics, IBL International and AbbVie and consults for Biogen, DiamiR, LabCorp and Araclon Biotech/Griffols.
Inga Zerr is supported by Robert Koch Institute through funds from the Federal Ministry of Health (grant no. 1369-341) and DZNE.
Markus Otto was supported by the grants from JPND network PreFrontAls (01ED1512), and the German Federal Ministry of Education and Research (FTLDc O1GI1007A).
Johannes Kornhuber reports no conflict of interest with the content of the present manuscript. He has patent applications: Diagnosis of Alzheimer’s disease (WO 2004/092737 A1); Immunoglobulin-bound Ab-peptides and immunoglobulins-binding Ab-peptides in diagnosis and therapy of Alzheimer’s dementia (WO 2007/082750 A1); Large Aβ-peptide binding particles (LAPS) in diagnosis and therapy of Alzheimer’s dementia (EP 1 811 304 A1, 2007); New formulations for diagnosis of Alzheimer’s disease (WO 2011/124376 A1); Methods of differentially diagnosing dementias (EP 2095128B1, 2013).
Research conducted by José Luis Molinuevo receives support by: the EU/EFPIA Innovative Medicines Initiative Joint Undertaking AMYPAD grant agreement n° 115952; the EU/EFPIA Innovative Medicines Initiative Joint Undertaking EPAD grant agreement n° 115736; the EU/EFPIA Innovative Medicines Initiative Joint Undertaking AETIONOMY grant n° 115568; the EU JPND in Spain through the National Institute of Health Carlos III (AC14/00014) and European Regional Development Fund (ERDF): ‘a way to build Europe’; and ‘la Caixa’ Foundation. He is/has been a scientific consultant and/or attended scientific advisory boards of Roche Diagnostics, IBL, Raman Health, Biocross and Fujirebio Europe.
Brit Mollenhauer has received independent research grants from TEVA-Pharma, Desitin, Boehringer Ingelheim, GE Healthcare and honoraria for consultancy from Bayer Schering Pharma AG, Roche, AbbVie, TEVA-Pharma, Biogen and for presentations from GlaxoSmithKline, Orion Pharma, TEVA-Pharma and travel costs from TEVA-Pharma. BM is member of the executive steering committee of the Parkinson Progression Marker Initiative and PI of the Systemic Synuclein Sampling Study of the Michael J. Fox Foundation for Parkinson’s Research and has received grants from the Deutsche Forschungsgemeinschaft (DFG), BMBF, EU (Horizon2020), Parkinson Fonds Deutschland, Deutsche Parkinson Vereinigung, Michael J. Fox Foundation for Parkinson?s Research, Stifterverband für die deutsche Wissenschaft, and has scientific collaborations with Roche, Bristol Myers Squibb, Ely Lilly, Covance/BioLegend and Biogen.
Kaj Blennow holds the Torsten Söderberg Professorship at the Royal Swedish Academy of Sciences.
Marcel M. Verbeek is funded by: the CAVIA project (nr. 733050202), which has been made possible by ZonMW (The CAVIA project is part of ‘Memorabel’, the research and innovation programme for dementia, as part of the Dutch national ‘Deltaplan for Dementia’: zonmw.nl/dementiaresearch’. The CAVIA project is a consortium of Radboudumc, LUMC, Erasmus MC, VUmc, ADX Neurosciences, Philips Healthcare, Stony Brook University and Massachusetts General Hospital); BIOMARKAPD research project within the EU Joint Programme – Neurodegenerative Disease (JPND, The project is supported through national funding organisations under the aegis of JPND (http://www.jpnd.eu). For the Netherlands, the Netherlands Organisation for Health Research and Development (ZonMw)); The Internationale Stichting Alzheimer Onderzoek (projects 12506 and 14502); American Alzheimer Association (project IIRG-10-173389).
Maria Bjerke and Sebastiaan Engelborghs are partially funded by: the University of Antwerp Research Fund; unrestrictive research grants from Janssen Pharmaceutica NV and ADx Neurosciences; the Flemish Government initiated Methusalem excellence grant (EWI, www.ewi-vlaanderen.be); the Flanders Impulse Program on Networks for Dementia Research (VIND); the Agency for Innovation by Science and Technology (IWT, www.iwt.be); and the Research Foundation Flanders (FWO, www.fwo.be).
Catharina Klijn has received a clinical established investigator grant of the Dutch Heart Foundation (No 2012T077) and an Aspasia grant from the Netherlands Organisation for Health Research and Development, ZonMw (015008048).
Dimitrios Kapogiannis is supported by the Intramural Research Program of the National Institute on Aging, National Institutes of Health.
We thank Olivia Belbin for editorial assistance.
Additional information
Funding
References
- Adler CH, Beach TG, Hentz JG, Shill HA, Caviness JN, Driver-Dunckley E, Sabbagh MN, Sue LI, Jacobson SA, Belden CM, et al. 2014. Low clinical diagnostic accuracy of early vs advanced Parkinson disease: clinicopathologic study. Neurology. 83:406–412.
- Albert MS, DeKosky ST, Dickson D, Dubois B, Feldman HH, Fox NC, Gamst A, Holtzman DM, Jagust WJ, Petersen RC, et al. 2011. The diagnosis of mild cognitive impairment due to Alzheimer’s disease: recommendations from the national Institute on Aging-Alzheimer’s association workgroups on diagnostic guidelines for Alzheimer’s disease. Alzheimer’s Dementia. 7:270–279.
- Alcolea D, Carmona-Iragui M, Suarez-Calvet M, Sanchez-Saudinos MB, Sala I, Anton-Aguirre S, Blesa R, Clarimon J, Fortea J, Lleo A. 2014. Relationship between beta-Secretase, inflammation and core cerebrospinal fluid biomarkers for Alzheimer’s disease. J Alzheimer’s Dis. 42:157–167.
- Alcolea D, Martinez-Lage P, Sanchez-Juan P, Olazaran J, Antunez C, Izagirre A, Ecay-Torres M, Estanga A, Clerigue M, Guisasola MC, et al. 2015. Amyloid precursor protein metabolism and inflammation markers in preclinical Alzheimer disease. Neurology. 85:626–633.
- Alexopoulos P, Guo LH, Tsolakidou A, Kratzer M, Grimmer T, Westerteicher C, Jiang M, Bujo H, Diehl-Schmid J, Kurz A, et al. 2012. Interrelations between CSF soluble AbetaPPbeta, amyloid-beta 1-42, SORL1, and tau levels in Alzheimer’s disease. J Alzheimer’s Dis. 28:543–552.
- Aluise CD, Sowell RA, Butterfield DA. 2008. Peptides and proteins in plasma and cerebrospinal fluid as biomarkers for the prediction, diagnosis, and monitoring of therapeutic efficacy of Alzheimer’s disease. Biochim Biophys Acta. 1782:549–558.
- Amariglio RE, Mormino EC, Pietras AC, Marshall GA, Vannini P, Johnson KA, Sperling RA, Rentz DM. 2015. Subjective cognitive concerns, amyloid-beta, and neurodegeneration in clinically normal elderly. Neurology. 85:56–62.
- Andreasen N, Hesse C, Davidsson P, Minthon L, Wallin A, Winblad B, Vanderstichele H, Vanmechelen E, Blennow K. 1999. Cerebrospinal fluid beta-amyloid(1-42) in Alzheimer disease: differences between early- and late-onset Alzheimer disease and stability during the course of disease. Arch Neurol. 56:673–680.
- Andreasson U, Blennow K, Zetterberg H. 2016. Update on ultrasensitive technologies to facilitate research on blood biomarkers for central nervous system disorders. Alzheimer’s Dementia (Amsterdam, Netherlands). 3:98–102.
- Andreasson U, Lautner R, Schott JM, Mattsson N, Hansson O, Herukka SK, Helisalmi S, Ewers M, Hampel H, Wallin A, et al. 2014. CSF biomarkers for Alzheimer’s pathology and the effect size of APOE ɛ4. Mol Psychiatry. 19:148–149.
- Antonell A, Fortea J, Rami L, Bosch B, Balasa M, Sanchez-Valle R, Iranzo A, Molinuevo JL, Llado A. 2011. Different profiles of Alzheimer’s disease cerebrospinal fluid biomarkers in controls and subjects with subjective memory complaints. J Neural Transmission. 118:259–262.
- Armstrong MJ, Litvan I, Lang AE, Bak TH, Bhatia KP, Borroni B, Boxer AL, Dickson DW, Grossman M, Hallett M, et al. 2013. Criteria for the diagnosis of corticobasal degeneration. Neurology. 80:496–503.
- Arvanitakis Z, Leurgans SE, Wang Z, Wilson RS, Bennett DA, Schneider JA. 2011. Cerebral amyloid angiopathy pathology and cognitive domains in older persons. Ann Neurol. 69:320–327.
- [AsDI] Alzheimer’s Disease International. 2009. World Alzheimer Report 2009.
- Atarashi R, Satoh K, Sano K, Fuse T, Yamaguchi N, Ishibashi D, Matsubara T, Nakagaki T, Yamanaka H, Shirabe S, et al. 2011. Ultrasensitive human prion detection in cerebrospinal fluid by real-time quaking-induced conversion. Nat Med. 17:175–178.
- Atarashi R, Wilham JM, Christensen L, Hughson AG, Moore RA, Johnson LM, Onwubiko HA, Priola SA, Caughey B. 2008. Simplified ultrasensitive prion detection by recombinant PrP conversion with shaking. Nature Methods. 5:211–212.
- Attems J, Jellinger K, Thal DR, Van Nostrand W. 2011. Review: sporadic cerebral amyloid angiopathy. Neuropathol Appl Neurobiol. 37:75–93.
- Attems J, Jellinger KA. 2004. Only cerebral capillary amyloid angiopathy correlates with Alzheimer pathology–a pilot study. Acta Neuropathol. 107:83–90.
- Babapour Mofrad R, Bouwman FH, Slot RER, Timmers T, van der Flier WM, Scheltens P, Teunissen CE. 2017. Lumbar puncture in patients with neurologic conditions. Alzheimers Dement (Amst). 8:108–110.
- Bacioglu M, Maia LF, Preische O, Schelle J, Apel A, Kaeser SA, Schweighauser M, Eninger T, Lambert M, Pilotto A, et al. 2016. Neurofilament light chain in blood and csf as marker of disease progression in mouse models and in neurodegenerative diseases. Neuron. 91:494–496.
- Bacskai BJ, Frosch MP, Freeman SH, Raymond SB, Augustinack JC, Johnson KA, Irizarry MC, Klunk WE, Mathis CA, Dekosky ST, et al. 2007. Molecular imaging with pittsburgh compound B confirmed at autopsy: a case report. Arch Neurol. 64:431–434.
- Baldeiras I, Santana I, Leitao MJ, Ribeiro MH, Pascoal R, Duro D, Lemos R, Santiago B, Almeida MR, Oliveira CR. 2015. Cerebrospinal fluid Abeta40 is similarly reduced in patients with frontotemporal lobar degeneration and Alzheimer’s disease. J Neurol Sci. 358:308–316.
- Ballatore C, Lee VM, Trojanowski JQ. 2007. Tau-mediated neurodegeneration in Alzheimer’s disease and related disorders. Nat Rev Neurosci. 8:663–672.
- Bang J, Spina S, Miller BL. 2015. Frontotemporal dementia. Lancet (London, England). 386:1672–1682.
- Barbour R, Kling K, Anderson JP, Banducci K, Cole T, Diep L, Fox M, Goldstein JM, Soriano F, Seubert P, et al. 2008. Red blood cells are the major source of alpha-synuclein in blood. Neuro-Degener Dis. 5:55–59.
- Bateman RJ, Siemers ER, Mawuenyega KG, Wen G, Browning KR, Sigurdson WC, Yarasheski KE, Friedrich SW, Demattos RB, May PC, et al. 2009. A gamma-secretase inhibitor decreases amyloid-beta production in the central nervous system. Ann Neurol. 66:48–54.
- Bateman RJ, Wen G, Morris JC, Holtzman DM. 2007. Fluctuations of CSF amyloid-beta levels: implications for a diagnostic and therapeutic biomarker. Neurology. 68:666–669.
- Bateman RJ, Xiong C, Benzinger TL, Fagan AM, Goate A, Fox NC, Marcus DS, Cairns NJ, Xie X, Blazey TM, et al. 2012. Clinical and biomarker changes in dominantly inherited Alzheimer’s disease. N Engl J Med. 367:795–804.
- Beach TG, Adler CH, Dugger BN, Serrano G, Hidalgo J, Henry-Watson J, Shill HA, Sue LI, Sabbagh MN, Akiyama H. 2013. Submandibular gland biopsy for the diagnosis of Parkinson disease. J Neuropathol Exp Neurol. 72:130–136.
- Beard RL, Neary TM. 2013. Making sense of nonsense: experiences of mild cognitive impairment. Sociol Health Ill. 35:130–146.
- Beaufils E, Dufour-Rainfray D, Hommet C, Brault F, Cottier JP, Ribeiro MJ, Mondon K, Guilloteau D. 2013. Confirmation of the amyloidogenic process in posterior cortical atrophy: value of the Abeta42/Abeta40 ratio. J Alzheimer’s Dis. 33:775–780.
- Beckett LA, Harvey DJ, Gamst A, Donohue M, Kornak J, Zhang H, Kuo JH. 2010. The Alzheimer’s disease neuroimaging initiative: annual change in biomarkers and clinical outcomes. Alzheimer’s Dementia. 6:257–264.
- Bell J, O’Neill B, Brodney M, Hajos-Korcsok E, Lu Y, Riddell D, Ito K, Ueckert S, Nicholas T. 2013. A novel BACE inhibitor (PF-05297909): a two-part adaptive design to evaluate safety, pharmacokinetics and pharmacodynamics for modifying beta-amyloid in a first-in-human study. Alzheimer’s Dementia. 9:P287.
- Bellou V, Belbasis L, Tzoulaki I, Middleton LT, Ioannidis JP, Evangelou E. 2016. Systematic evaluation of the associations between environmental risk factors and dementia: an umbrella review of systematic reviews and meta-analyses. Alzheimer’s Dementia. 13:406–418.
- Bennett MC. 2005. The role of alpha-synuclein in neurodegenerative diseases. Pharmacol Ther. 105:311–331.
- Bertolotto A, Malentacchi M, Capobianco M, di Sapio A, Malucchi S, Motuzova Y, Pulizzi A, Berchialla P, Sperli F. 2016. The use of the 25 Sprotte needle markedly reduces post-dural puncture headache in routine neurological practice. Cephalalgia. 36:131–138.
- Beyer K, Ariza A. 2013. alpha-Synuclein posttranslational modification and alternative splicing as a trigger for neurodegeneration. Mol Neurobiol. 47:509–524.
- Bian H, Van Swieten JC, Leight S, Massimo L, Wood E, Forman M, Moore P, de Koning I, Clark CM, Rosso S, et al. 2008. CSF biomarkers in frontotemporal lobar degeneration with known pathology. Neurology. 70:1827–1835.
- Biasutti M, Dufour N, Ferroud C, Dab W, Temime L. 2012. Cost-effectiveness of magnetic resonance imaging with a new contrast agent for the early diagnosis of Alzheimer’s disease. PLoS One. 7:e35559.
- Billings AG, Moos RH. 1985. Life stressors and social resources affect posttreatment outcomes among depressed patients. J Abnorm Psychol. 94:140–153.
- Bittner T, Zetterberg H, Teunissen CE, Ostlund RE Jr, Militello M, Andreasson U, Hubeek I, Gibson D, Chu DC, Eichenlaub U, et al. 2016. Technical performance of a novel, fully automated electrochemiluminescence immunoassay for the quantitation of beta-amyloid (1-42) in human cerebrospinal fluid. Alzheimer’s Dementia. 12:517–526.
- Bjerke M, Andreasson U, Kuhlmann J, Portelius E, Pannee J, Lewczuk P, Umek RM, Vanmechelen E, Vanderstichele H, Stoops E, et al. 2016. Assessing the commutability of reference material formats for the harmonization of amyloid-beta measurements. Clin Chem Lab Med. 54:1177–1191.
- Bjerke M, Portelius E, Minthon L, Wallin A, Anckarsater H, Anckarsater R, Andreasen N, Zetterberg H, Andreasson U, Blennow K. 2010. Confounding factors influencing amyloid Beta concentration in cerebrospinal fluid. Int J Alzheimer’s Dis. 2010:986310.
- Blennow K, de Leon MJ, Zetterberg H. 2006. Alzheimer’s disease. Lancet (London, England). 368:387–403.
- Blennow K, Hampel H. 2003. CSF markers for incipient Alzheimer’s disease. Lancet Neurol. 2:605–613.
- Blennow K, Hampel H, Weiner M, Zetterberg H. 2010. Cerebrospinal fluid and plasma biomarkers in Alzheimer disease. Nat Rev Neurol. 6:131–144.
- Blennow K, Hampel H, Zetterberg H. 2014. Biomarkers in amyloid-beta immunotherapy trials in Alzheimer’s disease. Neuropsychopharmacology. 39:189–201.
- Blennow K, Vanmechelen E, Hampel H. 2001. CSF total tau, Abeta42 and phosphorylated tau protein as biomarkers for Alzheimer’s disease. Mol Neurobiol. 24:87–97.
- Blennow K, Zetterberg H, Rinne JO, Salloway S, Wei J, Black R, Grundman M, Liu E. 2012. Effect of immunotherapy with bapineuzumab on cerebrospinal fluid biomarker levels in patients with mild to moderate Alzheimer disease. Arch Neurol. 69:1002–1010.
- Boada M, Antunez C, Ramirez-Lorca R, DeStefano AL, Gonzalez-Perez A, Gayan J, Lopez-Arrieta J, Ikram MA, Hernandez I, Marin J, et al. 2014. ATP5H/KCTD2 locus is associated with Alzheimer’s disease risk. Mol Psychiatry. 19:682–687.
- Boot BP, Orr CF, Ahlskog JE, Ferman TJ, Roberts R, Pankratz VS, Dickson DW, Parisi J, Aakre JA, Geda YE, et al. 2013. Risk factors for dementia with Lewy bodies: a case-control study. Neurology. 81:833–840.
- Bornebroek M, De Jonghe C, Haan J, Kumar-Singh S, Younkin S, Roos R, Van Broeckhoven C. 2003. Hereditary cerebral hemorrhage with amyloidosis Dutch type (AbetaPP 693): decreased plasma amyloid-beta 42 concentration. Neurobiol Dis. 14:619–623.
- Bossuyt PMM, McCaffery K. 2009. AHRQ methods for effective health care additional patient outcomes and pathways in evaluations of testing. In: Medical tests-white paper series. Rockville (MD): Agency for Healthcare Research and Quality (US).
- Boylan KB, Glass JD, Crook JE, Yang C, Thomas CS, Desaro P, Johnston A, Overstreet K, Kelly C, Polak M, et al. 2013. Phosphorylated neurofilament heavy subunit (pNF-H) in peripheral blood and CSF as a potential prognostic biomarker in amyotrophic lateral sclerosis. J Neurol Neurosurg Psychiatry. 84:467–472.
- Boyle PA, Yu L, Nag S, Leurgans S, Wilson RS, Bennett DA, Schneider JA. 2015. Cerebral amyloid angiopathy and cognitive outcomes in community-based older persons. Neurology. 85:1930–1936.
- Braak H, Bohl JR, Muller CM, Rub U, de Vos RA, Del Tredici K. 2006. Stanley fahn lecture 2005: the staging procedure for the inclusion body pathology associated with sporadic Parkinson’s disease reconsidered. Move Disord. 21:2042–2051.
- Braak H, Braak E. 1991a. Demonstration of amyloid deposits and neurofibrillary changes in whole brain sections. Brain Pathol. 1:213–216.
- Braak H, Braak E. 1991b. Neuropathological stageing of Alzheimer-related changes. Acta Neuropathologica. 82:239–259.
- Braak H, Del Tredici K, Rub U, de Vos RA, Jansen Steur EN, Braak E. 2003. Staging of brain pathology related to sporadic Parkinson’s disease. Neurobiol Aging. 24:197–211.
- Brandner S, Thaler C, Lelental N, Buchfelder M, Kleindienst A, Maler JM, Kornhuber J, Lewczuk P. 2014. Ventricular and lumbar cerebrospinal fluid concentrations of Alzheimer’s disease biomarkers in patients with normal pressure hydrocephalus and posttraumatic hydrocephalus. J Alzheimer’s Dis. 41:1057–1062.
- Brettschneider J, Petzold A, Sussmuth SD, Ludolph AC, Tumani H. 2006. Axonal damage markers in cerebrospinal fluid are increased in ALS. Neurology. 66:852–856.
- Breydo L, Wu JW, Uversky VN. 2012. Α-synuclein misfolding and Parkinson’s disease. Biochim Biophys Acta. 1822:261–285.
- Brier MR, Gordon B, Friedrichsen K, McCarthy J, Stern A, Christensen J, Owen C, Aldea P, Su Y, Hassenstab J, et al. 2016. Tau and abeta imaging, CSF measures, and cognition in Alzheimer’s disease. Sci Transl Med. 8:338ra366.
- Brookmeyer R, Gray S, Kawas C. 1998. Projections of Alzheimer’s disease in the United States and the public health impact of delaying disease onset. Am J Publ Health. 88:1337–1342.
- Buckley RF, Maruff P, Ames D, Bourgeat P, Martins RN, Masters CL, Rainey-Smith S, Lautenschlager N, Rowe CC, Savage G, et al. 2016. Subjective memory decline predicts greater rates of clinical progression in preclinical Alzheimer’s disease. Alzheimer’s Dementia. 12:796–804.
- Buckner RL, Snyder AZ, Shannon BJ, LaRossa G, Sachs R, Fotenos AF, Sheline YI, Klunk WE, Mathis CA, Morris JC, et al. 2005. Molecular, structural, and functional characterization of Alzheimer’s disease: evidence for a relationship between default activity, amyloid, and memory. J Neurosci. 25:7709–7717.
- Buee L, Bussiere T, Buee-Scherrer V, Delacourte A, Hof PR. 2000. Tau protein isoforms, phosphorylation and role in neurodegenerative disorders. Brain Res Brain Res Rev. 33:95–130.
- Buerger K, Ewers M, Pirttila T, Zinkowski R, Alafuzoff I, Teipel SJ, DeBernardis J, Kerkman D, McCulloch C, Soininen H, et al. 2006. CSF phosphorylated tau protein correlates with neocortical neurofibrillary pathology in Alzheimer’s disease. Brain. 129:3035–3041.
- Burnham SC, Bourgeat P, Dore V, Savage G, Brown B, Laws S, Maruff P, Salvado O, Ames D, Martins RN, et al. 2016. Clinical and cognitive trajectories in cognitively healthy elderly individuals with suspected non-Alzheimer’s disease pathophysiology (SNAP) or Alzheimer’s disease pathology: a longitudinal study. Lancet Neurol. 15:1044–1053.
- Burnham SC, Faux NG, Wilson W, Laws SM, Ames D, Bedo J, Bush AI, Doecke JD, Ellis KA, Head R, et al. 2014. A blood-based predictor for neocortical Abeta burden in Alzheimer’s disease: results from the AIBL study. Mol Psychiatry. 19:519–526.
- Cairns NJ, Lee VM, Trojanowski JQ. 2004. The cytoskeleton in neurodegenerative diseases. J Pathol. 204:438–449.
- Cairns NJ, Perrin RJ, Franklin EE, Carter D, Vincent B, Xie M, Bateman RJ, Benzinger T, Friedrichsen K, Brooks WS, et al. 2015. Neuropathologic assessment of participants in two multi-center longitudinal observational studies: the Alzheimer Disease Neuroimaging Initiative (ADNI) and the Dominantly Inherited Alzheimer Network (DIAN). Neuropathology. 35:390–400.
- Carlsson CM. 2010. Type 2 diabetes mellitus, dyslipidemia, and Alzheimer’s disease. J Alzheimers Dis. 20:711–722.
- Caroli A, Prestia A, Galluzzi S, Ferrari C, van der Flier WM, Ossenkoppele R, Van Berckel B, Barkhof F, Teunissen C, Wall AE, et al. 2015. Mild cognitive impairment with suspected nonamyloid pathology (SNAP): prediction of progression. Neurology. 84:508–515.
- Carrillo MC, Blennow K, Soares H, Lewczuk P, Mattsson N, Oberoi P, Umek R, Vandijck M, Salamone S, Bittner T, et al. 2013. Global standardization measurement of cerebral spinal fluid for Alzheimer’s disease: an update from the Alzheimer’s association global biomarkers consortium. Alzheimer’s Dementia. 9:137–140.
- Casanova R, Varma S, Simpson B, Kim M, An Y, Saldana S, Riveros C, Moscato P, Griswold M, Sonntag D, et al. 2016. Blood metabolite markers of preclinical Alzheimer’s disease in two longitudinally followed cohorts of older individuals. Alzheimer’s Dementia. 12:815–822.
- Castellani RJ, Colucci M, Xie Z, Zou W, Li C, Parchi P, Capellari S, Pastore M, Rahbar MH, Chen SG, et al. 2004. Sensitivity of 14-3-3 protein test varies in subtypes of sporadic Creutzfeldt-Jakob disease. Neurology. 63:436–442.
- Cavedo E, Lista S, Khachaturian Z, Aisen P, Amouyel P, Herholz K, Jack CR Jr, Sperling R, Cummings J, Blennow K, et al. 2014. The road Ahead to cure Alzheimer’s disease: development of biological markers and neuroimaging methods for prevention trials across all stages and target populations. J Prevent Alzheimer’s Dis. 1:181–202.
- Cersosimo MG, Perandones C, Micheli FE, Raina GB, Beron AM, Nasswetter G, Radrizzani M, Benarroch EE. 2011. Alpha-synuclein immunoreactivity in minor salivary gland biopsies of Parkinson’s disease patients. Move Disord. 26:188–190.
- Charidimou A, Linn J, Vernooij MW, Opherk C, Akoudad S, Baron JC, Greenberg SM, Jager HR, Werring DJ. 2015. Cortical superficial siderosis: detection and clinical significance in cerebral amyloid angiopathy and related conditions. Brain. 138:2126–2139.
- Chen SJ, Sweatt JD, Klann E. 1997. Enhanced phosphorylation of the postsynaptic protein kinase C substrate RC3/neurogranin during long-term potentiation. Brain Res. 749:181–187.
- Cheng L, Doecke JD, Sharples RA, Villemagne VL, Fowler CJ, Rembach A, Martins RN, Rowe CC, Macaulay SL, Masters CL, et al. 2015. Prognostic serum miRNA biomarkers associated with Alzheimer’s disease shows concordance with neuropsychological and neuroimaging assessment. Mol Psychiatry. 20:1188–1196.
- Chetelat G. 2013. Alzheimer disease: abeta-independent processes-rethinking preclinical AD. Nat Rev Neurol. 9:123–124.
- Chhatwal JP, Schultz AP, Marshall GA, Boot B, Gomez-Isla T, Dumurgier J, LaPoint M, Scherzer C, Roe AD, Hyman BT, et al. 2016. Temporal T807 binding correlates with CSF tau and phospho-tau in normal elderly. Neurology. 87:920–926.
- Chieh JJ, Yang SY, Jian ZF, Wang WC, Horng HE, Yang HC, Hong C-Y. 2008. Hyper-high-sensitivity wash-free magnetoreduction assay on biomolecules using high-Tc superconducting quantum interference devices. J Appl Phys. 103:014703.
- Chien DT, Bahri S, Szardenings AK, Walsh JC, Mu F, Su MY, Shankle WR, Elizarov A, Kolb HC. 2013. Early clinical PET imaging results with the novel PHF-tau radioligand [F-18]-T807. J Alzheimer’s Dis. 34:457–468.
- Chitravas N, Jung RS, Kofskey DM, Blevins JE, Gambetti P, Leigh RJ, Cohen ML. 2011. Treatable neurological disorders misdiagnosed as Creutzfeldt-Jakob disease. Ann Neurol. 70:437–444.
- Cicognola C, Chiasserini D, Eusebi P, Andreasson U, Vanderstichele H, Zetterberg H, Parnetti L, Blennow K. 2016. No diurnal variation of classical and candidate biomarkers of Alzheimer’s disease in CSF. Mol Neurodegener. 11:65.
- Cirrito JR, Yamada KA, Finn MB, Sloviter RS, Bales KR, May PC, Schoepp DD, Paul SM, Mennerick S, Holtzman DM. 2005. Synaptic activity regulates interstitial fluid amyloid-beta levels in vivo. Neuron. 48:913–922.
- Citron M, Diehl TS, Gordon G, Biere AL, Seubert P, Selkoe DJ. 1996. Evidence that the 42- and 40-amino acid forms of amyloid beta protein are generated from the beta-amyloid precursor protein by different protease activities. Proc Natl Acad Sci USA. 93:13170–13175.
- Colby DW, Zhang Q, Wang S, Groth D, Legname G, Riesner D, Prusiner SB. 2007. Prion detection by an amyloid seeding assay. Proc Natl Acad Sci USA. 104:20914–20919.
- Collins MA, An J, Hood BL, Conrads TP, Bowser RP. 2015. Label-free LC-MS/MS proteomic analysis of cerebrospinal fluid identifies protein/pathway alterations and candidate biomarkers for amyotrophic lateral sclerosis. J Proteome Res. 14:4486–4501.
- Colonna M, Wang Y. 2016. TREM2 variants: new keys to decipher Alzheimer disease pathogenesis. Nat Rev Neurosci. 17:201–207.
- Consensus Report of the Working Group. 1998. Molecular and biochemical markers of Alzheimer’s disease. The Ronald and Nancy Reagan Research Institute of the Alzheimer’s Association and the National Institute on Aging Working Group. Neurobiol Aging. 19:109–116.
- Cooper C, Li R, Lyketsos C, Livingston G. 2013. Treatment for mild cognitive impairment: systematic review. Br J Psychiatry. 203:255–264.
- Corder EH, Saunders AM, Risch NJ, Strittmatter WJ, Schmechel DE, Gaskell PC Jr, Rimmler JB, Locke PA, Conneally PM, Schmader KE, et al. 1994. Protective effect of apolipoprotein E type 2 allele for late onset Alzheimer disease. Nat Genet. 7:180–184.
- Corder EH, Saunders AM, Strittmatter WJ, Schmechel DE, Gaskell PC, Small GW, Roses AD, Haines JL, Pericak-Vance MA. 1993. Gene dose of apolipoprotein E type 4 allele and the risk of Alzheimer’s disease in late onset families. Science. 261:921–923.
- Coric V, Salloway S, van Dyck CH, Dubois B, Andreasen N, Brody M, Curtis C, Soininen H, Thein S, Shiovitz T, et al. 2015. Targeting prodromal Alzheimer disease with avagacestat: a randomized clinical trial. JAMA Neurol. 72:1324–1333.
- Cramm M, Schmitz M, Karch A, Mitrova E, Kuhn F, Schroeder B, Raeber A, Varges D, Kim YS, Satoh K, et al. 2016. Stability and reproducibility underscore utility of RT-QuIC for diagnosis of creutzfeldt-jakob disease. Mol Neurobiol. 53:1896–1904.
- Crary JF, Trojanowski JQ, Schneider JA, Abisambra JF, Abner EL, Alafuzoff I, Arnold SE, Attems J, Beach TG, Bigio EH, et al. 2014. Primary age-related tauopathy (PART): a common pathology associated with human aging. Acta Neuropathol. 128:755–766.
- Cruchaga C, Haller G, Chakraverty S, Mayo K, Vallania FL, Mitra RD, Faber K, Williamson J, Bird T, Diaz-Arrastia R, et al. 2012. Rare variants in APP, PSEN1 and PSEN2 increase risk for AD in late-onset Alzheimer’s disease families. PLoS One. 7:e31039.
- Cummings JL. 2011. Biomarkers in Alzheimer’s disease drug development. Alzheimers Dementia. 7:e13–e44.
- Cure S, Abrams K, Belger M, Dell’agnello G, Happich M. 2014. Systematic literature review and meta-analysis of diagnostic test accuracy in Alzheimer’s disease and other dementia using autopsy as standard of truth. J Alzheimer’s Disease. 42:169–182.
- Davidsson P, Blennow K. 1998. Neurochemical dissection of synaptic pathology in Alzheimer’s disease. Int Psychogeriatr. 10:11–23.
- de Jong D, Jansen RW, Pijnenburg YA, van Geel WJ, Borm GF, Kremer HP, Verbeek MM. 2007. CSF neurofilament proteins in the differential diagnosis of dementia. J Neurol Neurosurg Psychiatry. 78:936–938.
- de Lau LM, Breteler MM. 2006. Epidemiology of Parkinson’s disease. Lancet Neurol. 5:525–535.
- de Leon MJ, Convit A, Wolf OT, Tarshish CY, DeSanti S, Rusinek H, Tsui W, Kandil E, Scherer AJ, Roche A, et al. 2001. Prediction of cognitive decline in normal elderly subjects with 2-[(18)F]fluoro-2-deoxy-D-glucose/poitron-emission tomography (FDG/PET). Proc Natl Acad Sci USA. 98:10966–10971.
- de Leon MJ, George AE, Stylopoulos LA, Smith G, Miller DC. 1989. Early marker for Alzheimer’s disease: the atrophic hippocampus. Lancet (London, England). 2:672–673.
- de Leon MJ, McRae T, Tsai JR, George AE, Marcus DL, Freedman M, Wolf AP, McEwen B. 1988. Abnormal cortisol response in Alzheimer’s disease linked to hippocampal atrophy. Lancet (London, England). 2:391–392.
- de Souza Silva MA, Lenz B, Rotter A, Biermann T, Peters O, Ramirez A, Jessen F, Maier W, Hull M, Schroder J, et al. 2013. Neurokinin3 receptor as a target to predict and improve learning and memory in the aged organism. Proc Natl Acad Sci USA. 110:15097–15102.
- De Strooper B, Karran E. 2016. The cellular phase of Alzheimer’s disease. Cell. 164:603–615.
- De Vos A, Jacobs D, Struyfs H, Fransen E, Andersson K, Portelius E, Andreasson U, De Surgeloose D, Hernalsteen D, Sleegers K, et al. 2015. C-terminal neurogranin is increased in cerebrospinal fluid but unchanged in plasma in Alzheimer’s disease. Alzheimer’s Dementia. 11:1461–1469.
- Deane R, Bell RD, Sagare A, Zlokovic BV. 2009. Clearance of amyloid-beta peptide across the blood-brain barrier: implication for therapies in Alzheimer’s disease. CNS Neurol Disord Drug Targets. 8:16–30.
- DeJesus-Hernandez M, Mackenzie IR, Boeve BF, Boxer AL, Baker M, Rutherford NJ, Nicholson AM, Finch NA, Flynn H, Adamson J, et al. 2011. Expanded GGGGCC hexanucleotide repeat in noncoding region of C9ORF72 causes chromosome 9p-linked FTD and ALS. Neuron. 72:245–256.
- del Campo M, Mollenhauer B, Bertolotto A, Engelborghs S, Hampel H, Simonsen AH, Kapaki E, Kruse N, Le Bastard N, Lehmann S, et al. 2012. Recommendations to standardize preanalytical confounding factors in Alzheimer’s and Parkinson’s disease cerebrospinal fluid biomarkers: an update. Biomark Med. 6:419–430.
- Del Tredici K, Hawkes CH, Ghebremedhin E, Braak H. 2010. Lewy pathology in the submandibular gland of individuals with incidental lewy body disease and sporadic Parkinson’s disease. Acta Neuropathol. 119:703–713.
- Delacourte A. 2006. The natural and molecular history of Alzheimer’s disease. J Alzheimers Dis. 9:187–194.
- DeMarshall CA, Han M, Nagele EP, Sarkar A, Acharya NK, Godsey G, Goldwaser EL, Kosciuk M, Thayasivam U, Belinka B, et al. 2015. Potential utility of autoantibodies as blood-based biomarkers for early detection and diagnosis of Parkinson’s disease. Immunol Lett. 168:80–88.
- DeMarshall CA, Nagele EP, Sarkar A, Acharya NK, Godsey G, Goldwaser EL, Kosciuk M, Thayasivam U, Han M, Belinka B, et al. 2016. Detection of Alzheimer’s disease at mild cognitive impairment and disease progression using autoantibodies as blood-based biomarkers. Alzheimer’s Dementia (Amsterdam, Netherlands). 3:51–62.
- Devic I, Hwang H, Edgar JS, Izutsu K, Presland R, Pan C, Goodlett DR, Wang Y, Armaly J, Tumas V, et al. 2011. Salivary alpha-synuclein and DJ-1: potential biomarkers for Parkinson’s disease. Brain. 134:e178.
- Dierckx E, Engelborghs S, De Raedt R, Van Buggenhout M, De Deyn PP, Verté D, Ponjaert-Kristoffersen I. 2009. Verbal cued recall as a predictor of conversion to Alzheimer’s disease in mild cognitive impairment. Int J Geriatr Psychiatry. 24:1094–1100.
- Dimitrov M, Alattia JR, Lemmin T, Lehal R, Fligier A, Houacine J, Hussain I, Radtke F, Dal Peraro M, Beher D, et al. 2013. Alzheimer’s disease mutations in APP but not γ-secretase modulators affect epsilon-cleavage-dependent AICD production. Nat Commun. 4:2246.
- Dobrowolska JA, Kasten T, Huang Y, Benzinger TL, Sigurdson W, Ovod V, Morris JC, Bateman RJ. 2014. Diurnal patterns of soluble amyloid precursor protein metabolites in the human central nervous system. PLoS One. 9:e89998.
- Doecke JD, Laws SM, Faux NG, Wilson W, Burnham SC, Lam CP, Mondal A, Bedo J, Bush AI, Brown B, et al. 2012. Blood-based protein biomarkers for diagnosis of Alzheimer disease. Arch Neurol. 69:1318–1325.
- Donadio V, Incensi A, Leta V, Giannoccaro MP, Scaglione C, Martinelli P, Capellari S, Avoni P, Baruzzi A, Liguori R. 2014. Skin nerve alpha-synuclein deposits: a biomarker for idiopathic Parkinson disease. Neurology. 82:1362–1369.
- Doody RS, Raman R, Farlow M, Iwatsubo T, Vellas B, Joffe S, Kieburtz K, He F, Sun X, Thomas RG, et al. 2013. A phase 3 trial of semagacestat for treatment of Alzheimer’s disease. N Engl J Med. 369:341–350.
- Doody RS, Raman R, Sperling RA, Seimers E, Sethuraman G, Mohs R, Farlow M, Iwatsubo T, Vellas B, Sun X, et al. 2015. Peripheral and central effects of gamma-secretase inhibition by semagacestat in Alzheimer’s disease. Alzheimer’s Res Ther. 7:36.
- Doody RS, Thomas RG, Farlow M, Iwatsubo T, Vellas B, Joffe S, Kieburtz K, Raman R, Sun X, Aisen PS, et al. 2014. Phase 3 trials of solanezumab for mild-to-moderate Alzheimer’s disease. N Engl J Med. 370:311–321.
- Dorey A, Perret-Liaudet A, Tholance Y, Fourier A, Quadrio I. 2015. Cerebrospinal fluid Aβ40 improves the interpretation of Aβ42 concentration for diagnosing Alzheimer’s Disease. Front Neurol. 6:247.
- Dorey A, Tholance Y, Vighetto A, Perret-Liaudet A, Lachman I, Krolak-Salmon P, Wagner U, Struyfs H, De Deyn PP, El-Moualij B, et al. 2015. Association of cerebrospinal fluid prion protein levels and the distinction between Alzheimer disease and creutzfeldt-jakob disease. JAMA Neurol. 72:267–275.
- Dorsey ER, Constantinescu R, Thompson JP, Biglan KM, Holloway RG, Kieburtz K, Marshall FJ, Ravina BM, Schifitto G, Siderowf A, et al. 2007. Projected number of people with Parkinson disease in the most populous nations, 2005 through 2030. Neurology. 68:384–386.
- Dubois B, Albert ML. 2004. Amnestic MCI or prodromal Alzheimer’s disease? Lancet Neurol. 3:246–248.
- Dubois B, Feldman HH, Jacova C, Cummings JL, Dekosky ST, Barberger-Gateau P, Delacourte A, Frisoni G, Fox NC, Galasko D, et al. 2010. Revising the definition of Alzheimer’s disease: a new lexicon. Lancet Neurol. 9:1118–1127.
- Dubois B, Feldman HH, Jacova C, Dekosky ST, Barberger-Gateau P, Cummings J, Delacourte A, Galasko D, Gauthier S, Jicha G, et al. 2007. Research criteria for the diagnosis of Alzheimer’s disease: revising the NINCDS-ADRDA criteria. Lancet Neurol. 6:734–746.
- Dubois B, Feldman HH, Jacova C, Hampel H, Molinuevo JL, Blennow K, DeKosky ST, Gauthier S, Selkoe D, Bateman R, et al. 2014. Advancing research diagnostic criteria for Alzheimer’s disease: the IWG-2 criteria. Lancet Neurol. 13:614–629.
- Dubois B, Padovani A, Scheltens P, Rossi A, Dell’Agnello G. 2015. Timely diagnosis for Alzheimer’s disease: a literature review on benefits and challenges. J Alzheimer’s Dis. 49:617–631.
- Dubois B, Touchon J, Portet F, Ousset PJ, Vellas B, Michel B. 2002. [“The 5 words”: a simple and sensitive test for the diagnosis of Alzheimer’s disease]. Presse Medicale (Paris, France: 1983). 31:1696–1699.
- Duits FH, Martinez-Lage P, Paquet C, Engelborghs S, Lleo A, Hausner L, Molinuevo JL, Stomrud E, Farotti L, Ramakers IH, et al. 2016. Performance and complications of lumbar puncture in memory clinics: results of the multicenter lumbar puncture feasibility study. Alzheimer’s Dementia. 12:154–163.
- Duits FH, Prins ND, Lemstra AW, Pijnenburg YA, Bouwman FH, Teunissen CE, Scheltens P, van der Flier WM. 2015. Diagnostic impact of CSF biomarkers for Alzheimer’s disease in a tertiary memory clinic. Alzheimer’s Dementia. 11:523–532.
- Duncan MR, Lee JM, Warchol MP. 1995. Influence of surfactants upon protein/peptide adsorption to glass and polypropylene. International Journal of Pharmaceutics 120:179–188.
- Edwards M, Hall J, Williams B, Johnson L, O’Bryant S. 2015. Molecular markers of amnestic mild cognitive impairment among Mexican Americans. J Alzheimer’s Dis. 49:221–228.
- El-Agnaf OM, Salem SA, Paleologou KE, Cooper LJ, Fullwood NJ, Gibson MJ, Curran MD, Court JA, Mann DM, Ikeda S, et al. 2003. Alpha-synuclein implicated in Parkinson’s disease is present in extracellular biological fluids, including human plasma. Faseb J. 17:1945–1947.
- El-Agnaf OM, Salem SA, Paleologou KE, Curran MD, Gibson MJ, Court JA, Schlossmacher MG, Allsop D. 2006. Detection of oligomeric forms of alpha-synuclein protein in human plasma as a potential biomarker for Parkinson’s disease. Faseb J. 20:419–425.
- EMA. 2016. Draft guideline on the clinical investigation of medicines for the treatment of Alzheimer’s disease and other dementias.
- Emanuel EJ, Wendler D, Grady C. 2000. What makes clinical research ethical? JAMA. 283:2701–2711.
- Engelborghs S, De Vreese K, Van de Casteele T, Vanderstichele H, Van Everbroeck B, Cras P, Martin JJ, Vanmechelen E, De Deyn PP. 2008. Diagnostic performance of a CSF-biomarker panel in autopsy-confirmed dementia. Neurobiol Aging. 29:1143–1159.
- Engelborghs S, Niemantsverdriet E, Struyfs H, Blennow K, Brouns R, Comabella M, Dujmovic I, van der Flier W, Frölich L, Galimberti D, et al. 2017. Consensus guidelines for lumbar puncture in patients with neurological diseases. Alzheimers Dement (Amst). 8:111–126.
- Escott-Price V, Sims R, Bannister C, Harold D, Vronskaya M, Majounie E, Badarinarayan N, Morgan K, Passmore P, Holmes C, et al. 2015. Common polygenic variation enhances risk prediction for Alzheimer’s disease. Brain. 138:3673–3684.
- Estevez-Gonzalez A, Kulisevsky J, Boltes A, Otermin P, Garcia-Sanchez C. 2003. Rey verbal learning test is a useful tool for differential diagnosis in the preclinical phase of Alzheimer’s disease: comparison with mild cognitive impairment and normal aging. Int J Geriatr Psychiatry. 18:1021–1028.
- Evangelou E, Ioannidis JPA. 2013. Meta-analysis methods for genome-wide association studies and beyond. Nat Rev Genet. 14:379–389.
- Evans DA, Hebert LE, Beckett LA, Scherr PA, Albert MS, Chown MJ, Pilgrim DM, Taylor JO. 1997. Education and other measures of socioeconomic status and risk of incident Alzheimer disease in a defined population of older persons. Arch Neurol. 54:1399–1405.
- Evans MC, Couch Y, Sibson N, Turner MR. 2013. Inflammation and neurovascular changes in amyotrophic lateral sclerosis. Mol Cell Neurosci. 53:34–41.
- Ewers M, Mattsson N, Minthon L, Molinuevo JL, Antonell A, Popp J, Jessen F, Herukka SK, Soininen H, Maetzler W, et al. 2015. CSF biomarkers for the differential diagnosis of Alzheimer’s disease: a large-scale international multicenter study. Alzheimer’s Dementia. 11:1306–1315.
- Fagan AM, Mintun MA, Shah AR, Aldea P, Roe CM, Mach RH, Marcus D, Morris JC, Holtzman DM. 2009. Cerebrospinal fluid tau and ptau(181) increase with cortical amyloid deposition in cognitively normal individuals: implications for future clinical trials of Alzheimer’s disease. EMBO Mol Med. 1:371–380.
- Fagan AM, Xiong C, Jasielec MS, Bateman RJ, Goate AM, Benzinger TL, Ghetti B, Martins RN, Masters CL, Mayeux R, et al. 2014. Longitudinal change in CSF biomarkers in autosomal-dominant Alzheimer’s disease. Sci Transl Med. 6:226ra230.
- Fairfoul G, McGuire LI, Pal S, Ironside JW, Neumann J, Christie S, Joachim C, Esiri M, Evetts SG, Rolinski M, et al. 2016. Alpha-synuclein RT-QuIC in the CSF of patients with alpha-synucleinopathies. Ann Clin Transl Neurol. 3:812–818.
- Fang P, Li X, Luo JJ, Wang H, Yang XF. 2013. A Double-edged sword: uric acid and neurological disorders. Brain Disord Ther. 2:109.
- Farlow M, Arnold SE, van Dyck CH, Aisen PS, Snider BJ, Porsteinsson AP, Friedrich S, Dean RA, Gonzales C, Sethuraman G, et al. 2012. Safety and biomarker effects of solanezumab in patients with Alzheimer’s disease. Alzheimers Dement. 8:261–271.
- Farrer LA, Cupples LA, Haines JL, Hyman B, Kukull WA, Mayeux R, Myers RH, Pericak-Vance MA, Risch N, van Duijn CM. 1997. Effects of age, sex, and ethnicity on the association between apolipoprotein E genotype and Alzheimer disease. A meta-analysis. APOE and Alzheimer Disease Meta Analysis Consortium. JAMA. 278:1349–1356.
- Fedorov NB, Pasinelli P, Oestreicher AB, DeGraan PN, Reymann KG. 1995. Antibodies to postsynaptic PKC substrate neurogranin prevent long-term potentiation in hippocampal CA1 neurons. Eur J Neurosci. 7:819–822.
- Feneberg E, Steinacker P, Lehnert S, Neumann M, Otto M. 2012. Recent biomarker approaches in the diagnosis of frontotemporal lobar degeneration/Neurochemische Ansätze in der Diagnose der Frontotemporalen Lobärdegeneration. In: Laboratoriums Medizin. p. 3.
- Feneberg E, Steinacker P, Lehnert S, Schneider A, Walther P, Thal DR, Linsenmeier M, Ludolph AC, Otto M. 2014. Limited role of free TDP-43 as a diagnostic tool in neurodegenerative diseases. Amyotrophic Lateral Scler Frontotemp Degener. 15:351–356.
- Ferrante di Ruffano L, Hyde CJ, McCaffery KJ, Bossuyt PM, Deeks JJ. 2012. Assessing the value of diagnostic tests: a framework for designing and evaluating trials. BMJ (Clinical Research Ed). 344:e686.
- Fiandaca MS, Kapogiannis D, Mapstone M, Boxer A, Eitan E, Schwartz JB, Abner EL, Petersen RC, Federoff HJ, Miller BL, et al. 2015. Identification of preclinical Alzheimer’s disease by a profile of pathogenic proteins in neurally derived blood exosomes: a case-control study. Alzheimer’s Dementia. 11:600–607.e601.
- Fleisher AS, Raman R, Siemers ER, Becerra L, Clark CM, Dean RA, Farlow MR, Galvin JE, Peskind ER, Quinn JF, et al. 2008. Phase 2 safety trial targeting amyloid beta production with a gamma-secretase inhibitor in Alzheimer disease. Arch Neurol. 65:1031–1038.
- Fowler KS, Saling MM, Conway EL, Semple JM, Louis WJ. 2002. Paired associate performance in the early detection of DAT. J Int Neuropsychol Soc. 8:58–71.
- Frank L, Lloyd A, Flynn JA, Kleinman L, Matza LS, Margolis MK, Bowman L, Bullock R. 2006. Impact of cognitive impairment on mild dementia patients and mild cognitive impairment patients and their informants. Int Psychogeriatr. 18:151–162.
- Frank RA, Galasko D, Hampel H, Hardy J, de Leon MJ, Mehta PD, Rogers J, Siemers E, Trojanowski JQ. 2003. Biological markers for therapeutic trials in Alzheimer’s disease. Proceedings of the biological markers working group; NIA initiative on neuroimaging in Alzheimer’s disease. Neurobiol Aging. 24:521–536.
- Fredriksson S, Gullberg M, Jarvius J, Olsson C, Pietras K, Gustafsdottir SM, Ostman A, Landegren U. 2002. Protein detection using proximity-dependent DNA ligation assays. Nat Biotechnol. 20:473–477.
- Furukawa T, Matsui N, Fujita K, Nodera H, Shimizu F, Miyamoto K, Takahashi Y, Kanda T, Kusunoki S, Izumi Y, et al. 2015. CSF cytokine profile distinguishes multifocal motor neuropathy from progressive muscular atrophy. Neurol (R) Neuroimmunol Neuroinflamm. 2:e138.
- Gabelle A, Roche S, Geny C, Bennys K, Labauge P, Tholance Y, Quadrio I, Tiers L, Gor B, Boulanghien J, et al. 2011. Decreased sAbetaPPbeta, Abeta38, and Abeta40 cerebrospinal fluid levels in frontotemporal dementia. J Alzheimer’s Dis. 26:553–563.
- Galasko D, Chang L, Motter R, Clark CM, Kaye J, Knopman D, Thomas R, Kholodenko D, Schenk D, Lieberburg I, et al. 1998. High cerebrospinal fluid tau and low amyloid beta42 levels in the clinical diagnosis of Alzheimer disease and relation to apolipoprotein E genotype. Arch Neurol. 55:937–945.
- Galasko DR, Graff-Radford N, May S, Hendrix S, Cottrell BA, Sagi SA, Mather G, Laughlin M, Zavitz KH, Swabb E, et al. 2007. Safety, tolerability, pharmacokinetics, and abeta levels after short-term administration of R-flurbiprofen in healthy elderly individuals. Alzheimer Dis Assoc Disord. 21:292–299.
- Ganesalingam J, An J, Shaw CE, Shaw G, Lacomis D, Bowser R. 2011. Combination of neurofilament heavy chain and complement C3 as CSF biomarkers for ALS. J Neurochem. 117:528–537.
- Gatz M, Pedersen NL, Berg S, Johansson B, Johansson K, Mortimer JA, Posner SF, Viitanen M, Winblad B, Ahlbom A. 1997. Heritability for Alzheimer’s disease: the study of dementia in Swedish twins. J Gerontol Ser A Biol Sci Med Sci. 52:M117–M125.
- Gatz M, Reynolds CA, Fratiglioni L, Johansson B, Mortimer JA, Berg S, Fiske A, Pedersen NL. 2006. Role of genes and environments for explaining Alzheimer disease. Arch Gener Psychiatry. 63:168–174.
- Gauthier S, Leuzy A, Racine E, Rosa-Neto P. 2013. Diagnosis and management of Alzheimer’s disease: past, present and future ethical issues. Progr Neurobiol. 110:102–113.
- Genin E, Hannequin D, Wallon D, Sleegers K, Hiltunen M, Combarros O, Bullido MJ, Engelborghs S, De Deyn P, Berr C, et al. 2011. APOE and Alzheimer disease: a major gene with semi-dominant inheritance. Mol Psychiatry. 16:903–907.
- Gerlach M, Maetzler W, Broich K, Hampel H, Rems L, Reum T, Riederer P, Stoffler A, Streffer J, Berg D. 2012. Biomarker candidates of neurodegeneration in Parkinson’s disease for the evaluation of disease-modifying therapeutics. J Neural Transm (Vienna). 119:39–52.
- Geschwind MD. 2016. Rapidly progressive dementia. Continuum (Minneapolis, Minn). 22:510–537.
- Ghidoni R, Benussi L, Glionna M, Franzoni M, Binetti G. 2008. Low plasma progranulin levels predict progranulin mutations in frontotemporal lobar degeneration. Neurology. 71:1235–1239.
- Gilman S, Koller M, Black RS, Jenkins L, Griffith SG, Fox NC, Eisner L, Kirby L, Rovira MB, Forette F, et al. 2005. Clinical effects of abeta immunization (AN1792) in patients with AD in an interrupted trial. Neurology. 64:1553–1562.
- Glodzik-Sobanska L, Rusinek H, Mosconi L, Li Y, Zhan J, de Santi S, Convit A, Rich K, Brys M, de Leon MJ. 2005. The role of quantitative structural imaging in the early diagnosis of Alzheimer’s disease. Neuroimag Clin North Am. 15:803–826.
- Glodzik L, Randall C, Rusinek H, de Leon MJ. 2013. Cerebrovascular reactivity to carbon dioxide in Alzheimer’s disease. J Alzheimers Dis. 35:427–440.
- Glodzik L, Sollberger M, Gass A, Gokhale A, Rusinek H, Babb JS, Hirsch JG, Amann M, Monsch AU, Gonen O. 2015. Global N-acetylaspartate in normal subjects, mild cognitive impairment and Alzheimer’s disease patients. J Alzheimers Dis. 43:939–947.
- Gmitterova K, Heinemann U, Bodemer M, Krasnianski A, Meissner B, Kretzschmar HA, Zerr I. 2009. 14-3-3 CSF levels in sporadic creutzfeldt-jakob disease differ across molecular subtypes. Neurobiol Aging. 30:1842–1850.
- Gmitterova K, Heinemann U, Krasnianski A, Gawinecka J, Zerr I. 2016. Cerebrospinal fluid markers in the differentiation of molecular subtypes of sporadic Creutzfeldt-Jakob disease. Eur J Neurol. 23:1126–1133.
- Goate A, Chartier-Harlin MC, Mullan M, Brown J, Crawford F, Fidani L, Giuffra L, Haynes A, Irving N, James L, et al. 1991. Segregation of a missense mutation in the amyloid precursor protein gene with familial Alzheimer’s disease. Nature. 349:704–706.
- Goetzl EJ, Boxer A, Schwartz JB, Abner EL, Petersen RC, Miller BL, Carlson OD, Mustapic M, Kapogiannis D. 2015a. Low neural exosomal levels of cellular survival factors in Alzheimer’s disease. Ann Clin Transl Neurol. 2:769–773.
- Goetzl EJ, Boxer A, Schwartz JB, Abner EL, Petersen RC, Miller BL, Kapogiannis D. 2015b. Altered lysosomal proteins in neural-derived plasma exosomes in preclinical Alzheimer disease. Neurology. 85:40–47.
- Goetzl EJ, Kapogiannis D, Schwartz JB, Lobach IV, Goetzl L, Abner EL, Jicha GA, Karydas AM, Boxer A, Miller BL. 2016. Decreased synaptic proteins in neuronal exosomes of frontotemporal dementia and Alzheimer’s disease. FASEB J. 30:4141–4148.
- Goetzl EJ, Mustapic M, Kapogiannis D, Eitan E, Lobach IV, Goetzl L, Schwartz JB, Miller BL. 2016. Cargo proteins of plasma astrocyte-derived exosomes in Alzheimer’s disease. FASEB J. 30:3853–3859.
- Gold LS, Klein G, Carr L, Kessler L, Sullivan SD. 2012. The emergence of diagnostic imaging technologies in breast cancer: discovery, regulatory approval, reimbursement, and adoption in clinical guidelines. Cancer Imaging. 12:13–24.
- Goldman JS, Hahn SE, Catania JW, LaRusse-Eckert S, Butson MB, Rumbaugh M, Strecker MN, Roberts JS, Burke W, Mayeux R, et al. 2011. Genetic counseling and testing for Alzheimer disease: joint practice guidelines of the American college of medical genetics and the national society of genetic counselors. Genet Med. 13:597–605.
- Goos JD, Kester MI, Barkhof F, Klein M, Blankenstein MA, Scheltens P, van der Flier WM. 2009. Patients with Alzheimer disease with multiple microbleeds: relation with cerebrospinal fluid biomarkers and cognition. Stroke. 40:3455–3460.
- Goos JD, Teunissen CE, Veerhuis R, Verwey NA, Barkhof F, Blankenstein MA, Scheltens P, van der Flier WM. 2012. Microbleeds relate to altered amyloid-beta metabolism in Alzheimer’s disease. Neurobiol Aging. 33:1011.e1011–1019.
- Gordon BA, Blazey T, Su Y, Fagan AM, Holtzman DM, Morris JC, Benzinger TL. 2016. Longitudinal beta-amyloid deposition and hippocampal volume in preclinical alzheimer disease and suspected non-Alzheimer disease pathophysiology. JAMA Neurol. 73:1192–1200.
- Gordon BA, Friedrichsen K, Brier M, Blazey T, Su Y, Christensen J, Aldea P, McConathy J, Holtzman DM, Cairns NJ, et al. 2016. The relationship between cerebrospinal fluid markers of Alzheimer pathology and positron emission tomography tau imaging. Brain. 139:2249–2260.
- Gorno-Tempini ML, Hillis AE, Weintraub S, Kertesz A, Mendez M, Cappa SF, Ogar JM, Rohrer JD, Black S, Boeve BF, et al. 2011. Classification of primary progressive aphasia and its variants. Neurology. 76:1006–1014.
- Grabowski TJ, Cho HS, Vonsattel JP, Rebeck GW, Greenberg SM. 2001. Novel amyloid precursor protein mutation in an Iowa family with dementia and severe cerebral amyloid angiopathy. Ann Neurol. 49:697–705.
- Graff-Radford NR, Crook JE, Lucas J, Boeve BF, Knopman DS, Ivnik RJ, Smith GE, Younkin LH, Petersen RC, Younkin SG. 2007. Association of low plasma abeta42/abeta40 ratios with increased imminent risk for mild cognitive impairment and Alzheimer disease. Arch Neurol. 64:354–362.
- Green RC, Roberts JS, Cupples LA, Relkin NR, Whitehouse PJ, Brown T, Eckert SL, Butson M, Sadovnick AD, Quaid KA, et al. 2009. Disclosure of APOE genotype for risk of Alzheimer’s disease. N Engl J Med. 361:245–254.
- Greenberg SM, Vonsattel JP. 1997. Diagnosis of cerebral amyloid angiopathy. Sensitivity and specificity of cortical biopsy. Stroke. 28:1418–1422.
- Grober E, Buschke H, Crystal H, Bang S, Dresner R. 1988. Screening for dementia by memory testing. Neurology. 38:900–903.
- Group F-NBW. 2016. BEST (Biomarkers, EndpointS, and other Tools) Resource. Maryland: Food and Drug Administration (US)/National Institutes of Health (US).
- Grundke-Iqbal I, Iqbal K, Tung YC, Quinlan M, Wisniewski HM, Binder LI. 1986. Abnormal phosphorylation of the microtubule-associated protein tau (tau) in Alzheimer cytoskeletal pathology. Proc Natl Acad Sci USA. 83:4913–4917.
- Guadano-Ferraz A, Vinuela A, Oeding G, Bernal J, Rausell E. 2005. RC3/neurogranin is expressed in pyramidal neurons of motor and somatosensory cortex in normal and denervated monkeys. J Compar Neurol. 493:554–570.
- Guerreiro R, Wojtas A, Bras J, Carrasquillo M, Rogaeva E, Majounie E, Cruchaga C, Sassi C, Kauwe JS, Younkin S, et al. 2013. TREM2 variants in Alzheimer’s disease. N Engl J Med. 368:117–127.
- Gunnarsson M, Malmestrom C, Axelsson M, Sundstrom P, Dahle C, Vrethem M, Olsson T, Piehl F, Norgren N, Rosengren L, et al. 2011. Axonal damage in relapsing multiple sclerosis is markedly reduced by natalizumab. Ann Neurol. 69:83–89.
- Guo S, Getsios D, Hernandez L, Cho K, Lawler E, Altincatal A, Lanes S, Blankenburg M. 2012. Florbetaben PET in the early diagnosis of Alzheimer’s disease: a discrete event simulation to explore its potential value and key data gaps. Int J Alzheimer’s Dis. 2012:548157.
- Gurol ME, Irizarry MC, Smith EE, Raju S, Diaz-Arrastia R, Bottiglieri T, Rosand J, Growdon JH, Greenberg SM. 2006. Plasma beta-amyloid and white matter lesions in AD, MCI, and cerebral amyloid angiopathy. Neurology. 66:23–29.
- Halbgebauer S, Ockl P, Wirth K, Steinacker P, Otto M. 2016. Protein biomarkers in Parkinson’s disease: focus on cerebrospinal fluid markers and synaptic proteins. Move Disord. 31:848–860.
- Hall S, Ohrfelt A, Constantinescu R, Andreasson U, Surova Y, Bostrom F, Nilsson C, Hakan W, Decraemer H, Nagga K, et al. 2012. Accuracy of a panel of 5 cerebrospinal fluid biomarkers in the differential diagnosis of patients with dementia and/or parkinsonian disorders. Arch Neurol. 69:1445–1452.
- Hamlett ED, Goetzl EJ, Ledreux A, Vasilevko V, Boger HA, LaRosa A, Clark D, Carroll SL, Carmona-Iragui M, Fortea J, et al. 2016. Neuronal exosomes reveal Alzheimer’s disease biomarkers in Down syndrome. Alzheimer’s Dementia. 13:541–549.
- Hampel H, Buerger K, Zinkowski R, Teipel SJ, Goernitz A, Andreasen N, Sjoegren M, DeBernardis J, Kerkman D, Ishiguro K, et al. 2004. Measurement of phosphorylated tau epitopes in the differential diagnosis of Alzheimer disease. A comparative cerebrospinal fluid study. Arch Gen Psychiatry. 61:95–102.
- Hampel H, Frank R, Broich K, Teipel SJ, Katz RG, Hardy J, Herholz K, Bokde AL, Jessen F, Hoessler YC, et al. 2010. Biomarkers for Alzheimer’s disease: academic, industry and regulatory perspectives. Nat Rev Drug Discov. 9:560–574.
- Hampel H, Lista S, Khachaturian ZS. 2012. Development of biomarkers to chart all Alzheimer’s disease stages: the royal road to cutting the therapeutic Gordian knot. Alzheimer’s Dementia. 8:312–336.
- Hampel H, Lista S, Teipel SJ, Garaci F, Nistico R, Blennow K, Zetterberg H, Bertram L, Duyckaerts C, Bakardjian H, et al. 2014. Perspective on future role of biological markers in clinical therapy trials of Alzheimer’s disease: a long-range point of view beyond 2020. Biochem Pharmacol. 88:426–449.
- Handels RL, Joore MA, Tran-Duy A, Wimo A, Wolfs CA, Verhey FR, Severens JL. 2015. Early cost-utility analysis of general and cerebrospinal fluid-specific Alzheimer’s disease biomarkers for hypothetical disease-modifying treatment decision in mild cognitive impairment. Alzheimer’s Dementia. 11:896–905.
- Handels RL, Joore MA, Vos SJ, Aalten P, Ramakers IH, Rikkert MO, Scheltens P, Jansen WJ, Visser PJ, van Berckel BM, et al. 2016. Added prognostic value of cerebrospinal fluid biomarkers in predicting decline in memory clinic patients in a prospective cohort. J Alzheimer’s Dis. 52:875–885.
- Handels RL, Wolfs CA, Aalten P, Joore MA, Verhey FR, Severens JL. 2014. Diagnosing Alzheimer’s disease: a systematic review of economic evaluations. Alzheimers Dement. 10:225–237.
- Hansson O, Hall S, Ohrfelt A, Zetterberg H, Blennow K, Minthon L, Nagga K, Londos E, Varghese S, Majbour NK, et al. 2014. Levels of cerebrospinal fluid alpha-synuclein oligomers are increased in Parkinson’s disease with dementia and dementia with Lewy bodies compared to Alzheimer’s disease. Alzheimer’s Res Ther. 6:25.
- Hansson O, Zetterberg H, Buchhave P, Andreasson U, Londos E, Minthon L, Blennow K. 2007. Prediction of Alzheimer’s disease using the CSF Abeta42/Abeta40 ratio in patients with mild cognitive impairment. Dement Geriatr Cogn Disord. 23:316–320.
- Hansson O, Zetterberg H, Buchhave P, Londos E, Blennow K, Minthon L. 2006. Association between CSF biomarkers and incipient Alzheimer’s disease in patients with mild cognitive impairment: a follow-up study. Lancet Neurol. 5:228–234.
- Hardy J, Singleton A. 2009. Genomewide association studies and human disease. N Engl J Med. 360:1759–1768.
- Harold D, Abraham R, Hollingworth P, Sims R, Gerrish A, Hamshere ML, Pahwa JS, Moskvina V, Dowzell K, Williams A, et al. 2009. Genome-wide association study identifies variants at CLU and PICALM associated with Alzheimer’s disease. Nat Genet. 41:1088–1093.
- Heilmann S, Drichel D, Clarimon J, Fernandez V, Lacour A, Wagner H, Thelen M, Hernandez I, Fortea J, Alegret M, et al. 2015. PLD3 in non-familial Alzheimer’s disease. Nature. 520:E3–E5.
- Heinemann U, Krasnianski A, Meissner B, Varges D, Kallenberg K, Schulz-Schaeffer WJ, Steinhoff BJ, Grasbon-Frodl EM, Kretzschmar HA, Zerr I. 2007. Creutzfeldt-Jakob disease in Germany: a prospective 12-year surveillance. Brain. 130:1350–1359.
- Henriksen K, O’Bryant SE, Hampel H, Trojanowski JQ, Montine TJ, Jeromin A, Blennow K, Lonneborg A, Wyss-Coray T, Soares H, et al. 2014. The future of blood-based biomarkers for Alzheimer’s disease. Alzheimer’s Dementia. 10:115–131.
- Herms J, Dorostkar MM. 2016. Dendritic spine pathology in neurodegenerative diseases. Annu Rev Pathol. 11:221–250.
- Hernandez-Guillamon M, Delgado P, Penalba A, Rodriguez-Luna D, Molina CA, Rovira A, Alvarez-Sabin J, Boada M, Montaner J. 2012. Plasma beta-amyloid levels in cerebral amyloid angiopathy-associated hemorrhagic stroke. Neuro-Degener Dis. 10:320–323.
- Heslegrave A, Heywood W, Paterson R, Magdalinou N, Svensson J, Johansson P, Ohrfelt A, Blennow K, Hardy J, Schott J, et al. 2016. Increased cerebrospinal fluid soluble TREM2 concentration in Alzheimer’s disease. Mol Neurodegener. 11:3.
- Hessen E, Nordlund A, Stalhammar J, Eckerstrom M, Bjerke M, Eckerstrom C, Gothlin M, Fladby T, Reinvang I, Wallin A. 2015. T-Tau is associated with objective memory decline over two years in persons seeking help for subjective cognitive decline: a report from the gothenburg-oslo MCI study. J Alzheimer’s Dis. 47:619–628.
- Hofman A, Ott A, Breteler MM, Bots ML, Slooter AJ, van Harskamp F, van Duijn CN, Van Broeckhoven C, Grobbee DE. 1997. Atherosclerosis, apolipoprotein E, and prevalence of dementia and Alzheimer’s disease in the rotterdam study. Lancet (London, England). 349:151–154.
- Hogan DB, Jette N, Fiest KM, Roberts JI, Pearson D, Smith EE, Roach P, Kirk A, Pringsheim T, Maxwell CJ. 2016. The Prevalence and incidence of frontotemporal dementia: a systematic review. Can J Neurol Sci. (Le Journal Canadien Des Sciences Neurologiques). 43(Suppl 1):S96–s109.
- Hoglund K, Kern S, Zettergren A, Borjesson-Hansson A, Zetterberg H, Skoog I, Blennow K, 2017. Preclinical amyloid pathology biomarker positivity: effects on tau pathology and neurodegeneration. Transl Psychiatry. 7:e995.
- Hollingworth P, Harold D, Sims R, Gerrish A, Lambert JC, Carrasquillo MM, Abraham R, Hamshere ML, Pahwa JS, Moskvina V, et al. 2011. Common variants at ABCA7, MS4A6A/MS4A4E, EPHA1, CD33 and CD2AP are associated with Alzheimer’s disease. Nat Genet. 43:429–435.
- Holtta M, Dean RA, Siemers E, Mawuenyega KG, Sigurdson W, May PC, Holtzman DM, Portelius E, Zetterberg H, Bateman RJ, et al. 2016. A single dose of the gamma-secretase inhibitor semagacestat alters the cerebrospinal fluid peptidome in humans. Alzheimer’s Res Ther. 8:11.
- Hong Z, Shi M, Chung KA, Quinn JF, Peskind ER, Galasko D, Jankovic J, Zabetian CP, Leverenz JB, Baird G, et al. 2010. DJ-1 and alpha-synuclein in human cerebrospinal fluid as biomarkers of Parkinson’s disease. Brain. 133:713–726.
- Horng HE, Yang SY, Hong C-Y, Liu CM, Tsai PS, Yang HC, Wu CC. 2006. Biofunctionalized magnetic nanoparticles for high-sensitivity immunomagnetic detection of human C-reactive protein. Appl Phys Lett. 88:252506.
- Houi K, Kobayashi T, Kato S, Mochio S, Inoue K. 2002. Increased plasma TGF-beta1 in patients with amyotrophic lateral sclerosis. Acta Neurol Scand. 106:299–301.
- Hu WT, Holtzman DM, Fagan AM, Shaw LM, Perrin R, Arnold SE, Grossman M, Xiong C, Craig-Schapiro R, Clark CM, et al. 2012. Plasma multianalyte profiling in mild cognitive impairment and Alzheimer disease. Neurology. 79:897–905.
- Hulstaert F, Blennow K, Ivanoiu A, Schoonderwaldt HC, Riemenschneider M, De Deyn PP, Bancher C, Cras P, Wiltfang J, Mehta PD, et al. 1999. Improved discrimination of AD patients using beta-amyloid(1-42) and tau levels in CSF. Neurology. 52:1555–1562.
- Humpel C. 2011. Identifying and validating biomarkers for Alzheimer’s disease. Trends Biotechnol. 29:26–32.
- Hye A, Riddoch-Contreras J, Baird AL, Ashton NJ, Bazenet C, Leung R, Westman E, Simmons A, Dobson R, Sattlecker M, et al. 2014. Plasma proteins predict conversion to dementia from prodromal disease. Alzheimer’s Dementia. 10:799–807.e792.
- Iliff JJ, Wang M, Liao Y, Plogg BA, Peng W, Gundersen GA, Benveniste H, Vates GE, Deane R, Goldman SA, et al. 2012. A paravascular pathway facilitates CSF flow through the brain parenchyma and the clearance of interstitial solutes, including amyloid beta. Sci Transl Med. 4:147ra111.
- Ilzecka J, Stelmasiak Z, Dobosz B. 2002. Transforming growth factor-Beta 1 (tgf-Beta 1) in patients with amyotrophic lateral sclerosis. Cytokine. 20:239–243.
- Imbimbo BP, Frigerio E, Breda M, Fiorentini F, Fernandez M, Sivilia S, Giardino L, Calza L, Norris D, Casula D, et al. 2013. Pharmacokinetics and pharmacodynamics of CHF5074 after short-term administration in healthy subjects. Alzheimer Dis Assoc Disord. 27:278–286.
- Ingelsson M, Fukumoto H, Newell KL, Growdon JH, Hedley-Whyte ET, Frosch MP, Albert MS, Hyman BT, Irizarry MC. 2004. Early abeta accumulation and progressive synaptic loss, gliosis, and tangle formation in AD brain. Neurology. 62:925–931.
- [IGAP] International Genomics of Alzheimer’s Disease Consortium. 2015. Convergent genetic and expression data implicate immunity in Alzheimer’s disease. Alzheimer’s Dementia. 11:658–671.
- Iqbal K, Grundke-Iqbal I, Zaidi T, Merz PA, Wen GY, Shaikh SS, Wisniewski HM, Alafuzoff I, Winblad B. 1986. Defective brain microtubule assembly in Alzheimer’s disease. Lancet (London, England). 2:421–426.
- Irwin DJ, Cairns NJ, Grossman M, McMillan CT, Lee EB, Van Deerlin VM, Lee VM, Trojanowski JQ. 2015. Frontotemporal lobar degeneration: defining phenotypic diversity through personalized medicine. Acta Neuropathol. 129:469–491.
- Irwin DJ, Grossman M, Weintraub D, Hurtig HI, Duda JE, Xie SX, Lee EB, Van Deerlin VM, Lopez OL, Kofler JK, et al. 2017. Neuropathological and genetic correlates of survival and dementia onset in synucleinopathies: a retrospective analysis. Lancet Neurol. 16:55–65.
- Irwin DJ, White MT, Toledo JB, Xie SX, Robinson JL, Van Deerlin V, Lee VM, Leverenz JB, Montine TJ, Duda JE, et al. 2012. Neuropathologic substrates of Parkinson disease dementia. Ann Neurol. 72:587–598.
- Ivanoiu A, Dricot L, Gilis N, Grandin C, Lhommel R, Quenon L, Hanseeuw B. 2015. Classification of non-demented patients attending a memory clinic using the new diagnostic criteria for Alzheimer’s disease with disease-related biomarkers. J Alzheimer’s Dis. 43:835–847.
- Jack CR. 2014. PART and SNAP. Acta Neuropathol. 128:773–776.
- Jack CR Jr, Albert MS, Knopman DS, McKhann GM, Sperling RA, Carrillo MC, Thies B, Phelps CH. 2011. Introduction to the recommendations from the national institute on aging-Alzheimer’s association workgroups on diagnostic guidelines for Alzheimer’s disease. Alzheimer’s Dementia. 7:257–262.
- Jack CR Jr, Bennett DA, Blennow K, Carrillo MC, Feldman HH, Frisoni GB, Hampel H, Jagust WJ, Johnson KA, Knopman DS, et al. 2016. A/T/N: an unbiased descriptive classification scheme for Alzheimer disease biomarkers. Neurology. 87:539–547.
- Jack CR Jr, Knopman DS, Jagust WJ, Petersen RC, Weiner MW, Aisen PS, Shaw LM, Vemuri P, Wiste HJ, Weigand SD, et al. 2013. Tracking pathophysiological processes in Alzheimer’s disease: an updated hypothetical model of dynamic biomarkers. Lancet Neurol. 12:207–216.
- Jack CR Jr, Knopman DS, Jagust WJ, Shaw LM, Aisen PS, Weiner MW, Petersen RC, Trojanowski JQ. 2010. Hypothetical model of dynamic biomarkers of the Alzheimer’s pathological cascade. Lancet Neurol. 119–128. 9.
- Jack CR Jr, Knopman DS, Weigand SD, Wiste HJ, Vemuri P, Lowe V, Kantarci K, Gunter JL, Senjem ML, Ivnik RJ, et al. 2012. An operational approach to national institute on aging-Alzheimer’s association criteria for preclinical Alzheimer disease. Ann Neurol. 71:765–775.
- Jack CR Jr, Lowe VJ, Weigand SD, Wiste HJ, Senjem ML, Knopman DS, Shiung MM, Gunter JL, Boeve BF, Kemp BJ, et al. 2009. Serial PIB and MRI in normal, mild cognitive impairment and Alzheimer’s disease: implications for sequence of pathological events in Alzheimer’s disease. Brain. 132:1355–1365.
- Jack CR Jr, Therneau TM, Wiste HJ, Weigand SD, Knopman DS, Lowe VJ, Mielke MM, Vemuri P, Roberts RO, Machulda MM, et al. 2016. Transition rates between amyloid and neurodegeneration biomarker states and to dementia: a population-based, longitudinal cohort study. Lancet Neurol. 15:56–64.
- Jack CR Jr, Wiste HJ, Knopman DS, Vemuri P, Mielke MM, Weigand SD, Senjem ML, Gunter JL, Lowe V, Gregg BE, et al. 2014. Rates of beta-amyloid accumulation are independent of hippocampal neurodegeneration. Neurology. 82:1605–1612.
- Jack CR Jr, Wiste HJ, Weigand SD, Knopman DS, Mielke MM, Vemuri P, Lowe V, Senjem ML, Gunter JL, Reyes D, et al. 2015. Different definitions of neurodegeneration produce similar amyloid/neurodegeneration biomarker group findings. Brain. 138:3747–3759.
- Jack CR Jr, Wiste HJ, Weigand SD, Rocca WA, Knopman DS, Mielke MM, Lowe VJ, Senjem ML, Gunter JL, Preboske GM, et al. 2014. Age-specific population frequencies of cerebral beta-amyloidosis and neurodegeneration among people with normal cognitive function aged 50-89 years: a cross-sectional study. Lancet Neurol. 13:997–1005.
- Jacobi C, Arlt S, Reiber H, Westner I, Kretzschmar HA, Poser S, Zerr I. 2005. Immunoglobulins and virus-specific antibodies in patients with Creutzfeldt-Jakob disease. Acta Neurol Scand. 111:185–190.
- Jacobsson J, Jonsson PA, Andersen PM, Forsgren L, Marklund SL. 2001. Superoxide dismutase in CSF from amyotrophic lateral sclerosis patients with and without CuZn-superoxide dismutase mutations. Brain. 124:1461–1466.
- Janelidze S, Hertze J, Zetterberg H, Landqvist Waldo M, Santillo A, Blennow K, Hansson O. 2016. Cerebrospinal fluid neurogranin and YKL-40 as biomarkers of Alzheimer’s disease. Ann Clin Transl Neurol. 3:12–20.
- Janelidze S, Zetterberg H, Mattsson N, Palmqvist S, Vanderstichele H, Lindberg O, van Westen D, Stomrud E, Minthon L, Blennow K, et al. 2016. CSF Abeta42/Abeta40 and Abeta42/Abeta38 ratios: better diagnostic markers of Alzheimer disease. Ann Clin Transl Neurol. 3:154–165.
- Jang H, Arce FT, Ramachandran S, Capone R, Azimova R, Kagan BL, Nussinov R, Lal R. 2010. Truncated beta-amyloid peptide channels provide an alternative mechanism for Alzheimer’s disease and down syndrome. Proc Natl Acad Sci USA. 107:6538–6543.
- Jansen WJ, Ossenkoppele R, Knol DL, Tijms BM, Scheltens P, Verhey FR, Visser PJ, Aalten P, Aarsland D, Alcolea D, et al. 2015. Prevalence of cerebral amyloid pathology in persons without dementia: a meta-analysis. JAMA. 313:1924–1938.
- Jedenius E, Wimo A, Stromqvist J, Jonsson L, Andreasen N. 2010. The cost of diagnosing dementia in a community setting. Int J Geriatr Psychiatry. 25:476–482.
- Jelic V, Kivipelto M, Winblad B. 2006. Clinical trials in mild cognitive impairment: lessons for the future. J Neurol Neurosurg Psychiatry. 77:429–438.
- Jellinger KA. 2014. Neuropathology of dementia disorders. J Alzheimers Dis Parkinson. 4:1–17.
- Jellinger KA, Attems J. 2015. Challenges of multimorbidity of the aging brain: a critical update. J Neural Transm (Vienna). 122:505–521.
- Jessen F, Amariglio RE, van Boxtel M, Breteler M, Ceccaldi M, Chetelat G, Dubois B, Dufouil C, Ellis KA, van der Flier WM, et al. 2014. A conceptual framework for research on subjective cognitive decline in preclinical Alzheimer’s disease. Alzheimer’s Dementia. 10:844–852.
- Jessen F, Lewczuk P, Gür O, Block W, Ende G, Frölich L, Hammen T, Arlt S, Kornhuber J, Kucinski T, et al. 2011. Association of N-acetylaspartate and cerebrospinal fluid Aβ42 in dementia. J Alzheimers Dis. 27:393–399.
- Jicha GA, Parisi JE, Dickson DW, Johnson K, Cha R, Ivnik RJ, Tangalos EG, Boeve BF, Knopman DS, Braak H, et al. 2006. Neuropathologic outcome of mild cognitive impairment following progression to clinical dementia. Arch Neurol. 63:674–681.
- Jimenez CR, Koel-Simmelink M, Pham TV, van der Voort L, Teunissen CE. 2007. Endogeneous peptide profiling of cerebrospinal fluid by MALDI-TOF mass spectrometry: optimization of magnetic bead-based peptide capture and analysis of preanalytical variables. PROTEOMICS Clin Appl. 1:1385–1392.
- Johnson KA, Fox NC, Sperling RA, Klunk WE. 2012. Brain imaging in Alzheimer disease. Cold Spring Harbor Perspect Med. 2:a006213.
- Johnson KA, Schultz A, Betensky RA, Becker JA, Sepulcre J, Rentz D, Mormino E, Chhatwal J, Amariglio R, Papp K, et al. 2016. Tau positron emission tomographic imaging in aging and early Alzheimer disease. Ann Neurol. 79:110–119.
- Johnson R, Harkins K, Cary M, Sankar P, Karlawish J. 2015. The relative contributions of disease label and disease prognosis to Alzheimer’s stigma: a vignette-based experiment. Social Sci Med (1982). 143:117–127.
- Jones L, Holmans PA, Hamshere ML, Harold D, Moskvina V, Ivanov D, Pocklington A, Abraham R, Hollingworth P, Sims R, et al. 2010. Genetic evidence implicates the immune system and cholesterol metabolism in the aetiology of Alzheimer’s disease. PLoS One. 5:e13950.
- Jonsson T, Stefansson H, Steinberg S, Jonsdottir I, Jonsson PV, Snaedal J, Bjornsson S, Huttenlocher J, Levey AI, Lah JJ, et al. 2013. Variant of TREM2 associated with the risk of Alzheimer’s disease. N Engl J Med. 368:107–116.
- Joosten-Weyn Banningh L, Vernooij-Dassen M, Rikkert MO, Teunisse JP. 2008. Mild cognitive impairment: coping with an uncertain label. Int J Geriatr Psychiatry. 23:148–154.
- Jorm AF, Jolley D. 1998. The incidence of dementia: a meta-analysis. Neurology. 51:728–733.
- Kaiser E, Schonknecht P, Thomann PA, Hunt A, Schroder J. 2007. Influence of delayed CSF storage on concentrations of phospho-tau protein (181), total tau protein and beta-amyloid (1-42). Neurosci Lett. 417:193–195.
- Kalaria RN. 2016. Neuropathological diagnosis of vascular cognitive impairment and vascular dementia with implications for Alzheimer’s disease. Acta Neuropathol. 131:659–685.
- Kaneko N, Nakamura A, Washimi Y, Kato T, Sakurai T, Arahata Y, Bundo M, Takeda A, Niida S, Ito K, et al. 2014. Novel plasma biomarker surrogating cerebral amyloid deposition. Proc Japan Acad Ser B Phys Biol Sci. 90:353–364.
- Kang J, Lemaire HG, Unterbeck A, Salbaum JM, Masters CL, Grzeschik KH, Multhaup G, Beyreuther K, Muller-Hill B. 1987. The precursor of Alzheimer’s disease amyloid A4 protein resembles a cell-surface receptor. Nature. 325:733–736.
- Kang JH, Irwin DJ, Chen-Plotkin AS, Siderowf A, Caspell C, Coffey CS, Waligorska T, Taylor P, Pan S, Frasier M, et al. 2013. Association of cerebrospinal fluid beta-amyloid 1-42, T-tau, P-tau181, and alpha-synuclein levels with clinical features of drug-naive patients with early Parkinson disease. JAMA Neurol. 70:1277–1287.
- Kang JH, Korecka M, Figurski MJ, Toledo JB, Blennow K, Zetterberg H, Waligorska T, Brylska M, Fields L, Shah N, et al. 2015. The Alzheimer’s disease neuroimaging initiative 2 biomarker core: a review of progress and plans. Alzheimer’s Dementia. 11:772–791.
- Kang JH, Mollenhauer B, Coffey CS, Toledo JB, Weintraub D, Galasko DR, Irwin DJ, Van Deerlin V, Chen-Plotkin AS, Caspell-Garcia C, et al. 2016. CSF biomarkers associated with disease heterogeneity in early Parkinson’s disease: the Parkinson’s Progression Markers Initiative study. Acta Neuropathol. 131:935–949.
- Kapogiannis D, Boxer A, Schwartz JB, Abner EL, Biragyn A, Masharani U, Frassetto L, Petersen RC, Miller BL, Goetzl EJ. 2015. Dysfunctionally phosphorylated type 1 insulin receptor substrate in neural-derived blood exosomes of preclinical Alzheimer’s disease. FASEB J. 29:589–596.
- Karch A, Hermann P, Ponto C, Schmitz M, Arora A, Zafar S, Llorens F, Muller-Heine A, Zerr I. 2015. Cerebrospinal fluid tau levels are a marker for molecular subtype in sporadic creutzfeldt-jakob disease. Neurobiol Aging. 36:1964–1968.
- Karczewska-Kupczewska M, Lelental N, Adamska A, Nikolajuk A, Kowalska I, Gorska M, Zimmermann R, Kornhuber J, Straczkowski M, Lewczuk P. 2013. The influence of insulin infusion on the metabolism of amyloid beta peptides in plasma. Alzheimer’s Dementia. 9:400–405.
- Kasai T, Tokuda T, Ishigami N, Sasayama H, Foulds P, Mitchell DJ, Mann DM, Allsop D, Nakagawa M. 2009. Increased TDP-43 protein in cerebrospinal fluid of patients with amyotrophic lateral sclerosis. Acta Neuropathol. 117:55–62.
- Keizman D, Ish-Shalom M, Berliner S, Maimon N, Vered Y, Artamonov I, Tsehori J, Nefussy B, Drory VE. 2009. Low uric acid levels in serum of patients with ALS: further evidence for oxidative stress? J Neurol Sci. 285:95–99.
- Kelley BJ, Boeve BF, Josephs KA. 2009. Cognitive and noncognitive neurological features of young-onset dementia. Dement Geriatr Cogn Disord. 27:564–571.
- Kester MI, Goos JD, Teunissen CE, Benedictus MR, Bouwman FH, Wattjes MP, Barkhof F, Scheltens P, van der Flier WM. 2014. Associations between cerebral small-vessel disease and Alzheimer disease pathology as measured by cerebrospinal fluid biomarkers. JAMA Neurol. 71:855–862.
- Kester MI, Teunissen CE, Crimmins DL, Herries EM, Ladenson JH, Scheltens P, van der Flier WM, Morris JC, Holtzman DM, Fagan AM. 2015. Neurogranin as a cerebrospinal fluid biomarker for synaptic loss in symptomatic Alzheimer disease. JAMA Neurol. 72:1275–1280.
- Kiernan MC, Vucic S, Cheah BC, Turner MR, Eisen A, Hardiman O, Burrell JR, Zoing MC. 2011. Amyotrophic lateral sclerosis. Lancet (London, England). 377:942–955.
- Kim SY, Karlawish J, Berkman BE. 2015. Ethics of genetic and biomarker test disclosures in neurodegenerative disease prevention trials. Neurology. 84:1488–1494.
- Kirkwood TB. 1977. Predicting the stability of biological standards and products. Biometrics. 33:736–742.
- Klafki H, Abramowski D, Swoboda R, Paganetti PA, Staufenbiel M. 1996. The carboxyl termini of beta-amyloid peptides 1-40 and 1-42 are generated by distinct gamma-secretase activities. J Biol Chem. 271:28655–28659.
- Klunk WE, Engler H, Nordberg A, Wang Y, Blomqvist G, Holt DP, Bergstrom M, Savitcheva I, Huang GF, Estrada S, et al. 2004. Imaging brain amyloid in Alzheimer’s disease with pittsburgh compound-B. Ann Neurol. 55:306–319.
- Klunk WE, Wang Y, Huang GF, Debnath ML, Holt DP, Shao L, Hamilton RL, Ikonomovic MD, DeKosky ST, Mathis CA. 2003. The binding of 2-(4’-methylaminophenyl)benzothiazole to postmortem brain homogenates is dominated by the amyloid component. J Neurosci. 23:2086–2092.
- Knapp M. 2015. The cost-effectiveness challenge: is it worth it? Alzheimer’s Res Ther. 7:10.
- Knopman DS, Jack CR Jr, Lundt ES, Weigand SD, Vemuri P, Lowe VJ, Kantarci K, Gunter JL, Senjem ML, Mielke MM, et al. 2016. Evolution of neurodegeneration-imaging biomarkers from clinically normal to dementia in the Alzheimer disease spectrum. Neurobiol Aging. 46:32–42.
- Knopman DS, Jack CR Jr, Wiste HJ, Weigand SD, Vemuri P, Lowe V, Kantarci K, Gunter JL, Senjem ML, Ivnik RJ, et al. 2012. Short-term clinical outcomes for stages of NIA-AA preclinical Alzheimer disease. Neurology. 78:1576–1582.
- Knopman DS, Parisi JE, Salviati A, Floriach-Robert M, Boeve BF, Ivnik RJ, Smith GE, Dickson DW, Johnson KA, Petersen LE, et al. 2003. Neuropathology of cognitively normal elderly. J Neuropathol Exp Neurol. 62:1087–1095.
- Koopman K, Le Bastard N, Martin JJ, Nagels G, De Deyn PP, Engelborghs S. 2009. Improved discrimination of autopsy-confirmed Alzheimer’s disease (AD) from non-AD dementias using CSF P-tau(181P). Neurochem Int. 55:214–218.
- Korecka M, Waligorska T, Figurski M, Toledo JB, Arnold SE, Grossman M, Trojanowski JQ, Shaw LM. 2014. Qualification of a surrogate matrix-based absolute quantification method for amyloid-beta(4)(2) in human cerebrospinal fluid using 2D UPLC-tandem mass spectrometry. J Alzheimer’s Dis. 41:441–451.
- Kornhuber J, Schmidtke K, Frölich L, Perneczky R, Wolf S, Hampel H, Jessen F, Heuser I, Peters O, Weih M, et al. 2009. Early and differential diagnosis of dementia and mild cognitive impairment: design and cohort baseline characteristics of the German dementia competence network. Dement Geriatr Cogn Disord. 27:404–417.
- Kovacs GG. 2016. Molecular pathological classification of neurodegenerative diseases: turning towards precision medicine. Int J Mol Sci. 17:E189.
- Kuhlmann J, Andreasson U, Pannee J, Bjerke M, Portelius E, Leinenbach A, Bittner T, Korecka M, Jenkins RG, Vanderstichele H, et al. 2016. CSF Abeta1-42 - an excellent but complicated Alzheimer’s biomarker - a route to standardisation. Clinica Chim Acta. 467:27–33.
- Kuntz KM, Kokmen E, Stevens JC, Miller P, Offord KP, Ho MM. 1992. Post-lumbar puncture headaches: experience in 501 consecutive procedures. Neurology. 42:1884–1887.
- Kvartsberg H, Duits FH, Ingelsson M, Andreasen N, Ohrfelt A, Andersson K, Brinkmalm G, Lannfelt L, Minthon L, Hansson O, et al. 2015. Cerebrospinal fluid levels of the synaptic protein neurogranin correlates with cognitive decline in prodromal Alzheimer’s disease. Alzheimer’s Dementia. 11:1180–1190.
- Kvartsberg H, Portelius E, Andreasson U, Brinkmalm G, Hellwig K, Lelental N, Kornhuber J, Hansson O, Minthon L, Spitzer P, et al. 2015. Characterization of the postsynaptic protein neurogranin in paired cerebrospinal fluid and plasma samples from Alzheimer’s disease patients and healthy controls. Alzheimer’s Res Ther. 7:40.
- Lacour A, Espinosa A, Louwersheimer E, Heilmann S, Hernandez I, Wolfsgruber S, Fernandez V, Wagner H, Rosende-Roca M, Mauleon A, et al. 2016. Genome-wide significant risk factors for Alzheimer’s disease: role in progression to dementia due to Alzheimer’s disease among subjects with mild cognitive impairment. Mol Psychiatry. 22:153–160.
- Lambert JC, Amouyel P. 2011. Genetics of Alzheimer’s disease: new evidences for an old hypothesis? Curr Opin Genet Dev. 21:295–301.
- Lambert JC, Heath S, Even G, Campion D, Sleegers K, Hiltunen M, Combarros O, Zelenika D, Bullido MJ, Tavernier B, et al. 2009. Genome-wide association study identifies variants at CLU and CR1 associated with Alzheimer’s disease. Nat Genet. 41:1094–1099.
- Lambert JC, Ibrahim-Verbaas CA, Harold D, Naj AC, Sims R, Bellenguez C, DeStafano AL, Bis JC, Beecham GW, Grenier-Boley B, et al. 2013. Meta-analysis of 74,046 individuals identifies 11 new susceptibility loci for Alzheimer’s disease. Nat Genet. 45:1452–1458.
- Landau SM, Lu M, Joshi AD, Pontecorvo M, Mintun MA, Trojanowski JQ, Shaw LM, Jagust WJ. 2013. Comparing positron emission tomography imaging and cerebrospinal fluid measurements of beta-amyloid. Ann Neurol. 74:826–836.
- Landen JW, Zhao Q, Cohen S, Borrie M, Woodward M, Billing CB Jr, Bales K, Alvey C, McCush F, Yang J, et al. 2013. Safety and pharmacology of a single intravenous dose of ponezumab in subjects with mild-to-moderate Alzheimer disease: a phase I, randomized, placebo-controlled, double-blind, dose-escalation study. Clin Neuropharmacol. 36:14–23.
- Landqvist Waldo M, Frizell Santillo A, Passant U, Zetterberg H, Rosengren L, Nilsson C, Englund E. 2013. Cerebrospinal fluid neurofilament light chain protein levels in subtypes of frontotemporal dementia. BMC Neurol. 13:54.
- Le Bastard N, Coart E, Vanderstichele H, Vanmechelen E, Martin JJ, Engelborghs S. 2013. Comparison of two analytical platforms for the clinical qualification of Alzheimer’s disease biomarkers in pathologically-confirmed dementia. J Alzheimer’s Dis. 33:117–131.
- Le Bastard N, De Deyn PP, Engelborghs S. 2015. Importance and impact of preanalytical variables on Alzheimer disease biomarker concentrations in cerebrospinal fluid. Clin Chem. 61:734–743.
- Le Bastard N, Martin JJ, Vanmechelen E, Vanderstichele H, De Deyn PP, Engelborghs S. 2010. Added diagnostic value of CSF biomarkers in differential dementia diagnosis. Neurobiol Aging. 31:1867–1876.
- Lebouvier T, Chaumette T, Damier P, Coron E, Touchefeu Y, Vrignaud S, Naveilhan P, Galmiche JP, Bruley des Varannes S, Derkinderen P, et al. 2008. Pathological lesions in colonic biopsies during Parkinson’s disease. Gut. 57:1741–1743.
- Lebouvier T, Neunlist M, Bruley des Varannes S, Coron E, Drouard A, N’Guyen JM, Chaumette T, Tasselli M, Paillusson S, Flamand M, et al. 2010. Colonic biopsies to assess the neuropathology of Parkinson’s disease and its relationship with symptoms. PLoS One. 5:e12728.
- Lee PH, Lee G, Park HJ, Bang OY, Joo IS, Huh K. 2006. The plasma alpha-synuclein levels in patients with Parkinson’s disease and multiple system atrophy. J Neural Transm. 113:1435–1439.
- Leinenbach A, Pannee J, Dulffer T, Huber A, Bittner T, Andreasson U, Gobom J, Zetterberg H, Kobold U, Portelius E, et al. 2014. Mass spectrometry-based candidate reference measurement procedure for quantification of amyloid-beta in cerebrospinal fluid. Clin Chem. 60:987–994.
- Leitao MJ, Baldeiras I, Almeida MR, Ribeiro MH, Santos AC, Ribeiro M, Tomas J, Rocha S, Santana I, Oliveira CR. 2016. Sporadic creutzfeldt-jakob disease diagnostic accuracy is improved by a new CSF ELISA 14-3-3gamma assay. Neuroscience. 322:398–407.
- Leitao MJ, Baldeiras I, Herukka SK, Pikkarainen M, Leinonen V, Simonsen AH, Perret-Liaudet A, Fourier A, Quadrio I, Veiga PM, et al. 2015. Chasing the effects of pre-analytical confounders – a multicenter study on CSF-AD biomarkers. Front Neurol. 6:153.
- Lelental N, Brandner S, Kofanova O, Blennow K, Zetterberg H, Andreasson U, Engelborghs S, Mroczko B, Gabryelewicz T, Teunissen C, et al. 2016. Comparison of different matrices as potential quality control samples for neurochemical dementia diagnostics. J Alzheimer’s Dis. 52:51–64.
- Levy E, Carman MD, Fernandez-Madrid IJ, Power MD, Lieberburg I, van Duinen SG, Bots GT, Luyendijk W, Frangione B. 1990. Mutation of the Alzheimer’s disease amyloid gene in hereditary cerebral hemorrhage, Dutch type. Science. 248:1124–1126.
- Lewczuk P, Beck G, Esselmann H, Bruckmoser R, Zimmermann R, Fiszer M, Bibl M, Maler JM, Kornhuber J, Wiltfang J. 2006. Effect of sample collection tubes on cerebrospinal fluid concentrations of tau proteins and amyloid beta peptides. Clin Chem. 52:332–334.
- Lewczuk P, Esselmann H, Groemer TW, Bibl M, Maler JM, Steinacker P, Otto M, Kornhuber J, Wiltfang J. 2004. Amyloid β peptides in cerebrospinal fluid as profiled with surface enhanced laser desorption/ionization time-of-flight mass spectrometry: evidence of novel biomarkers in Alzheimer’s disease. Biol Psychiatry. 55:524–530.
- Lewczuk P, Esselmann H, Meyer M, Wollscheid V, Neumann M, Otto M, Maler JM, Rüther E, Kornhuber J, Wiltfang J. 2003. The amyloid-β (Aβ) peptide pattern in cerebrospinal fluid in Alzheimer’s disease: evidence of a novel carboxyterminally elongated Aβ peptide. Rapid Commun Mass Spectrom. 17:1291–1296.
- Lewczuk P, Esselmann H, Otto M, Maler JM, Henkel AW, Henkel MK, Eikenberg O, Antz C, Krause WR, Reulbach U, et al. 2004. Neurochemical diagnosis of Alzheimer’s dementia by CSF Abeta42, Abeta42/Abeta40 ratio and total tau. Neurobiol Aging. 25:273–281.
- Lewczuk P, Kamrowski-Kruck H, Peters O, Heuser I, Jessen F, Popp J, Bürger K, Hampel H, Frölich L, Wolf S, et al. 2010. Soluble amyloid precursor proteins in the cerebrospinal fluid as novel potential biomarkers of Alzheimer’s disease: a multicenter study. Mol Psychiatry. 15:138–145.
- Lewczuk P, Kornhuber J. 2011. Neurochemical dementia diagnostics in Alzheimer’s disease: where are we now and where are we going? Expert Rev Proteom. 8:447–458.
- Lewczuk P, Kornhuber J, Toledo JB, Trojanowski JQ, Knapik-Czajka M, Peters O, Wiltfang J, Shaw LM. 2015. Validation of the erlangen score algorithm for the prediction of the development of dementia due to Alzheimer’s disease in pre-dementia subjects. J Alzheimer’s Dis. 48:433–441.
- Lewczuk P, Kornhuber J, Vanmechelen E, Peters O, Heuser I, Maier W, Jessen F, Bürger K, Hampel H, Frölich L, et al. 2010. Amyloid beta peptides in plasma in early diagnosis of Alzheimer’s disease: a multicenter study with multiplexing. Exp Neurol. 223:366–370.
- Lewczuk P, Kornhuber J, Wiltfang J. 2006. The German Competence Net Dementias: standard operating procedures for the neurochemical dementia diagnostics. J Neural Transm. 113:1075–1080.
- Lewczuk P, Lelental N, Spitzer P, Maler JM, Kornhuber J. 2015. Amyloid β 42/40 CSF concentration ratio in the diagnostics of Alzheimer’s Disease: validation of two novel assays. J Alzheimer’s Dis. 43:183–191.
- Lewczuk P, Matzen A, Blennow K, Parnetti L, Molinuevo JL, Eusebi P, Kornhuber J, Morris JC, Fagan AM. 2017. Cerebrospinal fluid Abeta42/40 corresponds better than Abeta42 to amyloid PET in Alzheimer’s disease. J Alzheimer’s Dis. 55:813–822.
- Lewczuk P, Popp J, Lelental N, Kölsch H, Maier W, Kornhuber J, Jessen F. 2012. Cerebrospinal fluid soluble amyloid-beta protein precursor as a potential novel biomarkers of Alzheimer’s disease. J Alzheimer’s Dis. 28:119–125.
- Lewczuk P, Wiltfang J. 2008. Neurochemical dementia diagnostics: state of the art and research perspectives. Proteomics. 8:1292–1301.
- Lewczuk P, Zimmermann R, Wiltfang J, Kornhuber J. 2009. Neurochemical dementia diagnostics: a simple algorithm for interpretation of the CSF biomarkers. J Neural Transm. 116:1163–1167.
- Li D, Misialek JR, Boerwinkle E, Gottesman RF, Sharrett AR, Mosley TH, Coresh J, Wruck LM, Knopman DS, Alonso A. 2016. Plasma phospholipids and prevalence of mild cognitive impairment and/or dementia in the ARIC neurocognitive study (ARIC-NCS). Alzheimer’s Dementia (Amsterdam, Netherlands). 3:73–82.
- Li QX, Mok SS, Laughton KM, McLean CA, Cappai R, Masters CL, Culvenor JG, Horne MK. 2007. Plasma alpha-synuclein is decreased in subjects with Parkinson’s disease. Exp Neurol. 204:583–588.
- Lichtenthaler SF, Beher D, Grimm HS, Wang R, Shearman MS, Masters CL, Beyreuther K. 2002. The intramembrane cleavage site of the amyloid precursor protein depends on the length of its transmembrane domain. Proc Natl Acad Sci USA. 99:1365–1370.
- Lijmer JG, Leeflang M, Bossuyt PM. 2009. Proposals for a phased evaluation of medical tests. Med Decision Making. 29:E13–E21.
- Lingler JH, Klunk WE. 2013. Disclosure of amyloid imaging results to research participants: has the time come? Alzheimer’s Dementia. 9:741–744.e742.
- Lingler JH, Nightingale MC, Erlen JA, Kane AL, Reynolds CF, 3rd, Schulz R, DeKosky ST. 2006. Making sense of mild cognitive impairment: a qualitative exploration of the patient’s experience. The Gerontologist. 46:791–800.
- Linn J, Halpin A, Demaerel P, Ruhland J, Giese AD, Dichgans M, van Buchem MA, Bruckmann H, Greenberg SM. 2010. Prevalence of superficial siderosis in patients with cerebral amyloid angiopathy. Neurology. 74:1346–1350.
- Lippi G, Chance JJ, Church S, Dazzi P, Fontana R, Giavarina D, Grankvist K, Huisman W, Kouri T, Palicka V, et al. 2011. Preanalytical quality improvement: from dream to reality. Clin Chem Lab Med. 49:1113–1126.
- Lista S, Faltraco F, Prvulovic D, Hampel H. 2013. Blood and plasma-based proteomic biomarker research in Alzheimer’s disease. Progr Neurobiol. 101-102:1–17.
- Lista S, Hampel H. 2016. Synaptic degeneration and neurogranin in the pathophysiology of Alzheimer’s disease. Expert Rev Neurother. 17:47–57.
- Lista S, Khachaturian ZS, Rujescu D, Garaci F, Dubois B, Hampel H. 2016. Application of systems theory in longitudinal studies on the origin and progression of Alzheimer’s disease. Methods Mol Biol (Clifton, NJ). 1303:49–67.
- Lista S, O’Bryant SE, Blennow K, Dubois B, Hugon J, Zetterberg H, Hampel H. 2015. Biomarkers in sporadic and familial Alzheimer’s disease. J Alzheimers Dis. 47:291–317.
- Litvan I, Agid Y, Calne D, Campbell G, Dubois B, Duvoisin RC, Goetz CG, Golbe LI, Grafman J, Growdon JH, et al. 1996. Clinical research criteria for the diagnosis of progressive supranuclear palsy (Steele-Richardson-Olszewski syndrome): report of the NINDS-SPSP international workshop. Neurology. 47:1–9.
- Liu CC, Kanekiyo T, Xu H, Bu G. 2013. Apolipoprotein E and Alzheimer disease: risk, mechanisms and therapy. Nature Rev Neurol. 9:106–118.
- Liu J, Gao L, Zang D. 2015. Elevated levels of IFN-gamma in CSF and serum of patients with amyotrophic lateral sclerosis. PLoS One. 10:e0136937.
- Lleo A, Cavedo E, Parnetti L, Vanderstichele H, Herukka SK, Andreasen N, Ghidoni R, Lewczuk P, Jeromin A, Winblad B, et al. 2015. Cerebrospinal fluid biomarkers in trials for Alzheimer and Parkinson diseases. Nature Rev Neurol. 11:41–55.
- Lleo A, Saura CA. 2011. gamma-secretase substrates and their implications for drug development in Alzheimer’s disease. Curr Topics Med Chem. 11:1513–1527.
- Lo RY, Hubbard AE, Shaw LM, Trojanowski JQ, Petersen RC, Aisen PS, Weiner MW, Jagust WJ. 2011. Longitudinal change of biomarkers in cognitive decline. Arch Neurol. 68:1257–1266.
- Louwersheimer E, Wolfsgruber S, Espinosa A, Lacour A, Heilmann-Heimbach S, Alegret M, Hernandez I, Rosende-Roca M, Tarraga L, Boada M, et al. 2016. Alzheimer’s disease risk variants modulate endophenotypes in mild cognitive impairment. Alzheimer’s Dementia. 12:872–881.
- Lowndes GJ, Saling MM, Ames D, Chiu E, Gonzalez LM, Savage GR. 2008. Recall and recognition of verbal paired associates in early Alzheimer’s disease. J Int Neuropsycholo Soc. 14:591–600.
- Lu CH, Macdonald-Wallis C, Gray E, Pearce N, Petzold A, Norgren N, Giovannoni G, Fratta P, Sidle K, Fish M, et al. 2015. Neurofilament light chain: a prognostic biomarker in amyotrophic lateral sclerosis. Neurology. 84:2247–2257.
- Lu CH, Petzold A, Topping J, Allen K, Macdonald-Wallis C, Clarke J, Pearce N, Kuhle J, Giovannoni G, Fratta P, et al. 2015. Plasma neurofilament heavy chain levels and disease progression in amyotrophic lateral sclerosis: insights from a longitudinal study. J Neurol Neurosurg Psychiatry. 86:565–573.
- Luchsinger JA, Reitz C, Honig LS, Tang MX, Shea S, Mayeux R. 2005. Aggregation of vascular risk factors and risk of incident Alzheimer disease. Neurology. 65:545–551.
- Lundberg M, Thorsen SB, Assarsson E, Villablanca A, Tran B, Gee N, Knowles M, Nielsen BS, Gonzalez Couto E, Martin R, et al. 2011. Multiplexed homogeneous proximity ligation assays for high-throughput protein biomarker research in serological material. Mol Cell Proteom. 10:M110.004978.
- Mackenzie IRA, Bigio EH, Ince PG, Geser F, Neumann M, Cairns NJ, Kwong LK, Forman MS, Ravits J, Stewart H, et al. 2007. Pathological TDP-43 distinguishes sporadic amyotrophic lateral sclerosis from amyotrophic lateral sclerosis with SOD1 mutations. Ann Neurol. 61:427–434.
- Magdalinou NK, Paterson RW, Schott JM, Fox NC, Mummery C, Blennow K, Bhatia K, Morris HR, Giunti P, Warner TT, et al. 2015. A panel of nine cerebrospinal fluid biomarkers may identify patients with atypical parkinsonian syndromes. J Neurol Neurosurg Psychiatry. 86:1240–1247.
- Majbour NK, Vaikath NN, van Dijk KD, Ardah MT, Varghese S, Vesterager LB, Montezinho LP, Poole S, Safieh-Garabedian B, Tokuda T, et al. 2016. Oligomeric and phosphorylated alpha-synuclein as potential CSF biomarkers for Parkinson’s disease. Mol Neurodegener. 11:7.
- Mandelkow E, von Bergen M, Biernat J, Mandelkow EM. 2007. Structural principles of tau and the paired helical filaments of Alzheimer’s disease. Brain Pathol. 17:83–90.
- Mapstone M, Cheema AK, Fiandaca MS, Zhong X, Mhyre TR, MacArthur LH, Hall WJ, Fisher SG, Peterson DR, Haley JM, et al. 2014. Plasma phospholipids identify antecedent memory impairment in older adults. Nature Med. 20:415–418.
- Mathis CA, Mason NS, Lopresti BJ, Klunk WE. 2012. Development of positron emission tomography beta-amyloid plaque imaging agents. Semin Nuclear Med. 42:423–432.
- Matthews F, Brayne C. 2005. The incidence of dementia in England and Wales: findings from the five identical sites of the MRC CFA study. PLoS Med. 2:e193.
- Mattsson N, Andreasson U, Persson S, Arai H, Batish SD, Bernardini S, Bocchio-Chiavetto L, Blankenstein MA, Carrillo MC, Chalbot S, et al. 2011. The Alzheimer’s Association external quality control program for cerebrospinal fluid biomarkers. Alzheimer’s Dementia. 7:386–395.e386.
- Mattsson N, Andreasson U, Persson S, Carrillo MC, Collins S, Chalbot S, Cutler N, Dufour-Rainfray D, Fagan AM, Heegaard NH, et al. 2013. CSF biomarker variability in the Alzheimer’s association quality control program. Alzheimer’s Dementia. 9:251–261.
- Mattsson N, Carrillo MC, Dean RA, Devous MD, Sr., Nikolcheva T, Pesini P, Salter H, Potter WZ, Sperling RS, Bateman RJ, et al. 2015. Revolutionizing Alzheimer’s disease and clinical trials through biomarkers. Alzheimer’s Dementia (Amsterdam, Netherlands). 1:412–419.
- Mattsson N, Insel PS, Donohue M, Jagust W, Sperling R, Aisen P, Weiner MW. 2015. Predicting reduction of cerebrospinal fluid β-amyloid 42 in cognitively healthy controls. JAMA Neurol. 72:554–560.
- Mattsson N, Portelius E, Rolstad S, Gustavsson M, Andreasson U, Stridsberg M, Wallin A, Blennow K, Zetterberg H. 2012. Longitudinal cerebrospinal fluid biomarkers over four years in mild cognitive impairment. J Alzheimer’s Dis. 30:767–778.
- Mattsson N, Rajendran L, Zetterberg H, Gustavsson M, Andreasson U, Olsson M, Brinkmalm G, Lundkvist J, Jacobson LH, Perrot L, et al. 2012. BACE1 inhibition induces a specific cerebrospinal fluid beta-amyloid pattern that identifies drug effects in the central nervous system. PLoS One. 7:e31084.
- Mattsson N, Zetterberg H, Hansson O, Andreasen N, Parnetti L, Jonsson M, Herukka SK, van der Flier WM, Blankenstein MA, Ewers M, et al. 2009. CSF biomarkers and incipient Alzheimer disease in patients with mild cognitive impairment. JAMA. 302:385–393.
- Mawal-Dewan M, Henley J, Van de Voorde A, Trojanowski JQ, Lee VM. 1994. The phosphorylation state of tau in the developing rat brain is regulated by phosphoprotein phosphatases. J Biol Chem. 269:30981–30987.
- May PC, Willis BA, Lowe SL, Dean RA, Monk SA, Cocke PJ, Audia JE, Boggs LN, Borders AR, Brier RA, et al. 2015. The potent BACE1 inhibitor LY2886721 elicits robust central abeta pharmacodynamic responses in mice, dogs, and humans. J Neurosci. 35:1199–1210.
- McGuire LI, Peden AH, Orru CD, Wilham JM, Appleford NE, Mallinson G, Andrews M, Head MW, Caughey B, Will RG, et al. 2012. Real time quaking-induced conversion analysis of cerebrospinal fluid in sporadic Creutzfeldt-Jakob disease. Ann Neurol. 72:278–285.
- McKhann G, Drachman D, Folstein M, Katzman R, Price D, Stadlan EM. 1984. Clinical diagnosis of Alzheimer’s disease: report of the NINCDS-ADRDA work group under the auspices of department of health and human services task force on Alzheimer’s disease. Neurology. 34:939–944.
- McKhann GM, Knopman DS, Chertkow H, Hyman BT, Jack CR Jr, Kawas CH, Klunk WE, Koroshetz WJ, Manly JJ, Mayeux R, et al. 2011. The diagnosis of dementia due to Alzheimer’s disease: recommendations from the national institute on aging-Alzheimer’s association workgroups on diagnostic guidelines for Alzheimer’s disease. Alzheimer’s Dementia. 7:263–269.
- Medina M, Avila J. 2014. New perspectives on the role of tau in Alzheimer’s disease. Implications for therapy. Biochem Pharmacol. 88:540–547.
- Meeter LH, Dopper EG, Jiskoot LC, Sanchez-Valle R, Graff C, Benussi L, Ghidoni R, Pijnenburg YA, Borroni B, Galimberti D, et al. 2016. Neurofilament light chain: a biomarker for genetic frontotemporal dementia. Ann Clin Transl Neurol. 3:623–636.
- Meijs AP, Claassen JA, Rikkert MG, Schalk BW, Meulenbroek O, Kessels RP, Melis RJ. 2015. How does additional diagnostic testing influence the initial diagnosis in patients with cognitive complaints in a memory clinic setting? Age Ageing. 44:72–77.
- Menke RA, Gray E, Lu CH, Kuhle J, Talbot K, Malaspina A, Turner MR. 2015. CSF neurofilament light chain reflects corticospinal tract degeneration in ALS. Ann Clin Transl Neurol 2:748–755.
- Michaelson DM. 2014. APOE epsilon4: the most prevalent yet understudied risk factor for Alzheimer’s disease. Alzheimer’s Dementia. 10:861–868.
- Miners JS, Barua N, Kehoe PG, Gill S, Love S. 2011. Abeta-degrading enzymes: potential for treatment of Alzheimer disease. J Neuropathol Exp Neurol. 70:944–959.
- Mitchell AJ, Beaumont H, Ferguson D, Yadegarfar M, Stubbs B. 2014. Risk of dementia and mild cognitive impairment in older people with subjective memory complaints: meta-analysis. Acta Psychiatrica Scand. 130:439–451.
- Mitchell RM, Freeman WM, Randazzo WT, Stephens HE, Beard JL, Simmons Z, Connor JR. 2009. A CSF biomarker panel for identification of patients with amyotrophic lateral sclerosis. Neurology. 72:14–19.
- Mitchell RM, Simmons Z, Beard JL, Stephens HE, Connor JR. 2010. Plasma biomarkers associated with ALS and their relationship to iron homeostasis. Muscle Nerve. 42:95–103.
- Miyoshi I, Fujimoto Y, Yamada M, Abe S, Zhao Q, Cronenberger C, Togo K, Ishibashi T, Bednar MM, Kupiec JW, et al. 2013. Safety and pharmacokinetics of PF-04360365 following a single-dose intravenous infusion in Japanese subjects with mild-to-moderate Alzheimer’s disease: a multicenter, randomized, double-blind, placebo-controlled, dose-escalation study. Int J Clin Pharmacol Ther. 51:911–923.
- Moghekar A, Goh J, Li M, Albert M, O’Brien RJ. 2012. Cerebrospinal fluid Abeta and tau level fluctuation in an older clinical cohort. Arch Neurol. 69:246–250.
- Molinuevo JL, Blennow K, Dubois B, Engelborghs S, Lewczuk P, Perret-Liaudet A, Teunissen CE, Parnetti L. 2014. The clinical use of cerebrospinal fluid biomarker testing for Alzheimer’s disease diagnosis: a consensus paper from the Alzheimer’s biomarkers standardization initiative. Alzheimer’s Dementia. 10:808–817.
- Molinuevo JL, Cami J, Carne X, Carrillo MC, Georges J, Isaac MB, Khachaturian Z, Kim SY, Morris JC, Pasquier F, et al. 2016. Ethical challenges in preclinical Alzheimer’s disease observational studies and trials: results of the barcelona summit. Alzheimer’s Dementia. 12:614–622.
- Mollenhauer B, Cullen V, Kahn I, Krastins B, Outeiro TF, Pepivani I, Ng J, Schulz-Schaeffer W, Kretzschmar HA, McLean PJ, et al. 2008. Direct quantification of CSF alpha-synuclein by ELISA and first cross-sectional study in patients with neurodegeneration. Exp Neurol. 213:315–325.
- Mollenhauer B, Locascio JJ, Schulz-Schaeffer W, Sixel-Doring F, Trenkwalder C, Schlossmacher MG. 2011. alpha-Synuclein and tau concentrations in cerebrospinal fluid of patients presenting with parkinsonism: a cohort study. Lancet Neurol. 10:230–240.
- Mollenhauer B, Parnetti L, Rektorova I, Kramberger MG, Pikkarainen M, Schulz-Schaeffer WJ, Aarsland D, Svenningsson P, Farotti L, Verbeek MM, et al. 2016. Biological confounders for the values of cerebrospinal fluid proteins in Parkinson’s disease and related disorders. J Neurochem./ 139(Suppl 1):290–317.
- Mollenhauer B, Trautmann E, Otte B, Ng J, Spreer A, Lange P, Sixel-Doring F, Hakimi M, Vonsattel JP, Nussbaum R, et al. 2012. Alpha-Synuclein in human cerebrospinal fluid is principally derived from neurons of the central nervous system. J Neural Transm. 119:739–746.
- Montine TJ, Phelps CH, Beach TG, Bigio EH, Cairns NJ, Dickson DW, Duyckaerts C, Frosch MP, Masliah E, Mirra SS, et al. 2012. National institute on aging-Alzheimer’s association guidelines for the neuropathologic assessment of Alzheimer’s disease: a practical approach. Acta Neuropathol. 123:1–11.
- Morgen K, Frolich L, Tost H, Plichta MM, Kolsch H, Rakebrandt F, Rienhoff O, Jessen F, Peters O, Jahn H, et al. 2013. APOE-dependent phenotypes in subjects with mild cognitive impairment converting to Alzheimer’s disease. J Alzheimer’s Dis. 37:389–401.
- Mormino EC, Betensky RA, Hedden T, Schultz AP, Amariglio RE, Rentz DM, Johnson KA, Sperling RA. 2014. Synergistic effect of beta-amyloid and neurodegeneration on cognitive decline in clinically normal individuals. JAMA Neurol. 71:1379–1385.
- Mormino EC, Papp KV, Rentz DM, Schultz AP, LaPoint M, Amariglio R, Hanseeuw B, Marshall GA, Hedden T, Johnson KA, et al. 2016. Heterogeneity in suspected non-Alzheimer disease pathophysiology among clinically normal older individuals. JAMA Neurol. 73:1185–1191.
- Mormont E, Jamart J, Robaye L. 2012. Validity of the five-word test for the evaluation of verbal episodic memory and dementia in a memory clinic setting. J Geriatr Psychiatry Neurol. 25:78–84.
- Morris E, Chalkidou A, Hammers A, Peacock J, Summers J, Keevil S. 2016. Diagnostic accuracy of (18)F amyloid PET tracers for the diagnosis of Alzheimer’s disease: a systematic review and meta-analysis. Eur J Nuclear Med Mol Imag. 43:374–385.
- Morris JC, Roe CM, Xiong C, Fagan AM, Goate AM, Holtzman DM, Mintun MA. 2010. APOE predicts amyloid-beta but not tau Alzheimer pathology in cognitively normal aging. Ann Neurol. 67:122–131.
- Mosconi L. 2005. Brain glucose metabolism in the early and specific diagnosis of Alzheimer’s disease. FDG-PET studies in MCI and AD. Eur J Nuclear Med Mol Imag. 32:486–510.
- Mosconi L, De Santi S, Li J, Tsui WH, Li Y, Boppana M, Laska E, Rusinek H, de Leon MJ. 2008. Hippocampal hypometabolism predicts cognitive decline from normal aging. Neurobiol Aging. 29:676–692.
- Mosconi L, Tsui WH, De Santi S, Li J, Rusinek H, Convit A, Li Y, Boppana M, de Leon MJ. 2005. Reduced hippocampal metabolism in MCI and AD: automated FDG-PET image analysis. Neurology. 64:1860–1867.
- Motter R, Vigo-Pelfrey C, Kholodenko D, Barbour R, Johnson-Wood K, Galasko D, Chang L, Miller B, Clark C, Green R, et al. 1995. Reduction of beta-amyloid peptide42 in the cerebrospinal fluid of patients with Alzheimer’s disease. Ann Neurol. 38:643–648.
- Mroczko B, Groblewska M, Zboch M, Kulczynska A, Koper OM, Szmitkowski M, Kornhuber J, Lewczuk P. 2014. Concentrations of matrix metalloproteinases and their tissue inhibitors in the cerebrospinal fluid of patients with Alzheimer’s disease. J Alzheimer’s Dis. 40:351–357.
- Mroczko B, Groblewska M, Zboch M, Muszynski P, Zajkowska A, Borawska R, Szmitkowski M, Kornhuber J, Lewczuk P. 2015. Evaluation of visinin-like protein 1 concentrations in the cerebrospinal fluid of patients with mild cognitive impairment as a dynamic biomarker of Alzheimer’s disease. J Alzheimer’s Dis. 43:1031–1037.
- Mullan M, Crawford F, Axelman K, Houlden H, Lilius L, Winblad B, Lannfelt L. 1992. A pathogenic mutation for probable Alzheimer’s disease in the APP gene at the N-terminus of beta-amyloid. Nat Genet. 1:345–347.
- Murray ME, Graff-Radford NR, Ross OA, Petersen RC, Duara R, Dickson DW. 2011. Neuropathologically defined subtypes of Alzheimer’s disease with distinct clinical characteristics: a retrospective study. Lancet Neurol. 10:785–796.
- Nagele E, Han M, Demarshall C, Belinka B, Nagele R. 2011. Diagnosis of Alzheimer’s disease based on disease-specific autoantibody profiles in human sera. PLoS One. 6:e23112.
- Naj AC, Jun G, Beecham GW, Wang LS, Vardarajan BN, Buros J, Gallins PJ, Buxbaum JD, Jarvik GP, Crane PK, et al. 2011. Common variants at MS4A4/MS4A6E, CD2AP, CD33 and EPHA1 are associated with late-onset Alzheimer’s disease. Nat Genet. 43:436–441.
- Nelson PT, Head E, Schmitt FA, Davis PR, Neltner JH, Jicha GA, Abner EL, Smith CD, Van Eldik LJ, Kryscio RJ, et al. 2011. Alzheimer’s disease is not “brain aging”: neuropathological, genetic, and epidemiological human studies. Acta Neuropathol. 121:571–587.
- Niemantsverdriet E, Goossens J, Struyfs H, Martin JJ, Goeman J, De Deyn PP, Vanderstichele H, Engelborghs S. 2016. Diagnostic impact of cerebrospinal fluid biomarker (Pre-)analytical variability in Alzheimer’s disease. J Alzheimer’s Dis. 51:97–106.
- Noel-Storr AH, Flicker L, Ritchie CW, Nguyen GH, Gupta T, Wood P, Walton J, Desai M, Solomon DF, Molena E, et al. 2013. Systematic review of the body of evidence for the use of biomarkers in the diagnosis of dementia. Alzheimer’s Dementia. 9:e96–e105.
- Noto Y, Shibuya K, Sato Y, Kanai K, Misawa S, Sawai S, Mori M, Uchiyama T, Isose S, Nasu S, et al. 2011. Elevated CSF TDP-43 levels in amyotrophic lateral sclerosis: specificity, sensitivity, and a possible prognostic value. Amyotrophic Lateral Scler. 12:140–143.
- Noyce AJ, Bestwick JP, Silveira-Moriyama L, Hawkes CH, Giovannoni G, Lees AJ, Schrag A. 2012. Meta-analysis of early nonmotor features and risk factors for Parkinson disease. Ann Neurol. 72:893–901.
- O’Brien JT, Thomas A. 2015. Vascular dementia. Lancet (London, England). 386:1698–1706.
- O’Bryant SE, Edwards M, Johnson L, Hall J, Villarreal AE, Britton GB, Quiceno M, Cullum CM, Graff-Radford NR. 2016. A blood screening test for Alzheimer’s disease. Alzheimer’s Dementia (Amsterdam, Netherlands). 3:83–90.
- O’Bryant SE, Gupta V, Henriksen K, Edwards M, Jeromin A, Lista S, Bazenet C, Soares H, Lovestone S, Hampel H, et al. 2015. Guidelines for the standardization of preanalytic variables for blood-based biomarker studies in Alzheimer’s disease research. Alzheimer’s Dementia. 11:549–560.
- O’Bryant SE, Lista S, Rissman RA, Edwards M, Zhang F, Hall J, Zetterberg H, Lovestone S, Gupta V, Graff-Radford N, et al. 2016. Comparing biological markers of Alzheimer’s disease across blood fraction and platforms: comparing apples to oranges. Alzheimer’s Dementia (Amsterdam, Netherlands). 3:27–34.
- O’Bryant SE, Mielke MM, Rissman RA, Lista S, Vanderstichele H, Zetterberg H, Lewczuk P, Posner H, Hall J, Johnson L, et al. 2017. Blood-based biomarkers in Alzheimer disease: current state of the science and a novel collaborative paradigm for advancing from discovery to clinic. Alzheimer’s Dementia. 13:45–58.
- O’Bryant SE, Xiao G, Barber R, Huebinger R, Wilhelmsen K, Edwards M, Graff-Radford N, Doody R, Diaz-Arrastia R. 2011a. A blood-based screening tool for Alzheimer’s disease that spans serum and plasma: findings from TARC and ADNI. PLoS One. 6:e28092.
- O’Bryant SE, Xiao G, Barber R, Reisch J, Doody R, Fairchild T, Adams P, Waring S, Diaz-Arrastia R. 2010. A serum protein-based algorithm for the detection of Alzheimer disease. Arch Neurol. 67:1077–1081.
- O’Bryant SE, Xiao G, Barber R, Reisch J, Hall J, Cullum CM, Doody R, Fairchild T, Adams P, Wilhelmsen K, et al. 2011b. A blood-based algorithm for the detection of Alzheimer’s disease. Dement Geriatr Cogn Disord. 32:55–62.
- O’Bryant SE, Xiao G, Edwards M, Devous M, Gupta VB, Martins R, Zhang F, Barber R. 2013. Biomarkers of Alzheimer’s disease among Mexican Americans. J Alzheimer’s Dis. 34:841–849.
- O’Bryant SE, Xiao G, Zhang F, Edwards M, German DC, Yin X, Como T, Reisch J, Huebinger RM, Graff-Radford N, et al. 2014. Validation of a serum screen for Alzheimer’s disease across assay platforms, species, and tissues. J Alzheimer’s Dis. 42:1325–1335.
- Oeckl P, Metzger F, Nagl M, von Arnim CA, Halbgebauer S, Steinacker P, Ludolph AC, Otto M. 2016. Alpha-, Beta-, and gamma-synuclein quantification in cerebrospinal fluid by multiple reaction monitoring reveals increased concentrations in alzheimer’s and creutzfeldt-jakob disease but no alteration in synucleinopathies. Mol Cell Proteom. 15:3126–3138.
- Oeckl P, Steinacker P, Feneberg E, Otto M. 2015. Cerebrospinal fluid proteomics and protein biomarkers in frontotemporal lobar degeneration: current status and future perspectives. Biochim Biophys Acta. 1854:757–768.
- Oeckl P, Steinacker P, Feneberg E, Otto M. 2016. Neurochemical biomarkers in the diagnosis of frontotemporal lobar degeneration: an update. J Neurochem. 138(Suppl 1):184–192.
- Oeckl P, Steinacker P, von Arnim CA, Straub S, Nagl M, Feneberg E, Weishaupt JH, Ludolph AC, Otto M. 2014. Intact protein analysis of ubiquitin in cerebrospinal fluid by multiple reaction monitoring reveals differences in Alzheimer’s disease and frontotemporal lobar degeneration. J Proteome Res. 13:4518–4525.
- Oh SI, Baek S, Park JS, Piao L, Oh KW, Kim SH. 2015. Prognostic role of serum levels of uric acid in amyotrophic lateral sclerosis. J Clin Neurol (Seoul, Korea). 11:376–382.
- Okamura N, Harada R, Furukawa K, Furumoto S, Tago T, Yanai K, Arai H, Kudo Y. 2016. Advances in the development of tau PET radiotracers and their clinical applications. Ageing Res Rev. 30:107–113.
- Olsson B, Constantinescu R, Holmberg B, Andreasen N, Blennow K, Zetterberg H. 2013. The glial marker YKL-40 is decreased in synucleinopathies. Move Disord. 28:1882–1885.
- Olsson B, Lautner R, Andreasson U, Ohrfelt A, Portelius E, Bjerke M, Holtta M, Rosen C, Olsson C, Strobel G, et al. 2016. CSF and blood biomarkers for the diagnosis of Alzheimer’s disease: a systematic review and meta-analysis. Lancet Neurol. 15:673–684.
- Ossenkoppele R, Jansen WJ, Rabinovici GD, Knol DL, van der Flier WM, van Berckel BN, Scheltens P, Visser PJ, Verfaillie SC, Zwan MD, et al. 2015. Prevalence of amyloid PET positivity in dementia syndromes: a meta-analysis. JAMA. 313:1939–1949.
- Ott A, Breteler MM, van Harskamp F, Claus JJ, van der Cammen TJ, Grobbee DE, Hofman A. 1995. Prevalence of Alzheimer’s disease and vascular dementia: association with education. The rotterdam study. BMJ (Clinical Research Ed). 310:970–973.
- Pakpoor J, Seminog OO, Ramagopalan SV, Goldacre MJ. 2015. Clinical associations between gout and multiple sclerosis, Parkinson’s disease and motor neuron disease: record-linkage studies. BMC Neurol. 15:16.
- Palmqvist S, Mattsson N, Hansson O. 2016. Cerebrospinal fluid analysis detects cerebral amyloid-beta accumulation earlier than positron emission tomography. Brain. 139:1226–1236.
- Panegyres PK. 1997. The amyloid precursor protein gene: a neuropeptide gene with diverse functions in the central nervous system. Neuropeptides. 31:523–535.
- Pannee J, Gobom J, Shaw LM, Korecka M, Chambers EE, Lame M, Jenkins R, Mylott W, Carrillo MC, Zegers I, et al. 2016. Round robin test on quantification of amyloid-beta 1-42 in cerebrospinal fluid by mass spectrometry. Alzheimer’s Dementia. 12:55–59.
- Pannee J, Portelius E, Minthon L, Gobom J, Andreasson U, Zetterberg H, Hansson O, Blennow K. 2016. Reference measurement procedure for CSF amyloid beta (Abeta)1-42 and the CSF Abeta1-42/Abeta1-40 ratio - a cross-validation study against amyloid PET. J Neurochem. 139:651–658.
- Pannee J, Portelius E, Oppermann M, Atkins A, Hornshaw M, Zegers I, Hojrup P, Minthon L, Hansson O, Zetterberg H, et al. 2013. A selected reaction monitoring (SRM)-based method for absolute quantification of Abeta38, Abeta40, and Abeta42 in cerebrospinal fluid of Alzheimer’s disease patients and healthy controls. J Alzheimer’s Dis. 33:1021–1032.
- Parchi P, de Boni L, Saverioni D, Cohen ML, Ferrer I, Gambetti P, Gelpi E, Giaccone G, Hauw JJ, Hoftberger R, et al. 2012. Consensus classification of human prion disease histotypes allows reliable identification of molecular subtypes: an inter-rater study among surveillance centres in Europe and USA. Acta Neuropathol. 124:517–529.
- Parchi P, Strammiello R, Notari S, Giese A, Langeveld JP, Ladogana A, Zerr I, Roncaroli F, Cras P, Ghetti B, et al. 2009. Incidence and spectrum of sporadic creutzfeldt-jakob disease variants with mixed phenotype and co-occurrence of PrPSc types: an updated classification. Acta Neuropathol. 118:659–671.
- Park MJ, Cheon SM, Bae HR, Kim SH, Kim JW. 2011. Elevated levels of alpha-synuclein oligomer in the cerebrospinal fluid of drug-naive patients with Parkinson’s disease. J Clin Neurol (Seoul, Korea). 7:215–222.
- Park SA, Kang JH, Kang ES, Ki CS, Roh JH, Youn YC, Kim SY, Kim SY. 2015. A consensus in Korea regarding a protocol to reduce preanalytical sources of variability in the measurement of the cerebrospinal fluid biomarkers of Alzheimer’s disease. J Clin Neurol (Seoul, Korea). 11:132–141.
- Parnetti L, Cicognola C, Eusebi P, Chiasserini D. 2016. Value of cerebrospinal fluid alpha-synuclein species as biomarker in Parkinson’s diagnosis and prognosis. Biomark Med. 10:35–49.
- Parnetti L, Eusebi P, Lleo A. 2016. Cerebrospinal fluid biomarkers for target engagement and efficacy in clinical trials for Alzheimer’s and Parkinson’s diseases. Front Neurol Neurosci. 39:117–123.
- Paulsen JS, Nance M, Kim JI, Carlozzi NE, Panegyres PK, Erwin C, Goh A, McCusker E, Williams JK. 2013. A review of quality of life after predictive testing for and earlier identification of neurodegenerative diseases. Progr Neurobiol. 110:2–28.
- Pendlebury ST, Rothwell PM. 2009. Prevalence, incidence, and factors associated with pre-stroke and post-stroke dementia: a systematic review and meta-analysis. Lancet Neurol. 8:1006–1018.
- Perez A, Morelli L, Cresto JC, Castano EM. 2000. Degradation of soluble amyloid beta-peptides 1-40, 1-42, and the Dutch variant 1-40Q by insulin degrading enzyme from Alzheimer disease and control brains. Neurochem Res. 25:247–255.
- Perneczky R, Tsolakidou A, Arnold A, Diehl-Schmid J, Grimmer T, Förstl H, Kurz A, Alexopoulos P. 2011. CSF soluble amyloid precursor proteins in the diagnosis of incipient Alzheimer disease. Neurology. 77:35–38.
- Perret-Liaudet A, Pelpel M, Tholance Y, Dumont B, Vanderstichele H, Zorzi W, Elmoualij B, Schraen S, Moreaud O, Gabelle A, et al. 2012. Risk of Alzheimer’s disease biological misdiagnosis linked to cerebrospinal collection tubes. J Alzheimer’s Dis. 31:13–20.
- Perrotin A, de Flores R, Lamberton F, Poisnel G, La Joie R, de la Sayette V, Mezenge F, Tomadesso C, Landeau B, Desgranges B, et al. 2015. Hippocampal subfield volumetry and 3D surface mapping in subjective cognitive decline. J Alzheimer’s Dis. 48(Suppl 1):S141–S150.
- Perrotin A, La Joie R, de La Sayette V, Barré L, Mézenge F, Mutlu J, Guilloteau D, Egret S, Eustache F, Chételat G. 2016. Subjective cognitive decline in cognitively normal elders from the community or from a memory clinic: differential affective and imaging correlates. Alzheimer’s Dementia. 13:550–560.
- Peskind ER, Li G, Shofer J, Quinn JF, Kaye JA, Clark CM, Farlow MR, DeCarli C, Raskind MA, Schellenberg GD, et al. 2006. Age and apolipoprotein E*4 allele effects on cerebrospinal fluid beta-amyloid 42 in adults with normal cognition. Arch Neurol. 63:936–939.
- Peter J, Scheef L, Abdulkadir A, Boecker H, Heneka M, Wagner M, Koppara A, Kloppel S, Jessen F. 2014. Gray matter atrophy pattern in elderly with subjective memory impairment. Alzheimer’s Dement. 10:99–108.
- Petersen RC. 2004. Mild cognitive impairment as a diagnostic entity. J Intern Med. 256:183–194.
- Petersen RC, Aisen P, Boeve BF, Geda YE, Ivnik RJ, Knopman DS, Mielke M, Pankratz VS, Roberts R, Rocca WA, et al. 2013a. Criteria for mild cognitive impairment due to alzheimer’s disease in the community. Ann Neurol. 74:199–208.
- Petersen RC, Aisen P, Boeve BF, Geda YE, Ivnik RJ, Knopman DS, Mielke M, Pankratz VS, Roberts R, Rocca WA, et al. 2013b. Mild cognitive impairment due to Alzheimer disease in the community. Ann Neurol. 74:199–208.
- Petersen RC, Smith GE, Waring SC, Ivnik RJ, Tangalos EG, Kokmen E. 1999. Mild cognitive impairment: clinical characterization and outcome. Arch Neurol. 56:303–308.
- Petzold A. 2005. Neurofilament phosphoforms: surrogate markers for axonal injury, degeneration and loss. J Neurol Sci. 233:183–198.
- Piazza F, Greenberg SM, Savoiardo M, Gardinetti M, Chiapparini L, Raicher I, Nitrini R, Sakaguchi H, Brioschi M, Billo G, et al. 2013. Anti-amyloid beta autoantibodies in cerebral amyloid angiopathy-related inflammation: implications for amyloid-modifying therapies. Ann Neurol. 73:449–458.
- Pica-Mendez AM, Tanen M, Dallob A, Tanaka W, Laterza OF. 2010. Nonspecific binding of Abeta42 to polypropylene tubes and the effect of Tween-20. Clin Chim Acta; Int J Clin Chem. 411:1833.
- Piccio L, Deming Y, Del-Aguila JL, Ghezzi L, Holtzman DM, Fagan AM, Fenoglio C, Galimberti D, Borroni B, Cruchaga C. 2016. Cerebrospinal fluid soluble TREM2 is higher in Alzheimer disease and associated with mutation status. Acta Neuropathol. 131:925–933.
- Pijnenburg YA, Verwey NA, van der Flier WM, Scheltens P, Teunissen CE. 2015. Discriminative and prognostic potential of cerebrospinal fluid phosphoTau/tau ratio and neurofilaments for frontotemporal dementia subtypes. Alzheimer’s Dementia (Amsterdam, Netherlands). 1:505–512.
- Plebani M. 2006. Errors in clinical laboratories or errors in laboratory medicine? Clin Chem Lab Med. 44:750–759.
- Poncin-Epaillard F, Mille C, Debarnot D, Zorzi W, El Moualij B, Coudreuse A, Legeay G, Quadrio I, Perret-Liaudet A. 2012. Study of the adhesion of neurodegenerative proteins on plasma-modified and coated polypropylene surfaces. J Biomat Sci Poly Ed. 23:1879–1893.
- Portelius E, Dean RA, Andreasson U, Mattsson N, Westerlund A, Olsson M, Demattos RB, Racke MM, Zetterberg H, May PC, et al. 2014. beta-site amyloid precursor protein-cleaving enzyme 1(BACE1) inhibitor treatment induces Abeta5-X peptides through alternative amyloid precursor protein cleavage. Alzheimer’s Res Ther. 6:75.
- Portelius E, Dean RA, Gustavsson MK, Andreasson U, Zetterberg H, Siemers E, Blennow K. 2010. A novel abeta isoform pattern in CSF reflects gamma-secretase inhibition in Alzheimer disease. Alzheimer’s Res Ther. 2:7.
- Portelius E, Fortea J, Molinuevo JL, Gustavsson MK, Andreasson U, Sanchez-Valle R. 2012. The amyloid-beta isoform pattern in cerebrospinal fluid in familial PSEN1 M139T- and L286P-associated Alzheimer’s disease. Mol Med Rep. 5:1111–1115.
- Portelius E, Mattsson N, Pannee J, Zetterberg H, Gisslen M, Vanderstichele H, Gkanatsiou E, Crespi GA, Parker MW, Miles LA, et al. 2017. Ex vivo 18O-labeling mass spectrometry identifies a peripheral amyloid beta clearance pathway. Mol Neurodegener. 12:18.
- Portelius E, Zetterberg H, Dean RA, Marcil A, Bourgeois P, Nutu M, Andreasson U, Siemers E, Mawuenyega KG, Sigurdson WC, et al. 2012. Amyloid-beta(1-15/16) as a marker for gamma-secretase inhibition in Alzheimer’s disease. J Alzheimer’s Dis. 31:335–341.
- Portelius E, Zetterberg H, Skillback T, Tornqvist U, Andreasson U, Trojanowski JQ, Weiner MW, Shaw LM, Mattsson N, Blennow K. 2015. Cerebrospinal fluid neurogranin: relation to cognition and neurodegeneration in Alzheimer’s disease. Brain. 138:3373–3385.
- Pottier C, Hannequin D, Coutant S, Rovelet-Lecrux A, Wallon D, Rousseau S, Legallic S, Paquet C, Bombois S, Pariente J, et al. 2012. High frequency of potentially pathogenic SORL1 mutations in autosomal dominant early-onset Alzheimer disease. Mol Psychiatry. 17:875–879.
- Prestia A, Caroli A, van der Flier WM, Ossenkoppele R, Van Berckel B, Barkhof F, Teunissen CE, Wall AE, Carter SF, Scholl M, et al. 2013. Prediction of dementia in MCI patients based on core diagnostic markers for Alzheimer disease. Neurology. 80:1048–1056.
- Prince M, Wimo A, Guerchet M, Ali GC, Wu Y-T, Prina M. 2015. World Alzheimer Report 2015. London.
- Pringsheim T, Jette N, Frolkis A, Steeves TD. 2014. The prevalence of Parkinson’s disease: a systematic review and meta-analysis. Move Disord. 29:1583–1590.
- Rabinovici GD, Miller BL. 2010. Frontotemporal lobar degeneration: epidemiology, pathophysiology, diagnosis and management. CNS Drugs. 24:375–398.
- Racine AM, Koscik RL, Nicholas CR, Clark LR, Okonkwo OC, Oh JM, Hillmer AT, Murali D, Barnhart TE, Betthauser TJ, et al. 2016. Cerebrospinal fluid ratios with Aβ(42) predict preclinical brain β-amyloid accumulation. Alzheimer’s Dementia. 2:27–38.
- Rademakers R, Neumann M, Mackenzie IR. 2012. Advances in understanding the molecular basis of frontotemporal dementia. Nat Rev Neurol. 8:423–434.
- Rahkonen T, Eloniemi-Sulkava U, Rissanen S, Vatanen A, Viramo P, Sulkava R. 2003. Dementia with lewy bodies according to the consensus criteria in a general population aged 75 years or older. J Neurol Neurosurg Psychiatry. 74:720–724.
- Rahman B, Meiser B, Sachdev P, Barlow-Stewart K, Otlowski M, Zilliacus E, Schofield P. 2012. To know or not to know: an update of the literature on the psychological and behavioral impact of genetic testing for Alzheimer disease risk. Genet Test Mol Biomark. 16:935–942.
- Ramirez A, van der Flier WM, Herold C, Ramonet D, Heilmann S, Lewczuk P, Popp J, Lacour A, Drichel D, Louwersheimer E, et al. 2014. SUCLG2 identified as both a determinator of CSF Abeta1-42 levels and an attenuator of cognitive decline in Alzheimer’s disease. Hum Mol Genet. 23:6644–6658.
- Ranganathan S, Williams E, Ganchev P, Gopalakrishnan V, Lacomis D, Urbinelli L, Newhall K, Cudkowicz ME, Brown RH Jr, Bowser R. 2005. Proteomic profiling of cerebrospinal fluid identifies biomarkers for amyotrophic lateral sclerosis. J Neurochem. 95:1461–1471.
- Raschetti R, Albanese E, Vanacore N, Maggini M. 2007. Cholinesterase inhibitors in mild cognitive impairment: a systematic review of randomised trials. PLoS Med. 4:e338.
- Rascovsky K, Hodges JR, Knopman D, Mendez MF, Kramer JH, Neuhaus J, van Swieten JC, Seelaar H, Dopper EG, Onyike CU, et al. 2011. Sensitivity of revised diagnostic criteria for the behavioural variant of frontotemporal dementia. Brain. 134:2456–2477.
- Ratai E, Kirov I, Glodzik L, Gonen O. 2016. Studying aging, dementia, trauma, infection, and developmental disorders of the brain with 1H MRS. In: Handbook of in vivo magnetic resonance spectroscopy (MRS). New York: Wiley.
- Rathore S, Habes M, Iftikhar MA, Shacklett A, Davatzikos C. 2017. A review on neuroimaging-based classification studies and associated feature extraction methods for Alzheimer’s disease and its prodromal stages. Neuroimage. 155:530–548.
- Ray S, Britschgi M, Herbert C, Takeda-Uchimura Y, Boxer A, Blennow K, Friedman LF, Galasko DR, Jutel M, Karydas A, et al. 2007. Classification and prediction of clinical Alzheimer’s diagnosis based on plasma signaling proteins. Nature Med. 1, 1359–1362.
- Reddy PH, Mani G, Park BS, Jacques J, Murdoch G, Whetsell W Jr, Kaye J, Manczak M. 2005. Differential loss of synaptic proteins in Alzheimer’s disease: implications for synaptic dysfunction. J Alzheimer’s Dis. 7:103–117.
- Reiber H. 2001. Dynamics of brain-derived proteins in cerebrospinal fluid. Clin Chim Acta.; Int J Clin Chem. 310:173–186.
- Reijs BL, Teunissen CE, Goncharenko N, Betsou F, Blennow K, Baldeiras I, Brosseron F, Cavedo E, Fladby T, Froelich L, et al. 2015. The Central biobank and virtual biobank of BIOMARKAPD: a resource for studies on neurodegenerative diseases. Front Neurol. 6:216.
- Reisberg B, Ferris SH, de Leon MJ, Crook T. 1982. The global deterioration scale for assessment of primary degenerative dementia. Am J Psychiatry. 139:1136–1139.
- Renard D, Castelnovo G, Wacongne A, Le Floch A, Thouvenot E, Mas J, Gabelle A, Labauge P, Lehmann S. 2012. Interest of CSF biomarker analysis in possible cerebral amyloid angiopathy cases defined by the modified Boston criteria. J Neurol. 259:2429–2433.
- Renard D, Gabelle A, Hirtz C, Demattei C, Thouvenot E, Lehmann S. 2016. Cerebrospinal fluid Alzheimer’s disease biomarkers in isolated supratentorial cortical superficial siderosis. J Alzheimer’s Dis. 54:1291–1295.
- Rensink AA, de Waal RM, Kremer B, Verbeek MM. 2003. Pathogenesis of cerebral amyloid angiopathy. Brain Res Brain Res Rev. 43:207–223.
- Rentzos M, Rombos A, Nikolaou C, Zoga M, Zouvelou V, Dimitrakopoulos A, Alexakis T, Tsoutsou A, Samakovli A, Michalopoulou M, et al. 2010. Interleukin-17 and interleukin-23 are elevated in serum and cerebrospinal fluid of patients with ALS: a reflection of Th17 cells activation? Acta Neurol Scand. 122:425–429.
- Represa A, Deloulme JC, Sensenbrenner M, Ben-Ari Y, Baudier J. 1990. Neurogranin: immunocytochemical localization of a brain-specific protein kinase C substrate. J Neurosci. 10:3782–3792.
- Ridge PG, Hoyt KB, Boehme K, Mukherjee S, Crane PK, Haines JL, Mayeux R, Farrer LA, Pericak-Vance MA, Schellenberg GD, et al. 2016. Assessment of the genetic variance of late-onset Alzheimer’s disease. Neurobiol Aging. 41:200.e213–200.e220.
- Ridge PG, Mukherjee S, Crane PK, Kauwe JS. 2013. Alzheimer’s disease: analyzing the missing heritability. PLoS One. 8:e79771.
- Risacher SL, Kim S, Nho K, Foroud T, Shen L, Petersen RC, Jack CR Jr, Beckett LA, Aisen PS, Koeppe RA, et al. 2015. APOE effect on Alzheimer’s disease biomarkers in older adults with significant memory concern. Alzheimer’s Dementia. 11:1417–1429.
- Risacher SL, Saykin AJ. 2013. Neuroimaging and other biomarkers for Alzheimer’s disease: the changing landscape of early detection. Annu Rev Clin Psychol. 9:621–648.
- Rissin DM, Kan CW, Campbell TG, Howes SC, Fournier DR, Song L, Piech T, Patel PP, Chang L, Rivnak AJ, et al. 2010. Single-molecule enzyme-linked immunosorbent assay detects serum proteins at subfemtomolar concentrations. Nat Biotechnol. 28:595–599.
- Rissin DM, Kan CW, Song L, Rivnak AJ, Fishburn MW, Shao Q, Piech T, Ferrell EP, Meyer RE, Campbell TG, et al. 2013. Multiplexed single molecule immunoassays. Lab Chip. 13:2902–2911.
- Ritchie C, Smailagic N, Noel-Storr AH, Takwoingi Y, Flicker L, Mason SE, McShane R. 2014. Plasma and cerebrospinal fluid amyloid beta for the diagnosis of Alzheimer’s disease dementia and other dementias in people with mild cognitive impairment (MCI). Cochrane Database Syst Rev. 2014:CD008782.
- Rivnak AJ, Rissin DM, Kan CW, Song L, Fishburn MW, Piech T, Campbell TG, DuPont DR, Gardel M, Sullivan S, et al. 2015. A fully-automated, six-plex single molecule immunoassay for measuring cytokines in blood. J Immunol Methods. 424:20–27.
- Roberts JS, Dunn LB, Rabinovici GD. 2013. Amyloid imaging, risk disclosure and Alzheimer’s disease: ethical and practical issues. Neurodegener Dis Manage. 3:219–229.
- Robinson L, Gemski A, Abley C, Bond J, Keady J, Campbell S, Samsi K, Manthorpe J. 2011. The transition to dementia–individual and family experiences of receiving a diagnosis: a review. Int Psychogeriatr. 23:1026–1043.
- Roe CM, Fagan AM, Grant EA, Hassenstab J, Moulder KL, Maue Dreyfus D, Sutphen CL, Benzinger TL, Mintun MA, Holtzman DM, et al. 2013. Amyloid imaging and CSF biomarkers in predicting cognitive impairment up to 7.5 years later. Neurology. 80:1784–1791.
- Rogaev EI, Sherrington R, Rogaeva EA, Levesque G, Ikeda M, Liang Y, Chi H, Lin C, Holman K, Tsuda T, et al. 1995. Familial Alzheimer’s disease in kindreds with missense mutations in a gene on chromosome 1 related to the Alzheimer’s disease type 3 gene. Nature. 376:775–778.
- Rohloff JC, Gelinas AD, Jarvis TC, Ochsner UA, Schneider DJ, Gold L, Janjic N. 2014. Nucleic acid ligands with protein-like side chains: modified aptamers and their use as diagnostic and therapeutic agents. Mol Ther Nucleic Acids. 3:e201.
- Rohrer JD, Woollacott IO, Dick KM, Brotherhood E, Gordon E, Fellows A, Toombs J, Druyeh R, Cardoso MJ, Ourselin S, et al. 2016. Serum neurofilament light chain protein is a measure of disease intensity in frontotemporal dementia. Neurology. 87:1329–1336.
- Rosengren LE, Karlsson JE, Karlsson JO, Persson LI, Wikkelso C. 1996. Patients with amyotrophic lateral sclerosis and other neurodegenerative diseases have increased levels of neurofilament protein in CSF. J Neurochem. 67:2013–2018.
- Rosner H, Rebhan M, Vacun G, Vanmechelen E. 1995. Developmental expression of tau proteins in the chicken and rat brain: rapid down-regulation of a paired helical filament epitope in the rat cerebral cortex coincides with the transition from immature to adult tau isoforms. Int J Dev Neurosci. 13:607–617.
- Rovelet-Lecrux A, Hannequin D, Raux G, Le Meur N, Laquerriere A, Vital A, Dumanchin C, Feuillette S, Brice A, Vercelletto M, et al. 2006. APP locus duplication causes autosomal dominant early-onset Alzheimer disease with cerebral amyloid angiopathy. Nat Genet. 38:24–26.
- Rowe C, Ellis K, Brown B, Bourgeat P, Faux N, Martins R, Salvado O, Masters C, Ames D, Villemagne V. 2003. Cognition, hippocampal volume and fibrillar Aβ burden as predictors of cognitive decline: three-year follow-up results from AIBL. Alzheimer’s Dementia. 8:P433.
- Russ TC, Morling JR. 2012. Cholinesterase inhibitors for mild cognitive impairment. Cochrane Database Syst Rev. 12:Cd009132.
- Ryberg H, An J, Darko S, Lustgarten JL, Jaffa M, Gopalakrishnan V, Lacomis D, Cudkowicz M, Bowser R. 2010. Discovery and verification of amyotrophic lateral sclerosis biomarkers by proteomics. Muscle Nerve. 42:104–111.
- Saborio GP, Permanne B, Soto C. 2001. Sensitive detection of pathological prion protein by cyclic amplification of protein misfolding. Nature. 411:810–813.
- Sachdev P, Kalaria R, O’Brien J, Skoog I, Alladi S, Black SE, Blacker D, Blazer DG, Chen C, Chui H, et al. 2014. Diagnostic criteria for vascular cognitive disorders: a VASCOG statement. Alzheimer Dis Assoc Disord. 28:206–218.
- Salloway S, Sperling R, Fox NC, Blennow K, Klunk W, Raskind M, Sabbagh M, Honig LS, Porsteinsson AP, Ferris S, et al. 2014. Two phase 3 trials of bapineuzumab in mild-to-moderate Alzheimer’s disease. N Engl J Med. 370:322–333.
- Salvadores N, Shahnawaz M, Scarpini E, Tagliavini F, Soto C. 2014. Detection of misfolded Abeta oligomers for sensitive biochemical diagnosis of Alzheimer’s disease. Cell Rep. 7:261–268.
- Salza R, Oudart JB, Ramont L, Maquart FX, Bakchine S, Thoannes H, Ricard-Blum S. 2015. Endostatin level in cerebrospinal fluid of patients with Alzheimer’s disease. J Alzheimers Dis. 44:1253–1261.
- Sanchez-Juan P, Green A, Ladogana A, Cuadrado-Corrales N, Saanchez-Valle R, Mitrovaa E, Stoeck K, Sklaviadis T, Kulczycki J, Hess K, et al. 2006. CSF tests in the differential diagnosis of Creutzfeldt-Jakob disease. Neurology. 67:637–643.
- Sano K, Satoh K, Atarashi R, Takashima H, Iwasaki Y, Yoshida M, Sanjo N, Murai H, Mizusawa H, Schmitz M, et al. 2013. Early detection of abnormal prion protein in genetic human prion diseases now possible using real-time QUIC assay. PLoS One. 8:e54915.
- Schaafsma JD, van der Graaf Y, Rinkel GJ, Buskens E. 2009. Decision analysis to complete diagnostic research by closing the gap between test characteristics and cost-effectiveness. J Clin Epidemiol. 62:1248–1252.
- Scheltens P, Blennow K, Breteler MM, de Strooper B, Frisoni GB, Salloway S, Van der Flier WM. 2016. Alzheimer’s disease. Lancet (London, England). 388:505–517.
- Scherl A. 2015. Clinical protein mass spectrometry. Methods (San Diego, CA). 81:3–14.
- Scherling CS, Hall T, Berisha F, Klepac K, Karydas A, Coppola G, Kramer JH, Rabinovici G, Ahlijanian M, Miller BL, et al. 2014. Cerebrospinal fluid neurofilament concentration reflects disease severity in frontotemporal degeneration. Ann Neurol. 75:116–126.
- Scherzer CR, Grass JA, Liao Z, Pepivani I, Zheng B, Eklund AC, Ney PA, Ng J, McGoldrick M, Mollenhauer B, et al. 2008. GATA transcription factors directly regulate the Parkinson’s disease-linked gene alpha-synuclein. Proc Natl Acad Sci USA. 105:10907–10912.
- Schipke CG, Jessen F, Teipel S, Luckhaus C, Wiltfang J, Esselmann H, Frolich L, Maier W, Ruther E, Heppner FL, et al. 2011. Long-term stability of Alzheimer’s disease biomarker proteins in cerebrospinal fluid. J Alzheimer’s Dis. 26:255–262.
- Schmid AW, Fauvet B, Moniatte M, Lashuel HA. 2013. Alpha-synuclein post-translational modifications as potential biomarkers for Parkinson disease and other synucleinopathies. Mol Cell Proteom. 12:3543–3558.
- Schmitz M, Cramm M, Llorens F, Muller-Cramm D, Collins S, Atarashi R, Satoh K, Orru CD, Groveman BR, Zafar S, et al. 2016. The real-time quaking-induced conversion assay for detection of human prion disease and study of other protein misfolding diseases. Nature Protocols. 11:2233–2242.
- Schmitz M, Ebert E, Stoeck K, Karch A, Collins S, Calero M, Sklaviadis T, Laplanche JL, Golanska E, Baldeiras I, et al. 2016. Validation of 14-3-3 protein as a marker in sporadic Creutzfeldt-Jakob disease diagnostic. Mol Neurobiol. 53:2189–2199.
- Schneider JA, Aggarwal NT, Barnes L, Boyle P, Bennett DA. 2009. The neuropathology of older persons with and without dementia from community versus clinic cohorts. J Alzheimer’s Dis. 18:691–701.
- Schneider JA, Boyle PA, Arvanitakis Z, Bienias JL, Bennett DA. 2007. Subcortical infarcts, Alzheimer’s disease pathology, and memory function in older persons. Ann Neurol. 62:59–66.
- Schneider LS, Mangialasche F, Andreasen N, Feldman H, Giacobini E, Jones R, Mantua V, Mecocci P, Pani L, Winblad B, et al. 2014. Clinical trials and late-stage drug development for Alzheimer’s disease: an appraisal from 1984 to 2014. J Intern Med. 275:251–283.
- Scholl M, Lockhart SN, Schonhaut DR, O’Neil JP, Janabi M, Ossenkoppele R, Baker SL, Vogel JW, Faria J, Schwimmer HD, et al. 2016. PET Imaging of Tau Deposition in the Aging Human Brain. Neuron. 89:971–982.
- Schoonenboom NS, Mulder C, Vanderstichele H, Van Elk EJ, Kok A, Van Kamp GJ, Scheltens P, Blankenstein MA. 2005. Effects of processing and storage conditions on amyloid beta (1-42) and tau concentrations in cerebrospinal fluid: implications for use in clinical practice. Clin Chem. 51:189–195.
- Schultz SA, Oh JM, Koscik RL, Dowling NM, Gallagher CL, Carlsson CM, Bendlin BB, LaRue A, Hermann BP, Rowley HA, et al. 2015. Subjective memory complaints, cortical thinning, and cognitive dysfunction in middle-aged adults at risk for AD. Alzheimer’s Dementia (Amsterdam, Netherlands). 1:33–40.
- Schwarz AJ, Yu P, Miller BB, Shcherbinin S, Dickson J, Navitsky M, Joshi AD, Devous MD, Sr, Mintun MS. 2016. Regional profiles of the candidate tau PET ligand 18F-AV-1451 recapitulate key features of Braak histopathological stages. Brain. 139:1539–1550.
- Seeburger JL, Holder DJ, Combrinck M, Joachim C, Laterza O, Tanen M, Dallob A, Chappell D, Snyder K, Flynn M, et al. 2015. Cerebrospinal fluid biomarkers distinguish postmortem-confirmed Alzheimer’s disease from other dementias and healthy controls in the OPTIMA cohort. J Alzheimer’s Dis. 44:525–539.
- Selkoe DJ, Wolfe MS. 2007. Presenilin: running with scissors in the membrane. Cell. 131:215–221.
- Seltman RE, Matthews BR. 2012. Frontotemporal lobar degeneration: epidemiology, pathology, diagnosis and management. CNS Drugs. 26:841–870.
- Seshadri S, Fitzpatrick AL, Ikram MA, DeStefano AL, Gudnason V, Boada M, Bis JC, Smith AV, Carassquillo MM, Lambert JC, et al. 2010. Genome-wide analysis of genetic loci associated with Alzheimer disease. JAMA. 303:1832–1840.
- Shahani N, Brandt R. 2002. Functions and malfunctions of the tau proteins. Cell Mol Life Sci. 59:1668–1680.
- Shams S, Granberg T, Martola J, Li X, Shams M, Fereshtehnejad SM, Cavallin L, Aspelin P, Kristoffersen-Wiberg M, Wahlund LO. 2016. Cerebrospinal fluid profiles with increasing number of cerebral microbleeds in a continuum of cognitive impairment. J Cereb Blood Flow Metabol. 36:621–628.
- Shannon KM, Keshavarzian A, Dodiya HB, Jakate S, Kordower JH. 2012. Is alpha-synuclein in the colon a biomarker for premotor Parkinson’s disease? Evidence from 3 cases. Move Disord. 27:716–719.
- Shaw LM, Korecka M, Clark CM, Lee VM, Trojanowski JQ. 2007. Biomarkers of neurodegeneration for diagnosis and monitoring therapeutics. Nat Rev Drug Discov. 6:295–303.
- Shaw LM, Vanderstichele H, Knapik-Czajka M, Clark CM, Aisen PS, Petersen RC, Blennow K, Soares H, Simon A, Lewczuk P, et al. 2009. Cerebrospinal fluid biomarker signature in Alzheimer’s disease neuroimaging initiative subjects. Ann Neurol. 65:403–413.
- Shaw LM, Vanderstichele H, Knapik-Czajka M, Figurski M, Coart E, Blennow K, Soares H, Simon AJ, Lewczuk P, Dean RA, et al. 2011. Qualification of the analytical and clinical performance of CSF biomarker analyses in ADNI. Acta Neuropathol. 121:597–609.
- Sherrington R, Rogaev EI, Liang Y, Rogaeva EA, Levesque G, Ikeda M, Chi H, Lin C, Li G, Holman K, et al. 1995. Cloning of a gene bearing missense mutations in early-onset familial Alzheimer’s disease. Nature. 375:754–760.
- Shi M, Liu C, Cook TJ, Bullock KM, Zhao Y, Ginghina C, Li Y, Aro P, Dator R, He C, et al. 2014. Plasma exosomal α-synuclein is likely CNS-derived and increased in Parkinson’s disease. Acta Neuropathol. 128:639–650.
- Siemers ER, Friedrich S, Dean RA, Gonzales CR, Farlow MR, Paul SM, Demattos RB. 2010. Safety and changes in plasma and cerebrospinal fluid amyloid beta after a single administration of an amyloid beta monoclonal antibody in subjects with Alzheimer disease. Clin Neuropharmacol. 33:67–73.
- Siemers ER, Quinn JF, Kaye J, Farlow MR, Porsteinsson A, Tariot P, Zoulnouni P, Galvin JE, Holtzman DM, Knopman DS, et al. 2006. Effects of a gamma-secretase inhibitor in a randomized study of patients with Alzheimer disease. Neurology. 66:602–604.
- Simonsen AH, Bahl JM, Danborg PB, Lindstrom V, Larsen SO, Grubb A, Heegaard NH, Waldemar G. 2013. Pre-analytical factors influencing the stability of cerebrospinal fluid proteins. J Neurosci Methods. 215:234–240.
- Simonsen AH, Kuiperij B, El-Agnaf OM, Engelborghs S, Herukka SK, Parnetti L, Rektorova I, Vanmechelen E, Kapaki E, Verbeek M, et al. 2016. The utility of alpha-synuclein as biofluid marker in neurodegenerative diseases: a systematic review of the literature. Biomark Med. 10:19–34.
- Sjögren M, Gisslen M, Vanmechelen E, Blennow K. 2001. Low cerebrospinal fluid beta-amyloid 42 in patients with acute bacterial meningitis and normalization after treatment. Neurosci Lett. 314:33–36.
- Skillback T, Farahmand B, Bartlett JW, Rosen C, Mattsson N, Nagga K, Kilander L, Religa D, Wimo A, Winblad B, et al. 2014. CSF neurofilament light differs in neurodegenerative diseases and predicts severity and survival. Neurology. 83:1945–1953.
- Skillback T, Rosen C, Asztely F, Mattsson N, Blennow K, Zetterberg H. 2014. Diagnostic performance of cerebrospinal fluid total Tau and phosphorylated Tau in Creutzfeldt-Jakob disease: results from the swedish mortality registry. JAMA Neurol. 71:476–483.
- Skoldunger A, Johnell K, Winblad B, Wimo A. 2013. Mortality and treatment costs have a great impact on the cost-effectiveness of disease modifying treatment in Alzheimer’s disease: a simulation study. Curr Alzheimer Res. 10:207–216.
- Skrobot OA, Attems J, Esiri M, Hortobagyi T, Ironside JW, Kalaria RN, King A, Lammie GA, Mann D, Neal J, et al. 2016. Vascular cognitive impairment neuropathology guidelines (VCING): the contribution of cerebrovascular pathology to cognitive impairment. Brain. 139:2957–2969.
- Slaets S, Le Bastard N, Martin JJ, Sleegers K, Van Broeckhoven C, De Deyn PP, Engelborghs S. 2013. Cerebrospinal fluid Abeta1-40 improves differential dementia diagnosis in patients with intermediate P-tau181P levels. J Alzheimer’s Dis. 36:759–767.
- Slaets S, Le Bastard N, Theuns J, Sleegers K, Verstraeten AD, Leenheir E, Luyckx J, Martin JJ, Van Broeckhoven C, Engelborghs S. 2013. Amyloid pathology influences abeta1-42 cerebrospinal fluid levels in dementia with lewy bodies. J Alzheimer’s Dis. 35:137–146.
- Slaets S, Vanmechelen E, Le Bastard N, Decraemer H, Vandijck M, Martin JJ, De Deyn PP, Engelborghs S. 2014. Increased CSF alpha-synuclein levels in Alzheimer’s disease: correlation with tau levels. Alzheimer’s Dementia. 10:S290–S298.
- Slats D, Claassen JA, Spies PE, Borm G, Besse KT, van Aalst W, Tseng J, Sjogren MJ, Olde Rikkert MG, Verbeek MM. 2012. Hourly variability of cerebrospinal fluid biomarkers in Alzheimer’s disease subjects and healthy older volunteers. Neurobiol Aging. 33:831.e831–839.
- Sleegers K, Bettens K, De Roeck A, Van Cauwenberghe C, Cuyvers E, Verheijen J, Struyfs H, Van Dongen J, Vermeulen S, Engelborghs S, et al. 2015. A 22-single nucleotide polymorphism Alzheimer’s disease risk score correlates with family history, onset age, and cerebrospinal fluid Abeta42. Alzheimer’s Dementia. 11:1452–1460.
- Slemmon JR, Meredith J, Guss V, Andreasson U, Andreasen N, Zetterberg H, Blennow K. 2012. Measurement of Abeta1-42 in cerebrospinal fluid is influenced by matrix effects. J Neurochem. 120:325–333.
- Smith EE, Greenberg SM. 2003. Clinical diagnosis of cerebral amyloid angiopathy: validation of the Boston criteria. Curr Atheroscler Rep. 5:260–266.
- Soares HD, Chen Y, Sabbagh M, Roher A, Schrijvers E, Breteler M. 2009. Identifying early markers of Alzheimer’s disease using quantitative multiplex proteomic immunoassay panels. Ann NY Acad Sci. 1180:56–67.
- Song Y, Stampfer MJ, Liu S. 2004. Meta-analysis: apolipoprotein E genotypes and risk for coronary heart disease. Ann Intern Med. 141:137–147.
- Sonnen JA, Cruz KS, Hemmy LS, Woltjer R, Leverenz JB, Montine KS, Jack CR, Kaye J, Lim K, Larson EB, et al. 2011. Ecology of the aging human brain. Arch Neurol. 68:1049–1056.
- Sperling RA, Aisen PS, Beckett LA, Bennett DA, Craft S, Fagan AM, Iwatsubo T, Jack CR, Kaye J, Montine TJ, et al. 2011. Toward defining the preclinical stages of Alzheimer’s disease: Recommendations from the National Institute on Aging-Alzheimer’s Association workgroups on diagnostic guidelines for Alzheimer’s disease. Alzheimer’s Dementia. 7:280–292.
- Spies PE, Slats D, Rikkert MG, Tseng J, Claassen JA, Verbeek MM. 2011. CSF alpha-synuclein concentrations do not fluctuate over hours and are not correlated to amyloid beta in humans. Neurosci Lett. 504:336–338.
- Spies PE, Verbeek MM, van GT, Claassen JA. 2012. Reviewing reasons for the decreased CSF Abeta42 concentration in Alzheimer disease. Front Biosci (Landmark Ed). 17:2024–2034.
- Spillantini MG, Schmidt ML, Lee VM, Trojanowski JQ, Jakes R, Goedert M. 1997. Alpha-synuclein in Lewy bodies. Nature. 388:839–840.
- Stancu IC, Vasconcelos B, Ris L, Wang P, Villers A, Peeraer E, Buist A, Terwel D, Baatsen P, Oyelami T, et al. 2015. Templated misfolding of Tau by prion-like seeding along neuronal connections impairs neuronal network function and associated behavioral outcomes in Tau transgenic mice. Acta Neuropathol. 129:875–894.
- Steinacker P, Feneberg E, Weishaupt J, Brettschneider J, Tumani H, Andersen PM, von Arnim CA, Bohm S, Kassubek J, Kubisch C, et al. 2016. Neurofilaments in the diagnosis of motoneuron diseases: a prospective study on 455 patients. J Neurol Neurosurg Psychiatry. 87:12–20.
- Steinacker P, Hendrich C, Sperfeld AD, Jesse S, von Arnim CA, Lehnert S, Pabst A, Uttner I, Tumani H, Lee VM, et al. 2008. TDP-43 in cerebrospinal fluid of patients with frontotemporal lobar degeneration and amyotrophic lateral sclerosis. Arch Neurol. 65:1481–1487.
- Stevens T, Livingston G, Kitchen G, Manela M, Walker Z, Katona C. 2002. Islington study of dementia subtypes in the community. Br J Psychiatry. 180:270–276.
- Stoeck K, Sanchez-Juan P, Gawinecka J, Green A, Ladogana A, Pocchiari M, Sanchez-Valle R, Mitrova E, Sklaviadis T, Kulczycki J, et al. 2012. Cerebrospinal fluid biomarker supported diagnosis of Creutzfeldt-Jakob disease and rapid dementias: a longitudinal multicentre study over 10 years. Brain. 135:3051–3061.
- Stomrud E, Hansson O, Zetterberg H, Blennow K, Minthon L, Londos E. 2010. Correlation of longitudinal cerebrospinal fluid biomarkers with cognitive decline in healthy older adults. Arch Neurol. 67:217–223.
- Strittmatter WJ, Saunders AM, Schmechel D, Pericak-Vance M, Enghild J, Salvesen GS, Roses AD. 1993. Apolipoprotein E: high-avidity binding to beta-amyloid and increased frequency of type 4 allele in late-onset familial Alzheimer disease. Proc Natl Acad Sci USA. 90:1977–1981.
- Struyfs H, Molinuevo JL, Martin JJ, De Deyn PP, Engelborghs S. 2014. Validation of the AD-CSF-index in autopsy-confirmed Alzheimer’s disease patients and healthy controls. J Alzheimer’s Dis. 41:903–909.
- Struyfs H, Niemantsverdriet E, Goossens J, Fransen E, Martin JJ, De Deyn PP, Engelborghs S. 2015. Cerebrospinal fluid P-Tau181P: biomarker for improved differential dementia diagnosis. Front Neurol. 6:138.
- Struyfs H, Van Broeck B, Timmers M, Fransen E, Sleegers K, Van Broeckhoven C, D, Deyn PP, Streffer JR, Mercken M, Engelborghs S. 2015. Diagnostic accuracy of cerebrospinal fluid amyloid-beta isoforms for early and differential dementia diagnosis. J Alzheimer’s Dis. 45:813–822.
- Su Z, Zhang Y, Gendron TF, Bauer PO, Chew J, Yang WY, Fostvedt E, Jansen-West K, Belzil VV, Desaro P, et al. 2014. Discovery of a biomarker and lead small molecules to target r(GGGGCC)-associated defects in c9FTD/ALS. Neuron. 83:1043–1050.
- Suarez-Calvet M, Dols-Icardo O, Llado A, Sanchez-Valle R, Hernandez I, Amer G, Anton-Aguirre S, Alcolea D, Fortea J, Ferrer I, et al. 2014. Plasma phosphorylated TDP-43 levels are elevated in patients with frontotemporal dementia carrying a C9orf72 repeat expansion or a GRN mutation. J Neurol Neurosurg Psychiatry. 85:684–691.
- Suarez-Calvet M, Kleinberger G, Araque Caballero MA, Brendel M, Rominger A, Alcolea D, Fortea J, Lleo A, Blesa R, Gispert JD, et al. 2016. sTREM2 cerebrospinal fluid levels are a potential biomarker for microglia activity in early-stage Alzheimer’s disease and associate with neuronal injury markers. EMBO Mol Med. 8:466–476.
- Sunderland T, Linker G, Mirza N, Putnam KT, Friedman DL, Kimmel LH, Bergeson J, Manetti GJ, Zimmermann M, Tang B, et al. 2003. Decreased beta-amyloid1-42 and increased tau levels in cerebrospinal fluid of patients with Alzheimer disease. JAMA.289:2094–2103.
- Sutphen CL, Jasielec MS, Shah AR, Macy EM, Xiong C, Vlassenko AG, Benzinger TL, Stoops EE, Vanderstichele HM, Brix B, et al. 2015. Longitudinal cerebrospinal fluid biomarker changes in preclinical Alzheimer disease during middle age. JAMA Neurol. 72:1029–1042.
- Swaminathan S, Risacher SL, Yoder KK, West JD, Shen L, Kim S, Inlow M, Foroud T, Jagust WJ, Koeppe RA, et al. 2014. Association of plasma and cortical amyloid beta is modulated by APOE epsilon4 status. Alzheimer’s Dementia. 10:e9–e18.
- Sweileh BA, Al-Hiari YM, Kailani MH, Mohammad HA. 2010. Synthesis and characterization of polycarbonates by melt phase interchange reactions of alkylene and arylene diacetates with alkylene and arylene diphenyl dicarbonates. Molecules (Basel, Switzerland). 15:3661–3682.
- Tamura R, Tomita H, Mizutani K, Miwa T. 2014. The importance of amyloid beta protein in cerebrospinal fluid when you recognize convexal subarachnoid hemorrhage. Eur Neurol. 71:283–287.
- Tanaka M, Kikuchi H, Ishizu T, Minohara M, Osoegawa M, Motomura K, Tateishi T, Ohyagi Y, Kira J. 2006. Intrathecal upregulation of granulocyte colony stimulating factor and its neuroprotective actions on motor neurons in amyotrophic lateral sclerosis. J Neuropathol Exp Neurol. 65:816–825.
- Tang W, Huang Q, Wang Y, Wang ZY, Yao YY. 2014. Assessment of CSF Abeta42 as an aid to discriminating Alzheimer’s disease from other dementias and mild cognitive impairment: a meta-analysis of 50 studies. J Neurol Sci. 345:26–36.
- Tapiola T, Overmyer M, Lehtovirta M, Helisalmi S, Ramberg J, Alafuzoff I, Riekkinen P, Sr, Soininen H. 1997. The level of cerebrospinal fluid tau correlates with neurofibrillary tangles in Alzheimer’s disease. Neuroreport. 8:3961–3963.
- Tapiola T, Soininen H, Pirttila T. 2001. CSF tau and Abeta42 levels in patients with Down’s syndrome. Neurology. 56:979–980.
- Tateishi T, Yamasaki R, Tanaka M, Matsushita T, Kikuchi H, Isobe N, Ohyagi Y, Kira J. 2010. CSF chemokine alterations related to the clinical course of amyotrophic lateral sclerosis. J Neuroimmunol. 222:76–81.
- Taubes G. 2003. Neuroscience. Insulin insults may spur Alzheimer’s disease. Science. 301:40–41.
- Teipel SJ, Ewers M, Wolf S, Jessen F, Kolsch H, Arlt S, Luckhaus C, Schonknecht P, Schmidtke K, Heuser I, et al. 2010. Multicentre variability of MRI-based medial temporal lobe volumetry in Alzheimer’s disease. Psychiatry Res. 182:244–250.
- Teunissen CE, Elias N, Koel-Simmelink MJ, Durieux-Lu S, Malekzadeh A, Pham TV, Piersma SR, Beccari T, Meeter LH, Dopper EG, et al. 2016. Novel diagnostic cerebrospinal fluid biomarkers for pathologic subtypes of frontotemporal dementia identified by proteomics. Alzheimers Dement (Amst). 2:86–94.
- Teunissen CE, Khalil M. 2012. Neurofilaments as biomarkers in multiple sclerosis. Multiple Sclerosis (Houndmills, Basingstoke, England). 18:552–556.
- Teunissen CE, Petzold A, Bennett JL, Berven FS, Brundin L, Comabella M, Franciotta D, Frederiksen JL, Fleming JO, Furlan R, et al. 2009. A consensus protocol for the standardization of cerebrospinal fluid collection and biobanking. Neurology. 73:1914–1922.
- Teunissen CE, Tumani H, Engelborghs S, Mollenhauer B. 2014. Biobanking of CSF: international standardization to optimize biomarker development. Clin Biochem. 47:288–292.
- Thorsell A, Bjerke M, Gobom J, Brunhage E, Vanmechelen E, Andreasen N, Hansson O, Minthon L, Zetterberg H, Blennow K. 2010. Neurogranin in cerebrospinal fluid as a marker of synaptic degeneration in Alzheimer’s disease. Brain Res. 1362:13–22.
- Timmer NM, Herbert MK, Claassen JA, Kuiperij HB, Verbeek MM. 2015. Total glutamine synthetase levels in cerebrospinal fluid of Alzheimer’s disease patients are unchanged. Neurobiol Aging. 36:1271–1273.
- Todd J, Freese B, Lu A, Held D, Morey J, Livingston R, Goix P. 2007. Ultrasensitive flow-based immunoassays using single-molecule counting. Clin Chem. 53:1990–1995.
- Tokuda T, Salem SA, Allsop D, Mizuno T, Nakagawa M, Qureshi MM, Locascio JJ, Schlossmacher MG, El-Agnaf OM. 2006. Decreased alpha-synuclein in cerebrospinal fluid of aged individuals and subjects with Parkinson’s disease. Biochem Biophys Res Commun. 349:162–166.
- Toledo JB, Brettschneider J, Grossman M, Arnold SE, Hu WT, Xie SX, Lee VM, Shaw LM, Trojanowski JQ. 2012. CSF biomarkers cutoffs: the importance of coincident neuropathological diseases. Acta Neuropathol. 124:23–35.
- Toledo JB, Cairns NJ, Da X, Chen K, Carter D, Fleisher A, Householder E, Ayutyanont N, Roontiva A, Bauer RJ, et al. 2013. Clinical and multimodal biomarker correlates of ADNI neuropathological findings. Acta Neuropathol Commun. 1:65.
- Toledo JB, Gopal P, Raible K, Irwin DJ, Brettschneider J, Sedor S, Waits K, Boluda S, Grossman M, Van Deerlin VM, et al. 2016. Pathological alpha-synuclein distribution in subjects with coincident Alzheimer’s and Lewy body pathology. Acta Neuropathol. 131:393–409.
- Toledo JB, Weiner MW, Wolk DA, Da X, Chen K, Arnold SE, Jagust W, Jack C, Reiman EM, Davatzikos C, et al. 2014. Neuronal injury biomarkers and prognosis in ADNI subjects with normal cognition. Acta Neuropathol Commun. 2:26.
- Toledo JB, Xie SX, Trojanowski JQ, Shaw LM. 2013. Longitudinal change in CSF Tau and Aβ biomarkers for up to 48 months in ADNI. Acta Neuropathol. 126:659–670.
- Tong G, Castaneda L, Wang JS, Sverdlov O, Huang SP, Slemmon R, Gu H, Wong O, Li H, Berman RM, et al. 2012. Effects of single doses of avagacestat (BMS-708163) on cerebrospinal fluid Abeta levels in healthy young men. Clin Drug Investig. 32:761–769.
- Toombs J, Paterson RW, Schott JM, Zetterberg H. 2014. Amyloid-beta 42 adsorption following serial tube transfer. Alzheimer’s Res Ther. 6:5.
- Tousseyn T, Bajsarowicz K, Sanchez H, Gheyara A, Oehler A, Geschwind M, DeArmond B, DeArmond SJ. 2015. Prion disease induces Alzheimer disease-like neuropathologic changes. J Neuropathol Exp Neurol. 74:873–888.
- Tsuang D, Leverenz JB, Lopez OL, Hamilton RL, Bennett DA, Schneider JA, Buchman AS, Larson EB, Crane PK, Kaye JA, et al. 2013. APOE ε4 increases risk for dementia in pure synucleinopathies. JAMA Neurol. 70:223–228.
- Tsuji-Akimoto S, Yabe I, Niino M, Kikuchi S, Sasaki H. 2009. Cystatin C in cerebrospinal fluid as a biomarker of ALS. Neurosci Lett. 452:52–55.
- Turner MR, Bowser R, Bruijn L, Dupuis L, Ludolph A, McGrath M, Manfredi G, Maragakis N, Miller RG, Pullman SL, et al. 2013. Mechanisms, models and biomarkers in amyotrophic lateral sclerosis. Amyotrophic Lateral Scler Frontotemp Degener. 14(Suppl 1):19–32.
- Turner MR, Gray E. 2016. Are neurofilaments heading for the ALS clinic? J Neurol Neurosurg Psychiatry. 87:3–4.
- Turner MR, Kiernan MC, Leigh PN, Talbot K. 2009. Biomarkers in amyotrophic lateral sclerosis. Lancet Neurol. 8:94–109.
- Turner MR, Swash M. 2015. The expanding syndrome of amyotrophic lateral sclerosis: a clinical and molecular odyssey. J Neurol Neurosurg Psychiatry. 86:667–673.
- Valcarcel-Nazco C, Perestelo-Perez L, Molinuevo JL, Mar J, Castilla I, Serrano-Aguilar P. 2014. Cost-effectiveness of the use of biomarkers in cerebrospinal fluid for Alzheimer’s disease. J Alzheimer’s Dis. 42:777–788.
- Van Broeckhoven C, Haan J, Bakker E, Hardy JA, Van Hul W, Wehnert A, Vegter-Van der Vlis M, Roos RA. 1990. Amyloid beta protein precursor gene and hereditary cerebral hemorrhage with amyloidosis (Dutch). Science. 248:1120–1122.
- Van Cauwenberghe C, Van Broeckhoven C, Sleegers K. 2016. The genetic landscape of Alzheimer disease: clinical implications and perspectives. Genet Med. 18:421–430.
- Van Damme P, Van Hoecke A, Lambrechts D, Vanacker P, Bogaert E, van Swieten J, Carmeliet P, Van Den Bosch L, Robberecht W. 2008. Progranulin functions as a neurotrophic factor to regulate neurite outgrowth and enhance neuronal survival. J Cell Biol. 181:37–41.
- Van Everbroeck B, Dobbeleir I, De Waele M, De Deyn P, Martin JJ, Cras P. 2004. Differential diagnosis of 201 possible Creutzfeldt-Jakob disease patients. J Neurol. 251:298–304.
- van Harten AC, Kester MI, Visser PJ, Blankenstein MA, Pijnenburg YA, van der Flier WM, Scheltens P. 2011. Tau and p-tau as CSF biomarkers in dementia: a meta-analysis. Clin Chem Lab Med. 49:353–366.
- van Harten AC, Smits LL, Teunissen CE, Visser PJ, Koene T, Blankenstein MA, Scheltens P, van der Flier WM. 2013. Preclinical AD predicts decline in memory and executive functions in subjective complaints. Neurology. 81:1409–1416.
- van Harten AC, Visser PJ, Pijnenburg YA, Teunissen CE, Blankenstein MA, Scheltens P, van der Flier WM. 2013. Cerebrospinal fluid Abeta42 is the best predictor of clinical progression in patients with subjective complaints. Alzheimer’s Dementia. 9:481–487.
- Van Nostrand WE, Melchor JP, Cho HS, Greenberg SM, Rebeck GW. 2001. Pathogenic effects of D23N Iowa mutant amyloid beta -protein. J Biol Chem. 276:32860–32866.
- van Oijen M, Hofman A, Soares HD, Koudstaal PJ, Breteler MM. 2006. Plasma Abeta(1-40) and Abeta(1-42) and the risk of dementia: a prospective case-cohort study. Lancet Neurol. 5:655–660.
- van Rossum IA, Vos S, Handels R, Visser PJ. 2010. Biomarkers as predictors for conversion from mild cognitive impairment to Alzheimer-type dementia: implications for trial design. J Alzheimer’s Dis. 20:881–891.
- van Veluw SJ, Biessels GJ, Klijn CJ, Rozemuller AJ. 2016. Heterogeneous histopathology of cortical microbleeds in cerebral amyloid angiopathy. Neurology. 86:867–871.
- Vanderstichele H, Bibl M, Engelborghs S, Le Bastard N, Lewczuk P, Molinuevo JL, Parnetti L, Perret-Liaudet A, Shaw LM, Teunissen C, et al. 2012. Standardization of preanalytical aspects of cerebrospinal fluid biomarker testing for Alzheimer’s disease diagnosis: a consensus paper from the Alzheimer’s Biomarkers Standardization Initiative. Alzheimer’s Dementia. 8:65–73.
- Varma A, Snowden J, Lloyd J, Talbot P, Mann D, Neary D. 1999. Evaluation of the NINCDS-ADRDA criteria in the differentiation of Alzheimer’s disease and frontotemporal dementia. J Neurol Neurosurg Psychiatry. 66:184–188.
- Vemuri P, Lesnick TG, Przybelski SA, Knopman DS, Preboske GM, Kantarci K, Raman MR, Machulda MM, Mielke MM, Lowe VJ, et al. 2015. Vascular and amyloid pathologies are independent predictors of cognitive decline in normal elderly. Brain. 138:761–771.
- Vemuri P, Wiste HJ, Weigand SD, Knopman DS, Trojanowski JQ, Shaw LM, Bernstein MA, Aisen PS, Weiner M, Petersen RC, et al. 2010. Serial MRI and CSF biomarkers in normal aging, MCI, and AD. Neurology. 75:143–151.
- Vemuri P, Wiste HJ, Weigand SD, Shaw LM, Trojanowski JQ, Weiner MW, Knopman DS, Petersen RC, Jack CR Jr. 2009. MRI and CSF biomarkers in normal, MCI, and AD subjects: diagnostic discrimination and cognitive correlations. Neurology. 73:287–293.
- Verbeek MM, Eikelenboom P, de Waal RM. 1997. Differences between the pathogenesis of senile plaques and congophilic angiopathy in Alzheimer disease. J Neuropathol Exp Neurol. 56:751–761.
- Verbeek MM, Kremer BP, Rikkert MO, Van Domburg PH, Skehan ME, Greenberg SM. 2009. Cerebrospinal fluid amyloid beta(40) is decreased in cerebral amyloid angiopathy. Ann Neurol. 66:245–249.
- Vieira RT, Caixeta L, Machado S, Silva AC, Nardi AE, Arias-Carrion O, Carta MG. 2013. Epidemiology of early-onset dementia: a review of the literature. Clin Prac Epidemiol Mental Health. 9:88–95.
- Villarreal AE, O’Bryant SE, Edwards M, Grajales S, Britton GB. 2016. Serum-based protein profiles of Alzheimer’s disease and mild cognitive impairment in elderly Hispanics. Neurodegener Dis Manage. 6:203–213.
- Villemagne VL. 2016. Amyloid imaging: Past, present and future perspectives. Ageing Res Rev. 30:95–106.
- Villemagne VL, Fodero-Tavoletti MT, Masters CL, Rowe CC. 2015. Tau imaging: early progress and future directions. Lancet Neurol. 14:114–124.
- Vinters HV. 1987. Cerebral amyloid angiopathy. A critical review. Stroke. 18:311–324.
- Visser PJ, Verhey F, Knol DL, Scheltens P, Wahlund LO, Freund-Levi Y, Tsolaki M, Minthon L, Wallin AK, Hampel H, et al. 2009. Prevalence and prognostic value of CSF markers of Alzheimer’s disease pathology in patients with subjective cognitive impairment or mild cognitive impairment in the DESCRIPA study: a prospective cohort study. Lancet Neurol. 8:619–627.
- Viswanathan A, Greenberg SM. 2011. Cerebral amyloid angiopathy in the elderly. Ann Neurol. 70:871–880.
- Vlassenko AG, Benzinger TL, Morris JC. 2012. PET amyloid-beta imaging in preclinical Alzheimer’s disease. Biochim Biophys Acta. 1822:370–379.
- Vlassenko AG, McCue L, Jasielec MS, Su Y, Gordon BA, Xiong C, Holtzman DM, Benzinger TL, Morris JC, Fagan AM. 2016. Imaging and cerebrospinal fluid biomarkers in early preclinical alzheimer disease. Ann Neurol. 80:379–387.
- Vlassenko AG, Mintun MA, Xiong C, Sheline YI, Goate AM, Benzinger TLS, Morris JC. 2011. Amyloid-beta plaque growth in cognitively normal adults: Longitudinal [11C]Pittsburgh compound B data. Ann Neurol. 70:857–861.
- Vos SJ, Gordon BA, Su Y, Visser PJ, Holtzman DM, Morris JC, Fagan AM, Benzinger TL. 2016. NIA-AA staging of preclinical Alzheimer disease: discordance and concordance of CSF and imaging biomarkers. Neurobiol Aging. 44:1–8.
- Vos SJ, Verhey F, Frölich L, Kornhuber J, Wiltfang J, Maier W, Peters O, Rüther E, Nobili F, Morbelli S, et al. 2015. Prevalence and prognosis of Alzheimer’s disease at the mild cognitive impairment stage. Brain. 138:1327–1338.
- Vos SJ, Xiong C, Visser PJ, Jasielec MS, Hassenstab J, Grant EA, Cairns NJ, Morris JC, Holtzman DM, Fagan AM. 2013. Preclinical Alzheimer’s disease and its outcome: a longitudinal cohort study. Lancet Neurol. 12:957–965.
- Waedt J, Kleinow M, Kornhuber J, Lewczuk P. 2012. Neurochemical dementia diagnostics for Alzheimer’s disease and other dementias: an ISO 15189 perspective. Biomark Med. 6:685–690.
- Wagner M, Wolf S, Reischies FM, Daerr M, Wolfsgruber S, Jessen F, Popp J, Maier W, Hüll M, Frölich L, et al. 2012. Biomarker validation of a cued recall memory deficit in prodromal Alzheimer disease. Neurology. 78:379–386.
- Walker L, McAleese KE, Thomas AJ, Johnson M, Martin-Ruiz C, Parker C, Colloby SJ, Jellinger K, Attems J. 2015. Neuropathologically mixed Alzheimer’s and Lewy body disease: burden of pathological protein aggregates differs between clinical phenotypes. Acta Neuropathol. 129:729–748.
- Walker Z, Possin KL, Boeve BF, Aarsland D. 2015. Lewy body dementias. Lancet (London, England). 386:1683–1697.
- Wang-Dietrich L, Funke SA, Kuhbach K, Wang K, Besmehn A, Willbold S, Cinar Y, Bannach O, Birkmann E, Willbold D. 2013. The amyloid-beta oligomer count in cerebrospinal fluid is a biomarker for Alzheimer’s disease. J Alzheimer’s Dis. 34:985–994.
- Wang Y, Klunk WE, Huang GF, Debnath ML, Holt DP, Mathis CA. 2002. Synthesis and evaluation of 2-(3’-iodo-4’-aminophenyl)-6-hydroxybenzothiazole for in vivo quantitation of amyloid deposits in Alzheimer’s disease. J Mol Neurosci. 19:11–16.
- Wang Y, Shi M, Chung KA, Zabetian CP, Leverenz JB, Berg D, Srulijes K, Trojanowski JQ, Lee VM, Siderowf AD, et al. 2012. Phosphorylated alpha-synuclein in Parkinson’s disease. Sci Transl Med. 4:121ra120.
- Wang ZY, Han ZM, Liu QF, Tang W, Ye K, Yao YY. 2015. Use of CSF alpha-synuclein in the differential diagnosis between Alzheimer’s disease and other neurodegenerative disorders. Int Psychogeriatr. 27:1429–1438.
- Watson GS, Peskind ER, Asthana S, Purganan K, Wait C, Chapman D, Schwartz MW, Plymate S, Craft S. 2003. Insulin increases CSF Abeta42 levels in normal older adults. Neurology. 60:1899–1903.
- Weiner MW, Veitch DP, Aisen PS, Beckett LA, Cairns NJ, Cedarbaum J, Donohue MC, Green RC, Harvey D, Jack CR Jr, et al. 2015a. Impact of the Alzheimer’s disease neuroimaging initiative, 2004 to 2014. Alzheimer’s Dementia. 11:865–884.
- Weiner MW, Veitch DP, Aisen PS, Beckett LA, Cairns NJ, Cedarbaum J, Green RC, Harvey D, Jack CR, Jagust W, et al. 2015b. 2014 Update of the Alzheimer’s disease neuroimaging initiative: a review of papers published since its inception. Alzheimer’s Dementia. 11:e1–120.
- Weinstein G, Beiser AS, Preis SR, Courchesne P, Chouraki V, Levy D, Seshadri S. 2016. Plasma clusterin levels and risk of dementia, Alzheimer’s disease, and stroke. Alzheimer’s Dementia (Amsterdam, Netherlands). 3:103–109.
- Wellington H, Paterson RW, Portelius E, Tornqvist U, Magdalinou N, Fox NC, Blennow K, Schott JM, Zetterberg H. 2016. Increased CSF neurogranin concentration is specific to Alzheimer disease. Neurology. 86:829–835.
- Westwood S, Leoni E, Hye A, Lynham S, Khondoker MR, Ashton NJ, Kiddle SJ, Baird AL, Sainz-Fuertes R, Leung R, et al. 2016. Blood-based biomarker candidates of cerebral amyloid using PiB PET in non-demented elderly. J Alzheimer’s Dis. 52:561–572.
- Weydt P, Oeckl P, Huss A, Muller K, Volk AE, Kuhle J, Knehr A, Andersen PM, Prudlo J, Steinacker P, et al. 2016. Neurofilament levels as biomarkers in asymptomatic and symptomatic familial amyotrophic lateral sclerosis. Ann Neurol. 79:152–158.
- Wilhelmus MM, Otte-Holler I, van Triel JJ, Veerhuis R, Maat-Schieman ML, Bu G, de Waal RM, Verbeek MM. 2007. Lipoprotein receptor-related protein-1 mediates amyloid-beta-mediated cell death of cerebrovascular cells. Am J Pathol. 171:1989–1999.
- Willemse E, van Uffelen K, Brix B, Engelborghs S, Vanderstichele H, Teunissen C. 2017. How to handle adsorption of cerebrospinal fluid amyloid-beta (1-42) in laboratory practice? Identifying problematic handlings and resolving the issue by use of the Abeta42/Abeta40 ratio. Alzheimer’s Dementia. 13:885–892.
- Willemse EA, Koel-Simmelink MJ, Durieux-Lu S, van der Flier WM, Teunissen CE. 2015. Standard biobanking conditions prevent evaporation of body fluid samples. Clinica Chimica Acta; Int J Clin Chem. 442:141–145.
- Willette AA, Calhoun VD, Egan JM, Kapogiannis D, Alzheimers D, Neuroimaging I. 2014. Prognostic classification of mild cognitive impairment and Alzheimer’s disease: MRI independent component analysis. Psychiatry Res. 224:81–88.
- Wilson ME, Boumaza I, Lacomis D, Bowser R. 2010. Cystatin C: a candidate biomarker for amyotrophic lateral sclerosis. PLoS One. 5:e15133.
- Wilson PW, Myers RH, Larson MG, Ordovas JM, Wolf PA, Schaefer EJ. 1994. Apolipoprotein E alleles, dyslipidemia, and coronary heart disease. The Framingham Offspring Study. JAMA. 272:1666–1671.
- Wiltfang J, Esselmann H, Bibl M, Hüll M, Hampel H, Kessler H, Frölich L, Schröder J, Peters O, Jessen F, et al. 2007. Amyloid beta peptide ratio 42/40 but not A beta 42 correlates with phospho-Tau in patients with low- and high-CSF A beta 40 load. J Neurochem. 101:1053–1059.
- Wiltfang J, Esselmann H, Smirnov A, Bibl M, Cepek L, Steinacker P, Mollenhauer B, Buerger K, Hampel H, Paul S, et al. 2003. Beta-amyloid peptides in cerebrospinal fluid of patients with Creutzfeldt-Jakob disease. Ann Neurol. 54:263–267.
- Wiltfang J, Lewczuk P, Riederer P, Grünblatt E, Hock C, Scheltens P, Hampel H, Vanderstichele H, Iqbal K, Galasko D, et al. 2005. Consensus paper of the WFSBP Task Force on Biological Markers of Dementia: the role of CSF and blood analysis in the early and differential diagnosis of dementia. World J Biol Psychiatry. 6:69–84.
- Wimo A, Ballard C, Brayne C, Gauthier S, Handels R, Jones RW, Jonsson L, Khachaturian AS, Kramberger M. 2014. Health economic evaluation of treatments for Alzheimer’s disease: impact of new diagnostic criteria. J Intern Med. 275:304–316.
- Wimo A, Religa D, Spangberg K, Edlund AK, Winblad B, Eriksdotter M. 2013. Costs of diagnosing dementia: results from SveDem, the Swedish Dementia Registry. Int J Geriatr Psychiatry. 28:1039–1044.
- Winblad B, Amouyel P, Andrieu S, Ballard C, Brayne C, Brodaty H, Cedazo-Minguez A, Dubois B, Edvardsson D, Feldman H, et al. 2016. Defeating Alzheimer’s disease and other dementias: a priority for European science and society. Lancet Neurol. 15:455–532.
- Winblad B, Andreasen N, Minthon L, Floesser A, Imbert G, Dumortier T, Maguire RP, Blennow K, Lundmark J, Staufenbiel M, et al. 2012. Safety, tolerability, and antibody response of active Abeta immunotherapy with CAD106 in patients with Alzheimer’s disease: randomised, double-blind, placebo-controlled, first-in-human study. Lancet Neurol. 11:597–604.
- Winer L, Srinivasan D, Chun S, Lacomis D, Jaffa M, Fagan A, Holtzman DM, Wancewicz E, Bennett CF, Bowser R, et al. 2013. SOD1 in cerebral spinal fluid as a pharmacodynamic marker for antisense oligonucleotide therapy. JAMA Neurol. 70:201–207.
- Winston CN, Goetzl EJ, Akers JC, Carter BS, Rockenstein EM, Galasko D, Masliah E, Rissman RA. 2016. Prediction of conversion from mild cognitive impairment to dementia with neuronally derived blood exosome protein profile. Alzheimer’s Dementia (Amsterdam, Netherlands). 3:63–72.
- Wirth M, Villeneuve S, Haase CM, Madison CM, Oh H, Landau SM, Rabinovici GD, Jagust WJ. 2013. Associations between Alzheimer disease biomarkers, neurodegeneration, and cognition in cognitively normal older people. JAMA Neurol. 70:1512–1519.
- Wisse LE, Butala N, Das SR, Davatzikos C, Dickerson BC, Vaishnavi SN, Yushkevich PA, Wolk DA. 2015. Suspected non-AD pathology in mild cognitive impairment. Neurobiol Aging. 36:3152–3162.
- Wolfsgruber S, Jessen F, Koppara A, Kleineidam L, Schmidtke K, Frölich L, Kurz A, Schulz S, Hampel H, Heuser I, et al. 2015. Subjective cognitive decline is related to CSF biomarkers of AD in patients with MCI. Neurology. 84:1261–1268.
- Wolfsgruber S, Wagner M, Schmidtke K, Frölich L, Kurz A, Schulz S, Hampel H, Heuser I, Peters O, Reischies FM, et al. 2014. Memory concerns, memory performance and risk of dementia in patients with mild cognitive impairment. PLoS One. 9:e100812.
- Wu AH, Fukushima N, Puskas R, Todd J, Goix P. 2006. Development and preliminary clinical validation of a high sensitivity assay for cardiac troponin using a capillary flow (single molecule) fluorescence detector. Clin Chem. 52:2157–2159.
- Xia W. 2008. From presenilinase to gamma-secretase, cleave to capacitate. Curr Alzheimer Res. 5:172–178.
- Yamada K, Cirrito JR, Stewart FR, Jiang H, Finn MB, Holmes BB, Binder LI, Mandelkow EM, Diamond MI, Lee VM, et al. 2011. In vivo microdialysis reveals age-dependent decrease of brain interstitial fluid tau levels in P301S human tau transgenic mice. J Neurosci. 31:13110–13117.
- Yamada M. 2000. Cerebral amyloid angiopathy: an overview. Neuropathol. 20:8–22.
- You JS, Gelfanova V, Knierman MD, Witzmann FA, Wang M, Hale JE. 2005. The impact of blood contamination on the proteome of cerebrospinal fluid. Proteomics. 5:290–296.
- Yu JT, Tan L, Hardy J. 2014. Apolipoprotein E in Alzheimer’s disease: an update. Annu Rev Neurosci. 37:79–100.
- Zetterberg H. 2016. Neurofilament light: a dynamic cross-disease fluid biomarker for neurodegeneration. Neuron. 91:1–3.
- Zetterberg H, Blennow K. 2015. Neurogranin Levels in Cerebrospinal Fluid: A New Addition to the Alzheimer Disease Diagnostic Toolbox. JAMA Neurol. 72:1237–1238.
- Zetterberg H, Jacobsson J, Rosengren L, Blennow K, Andersen PM. 2007. Cerebrospinal fluid neurofilament light levels in amyotrophic lateral sclerosis: impact of SOD1 genotype. Eur J Neurol. 14:1329–1333.
- Zetterberg H, Pedersen M, Lind K, Svensson M, Rolstad S, Eckerstrom C, Syversen S, Mattsson UB, Ysander C, Mattsson N, et al. 2007. Intra-individual stability of CSF biomarkers for Alzheimer’s disease over two years. J Alzheimer’s Dis. 12:255–260.
- Zetterberg H, Skillback T, Mattsson N, Trojanowski JQ, Portelius E, Shaw LM, Weiner MW, Blennow K. 2016. Association of cerebrospinal fluid neurofilament light concentration with Alzheimer disease progression. JAMA Neurol. 73:60–67.
- Zetterberg H, Wahlund LO, Blennow K. 2003. Cerebrospinal fluid markers for prediction of Alzheimer’s disease. Neurosci Lett. 352:67–69.
- Zetterstrom P, Andersen PM, Brannstrom T, Marklund SL. 2011. Misfolded superoxide dismutase-1 in CSF from amyotrophic lateral sclerosis patients. J Neurochem. 117:91–99.
- Zimmermann R, Lelental N, Ganslandt O, Maler JM, Kornhuber J, Lewczuk P. 2011. Preanalytical sample handling and sample stability testing for the neurochemical dementia diagnostics. J Alzheimer’s Dis. 25:739–745.
- Zoccolella S, Simone IL, Capozzo R, Tortelli R, Leo A, D’Errico E, Logroscino G. 2011. An exploratory study of serum urate levels in patients with amyotrophic lateral sclerosis. J Neurol. 258:238–243.
- Zwan MD, Villemagne VL, Dore V, Buckley R, Bourgeat P, Veljanoski R, Salvado O, Williams R, Margison L, Rembach A, et al. 2016. Subjective memory complaints in APOEɛ4 carriers are associated with high amyloid-beta burden. J Alzheimer’s Dis. 49:1115–1122.