
ABSTRACT
Agriculture is a key contributor to poor water quality, but the sources of sediment and nutrient losses from agricultural catchments – including from riverbank erosion – are highly variable. Riverbank erosion is particularly difficult to quantify and control. Here, we developed a quick assessment approach to quantify riverbank erosion rates and associated sediment and nutrient loading rates into waterways using airborne LiDAR combined with field-collected data. We applied this approach and explored its relationships to water quality at four sites within the Blackwater catchment in Northern Ireland for two analysis periods. GIS LiDAR image differencing revealed that volume changes in riverbank elevation equated to average erosion rates which indicated spatial and temporal variability in erosion rates. Combining the erosion rates with in-situ riverbank bulk density and total extractable phosphorus content provided sediment and phosphorus loading rates. The relative differences between estimated erosion at the different sites corresponded well with in-stream suspended sediment variations, but patterns for total phosphorus concentrations were more complex. We conclude that the use of LiDAR combined with field data is an innovative means for riverbank erosion quantification. Furthermore, by using LiDAR-to-LiDAR analyses, the reductions in erosion, sediment, and phosphorus loading rates following riverbank stabilization techniques can be determined.
1. Introduction
The occurrence of riverbank erosion is highly variable between and within catchments, dependent on different factors such as underlying geology, meteorological conditions, hydrological regimes, and land use (Smith et al., Citation2019). As such, the contribution of riverbank erosion to waterway degradation is also highly variable. However, agricultural activities have often been identified as the main contributing sources to pollution for many waterways (Thoma et al., Citation2005; Ulén & Kalisky, Citation2005). Agricultural soils supporting intensive livestock systems, common within regions such as northwest Europe, often contain elevated soil phosphorus (P) accumulations due to long-term over-application rates of P-rich slurry and fertilizers (McDonald et al., Citation2019). When combined with the actions of riverbank erosion, the potential risk for waterway degradation and eutrophication occurrence through sedimentation and nutrient enrichment is enhanced (Sharpley, Citation2003).
To effectively improve water quality and target intervention strategies on a cost-effective and appropriate basis, understanding the dominant contributing source of sediment and nutrient losses at the correct resolution is vital (Thoma et al., Citation2005). However, instream loads of sediment and P in agricultural catchments can originate from both field and riverbank-based sources and it is difficult to determine the loading proportions delivered from these two independent sources to waterways. Sediment fingerprinting on selected British rivers estimated that up to 5–15% of suspended sediment loads can originate from riverbank sources and that this can exceed 40% within certain catchments (Walling & Collins, Citation2005). Issues exist with this methodology due to a need to consider local variations in erosion rates, which are missed with a generalized catchment-scale approach. In practice, identifying and quantifying the contributing source areas of sediment from riverbanks is difficult given the non-uniformity in erosion occurrence.
Several studies have explored the suitability of Light Detection and Ranging (LiDAR) to identify erosion on a catchment scale (km2) for riverine processes, and hillslope-based soil erosion processes (Kessler et al., Citation2012; Mason & Mohrig, Citation2018; Neugrig et al., Citation2014; Thoma et al., Citation2005). LiDAR represents a growing tool for erosion monitoring at a high spatial and temporal resolution (Brecheisen & Richter, Citation2021; Haas et al., Citation2012; Lerma et al., Citation2019). Few studies have, however, investigated the use of LiDAR at a high spatial resolution alongside sub-field scale (m2) data to identify and quantify specific locations of riverbank erosion occurrence. This is a research area of considerable importance given recent shifts in water quality management from the catchment scale to sub-catchment and field scales (Robins et al., Citation2017). High spatial resolution riverbank erosion data will allow for designing site and scale-appropriate management approaches. This is necessary as research has shown that the failures to achieve policies such as the EU Water Framework Directive (WFD) have resulted from schemes focusing on too broad a management scale, failing to account for specific catchment variability, and failing to correctly identify small-scale contributing sources of degradation to waterways (Angelopoulous et al., Citation2017; Balana et al., Citation2011).
High-resolution LiDAR data, therefore, have the potential to be useful for detailed site-specific quantification of erosion over large areas. As the technique operates at multiple spatial scales, it allows a movement away from traditional, field-scale erosion studies by using remote-sensing techniques to identify areas of erosion. Traditional riverbank erosion surveys take several hours to complete and can involve accessing dangerous areas for survey (Haas et al., Citation2012; Kronvang et al., Citation2012). Field-based approaches measuring riverbank erosion involve the use of longitudinal surveys or the installation of erosion pins (Hamshaw et al., Citation2017). However, these studies are resource-intensive and the placement of erosion pins is highly localized, failing to cover large-scale areas, and can be difficult to place depending on the region under survey (Hamshaw et al., Citation2017). Furthermore, the erosion pins can influence bank erosion either through undermining slopes thus encouraging erosion or contributing to slope stability (Hamshaw et al., Citation2017; Kronvang et al., Citation2012). The development of remotely sensed methodologies allows landscape monitoring to occur without compromising the ongoing geomorphological or erosional processes (Haas et al., Citation2012). Previous studies using LiDAR applications for erosion monitoring have combined LiDAR with historical aerial photography to calculate riverbank erosion and meander migration on a five-decadal basis (De Rose & Basher, Citation2011). However, the use of LiDAR-to-LiDAR comparisons is a more accurate means to determine riverbank erosion rates and can be replicated across various spatial scales.
An adaptation of the methodology of Thoma et al. (Citation2005) was used within this research to identify agricultural riverbanks at-risk of waterway pollution transfer and requiring targeted riverbank stabilization. Thoma et al. (Citation2005) used uniform 1 m digital elevation models stripped from LiDAR data, which was flown in consecutive years (2001 and 2002) to determine net volume change rates in riverbank elevation over time via image differencing in GIS. This was used to determine the loading rates of sediment and nutrients from riverbank erosion from a 56 km reach of the Blue Earth River in the USA. To determine sediment and P loading rates, 12 cores of riverbank material were collected across this 56 km reach of the river and analysed for bulk density, textural analysis, total P, and extractable P. Mass wasting rates were determined by multiplying net volume changes with averages of bulk density, and this was converted to sediment inputs with nutrient loads by multiplying the mass of eroded sediment with the concentration of total extractable P within collected cores.
Arguably, the collection of 12 cores of riverbank material across a 56 km reach of the river is not representative of the variability present in riverbanks and underrepresents sediment and P loading rates at a catchment scale. As such, refining the analysis to specific locations of erosion requires the collection of field data at a metre scale as used by this study, which is an important move forwards for effective waterway management on the input sources of sediment and nutrients. Instead of net volume estimates based on a few samples across a catchment, this study aims to explore site-specific high resolution spatial variations in erosion rates and associated sediment and P loading rates across river stretches at four field-scale sites. Comparisons were made between erosion, sediment and P loading rates determined by two different analysis periods of LiDAR imagery; a long-term (2014–2020) period and a short-term period (2020–2021). This study showed the application potential of this LiDAR methodology to evaluate the success of introduced riverbank stabilization techniques in reducing erosion, sediment and P loading rates to waterways. No research within the context of the study region has explored the use of LiDAR to quantify erosion rates, which in turn affects water quality. Moreover, an improved method to determine the effectiveness of introduced riverbank stabilization techniques would be beneficial to aid management design and assessment for a wide range of environments. To achieve the study aim, several cores of riverbank material were collected at each site to provide high-resolution information and combined into an analysis in ArcPro and ArcMap for LiDAR-based image differencing. To complement the river-bank erosion analyses, this study also benefits from previously determined sub-field scale variability in soil P content and the potential transfer risk existing through runoff across the different sites. This allowed us to evaluate the riverbank erosion rates in the context of field-based sources as well. Finally, we compared the approach against independently collected stream water quality (of suspended sediment and total phosphorus) of samples collected upstream and downstream of the study river stretches.
2. Materials and methods
2.1. Study area
Within Northern Ireland (NI), poor water quality is a major issue with only 31.3% of rivers achieving the target of good status as required by the EU Water Framework Directive (Doody et al., Citation2020). Agricultural inputs are a dominant factor in poor water quality, particularly due to legacy sources of nutrient accumulations within soils associated with excessive slurry and fertilizer applications with the intensification of farming within the region (Cassidy et al., Citation2019).
The cross-border Blackwater catchment in NI and the Republic of Ireland (ROI) was used for this research (). The catchment drains an area of 1480 km2, with 90% of land use classed as agricultural – with a focus on sheep, beef, and dairy farming (Bastola et al., Citation2011). The catchment’s geology consists of Carboniferous sandstone, limestone, shale, and mudstone, which is overlaid by pro-glacial boulder till forming a landscape of drumlins and moraines (Bastola et al., Citation2011; Campbell et al., Citation2015). The catchment experiences soil drainage problems, which elevates the risk of diffuse pollution occurrence, due to saturation-excess runoff promoted through a seasonally perched water table and high winter rainfall rates (Bastola et al., Citation2011). Understanding the sources of nutrient and sediment pollution within this catchment is of considerable importance for achieving the aims of the WFD.
Figure 1. With (a) the location of the Blackwater catchment and (b) digital elevation model of the Blackwater catchment, river network, and locations of Sites 1–4.
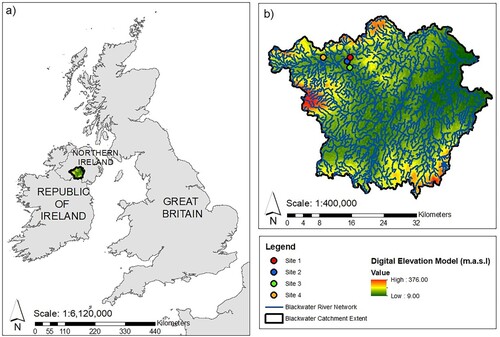
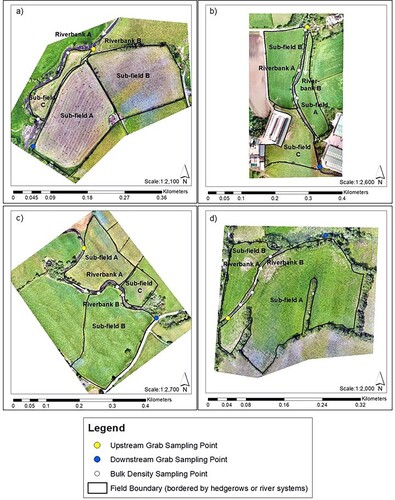
Hayes et al. (Citation2023) previously explored sub-field scale variability in soil P content (and designated sites as either point or diffuse P sources) at six field sites within the Blackwater catchment and the potential transfer risk existing through runoff. A general assumption was made that sites of elevated soil P sources were at greater risk to contain elevated riverbank P sources. At four of these sites, which had LiDAR data available for 2014, 2020, and 2021, LiDAR-to-LiDAR comparisons were made. These were combined with the analysis of collected riverbank cores to quantify riverbank erosion rates and associated nutrient and sediment loading rates. details the general conditions across the sites and their associated riverbanks, with each riverbank designated as either A or B as shown in (a-d). Sites 1–3 were located within the Ballygawley Water sub-catchment (53.4 km2) and Site 4 was within the Knockmany Burn sub-catchment (14.8 km2). details information from Hayes et al. (Citation2023) on soil Olsen P range determined by 35 m gridded sampling and the degree of runoff risk posed for sediment and P transfer.
Table 1. General site characteristics for the four field-scale sites within the Blackwater catchment.
Table 2. Sub-field soil Olsen P range determined by 35 m gridded sampling and the risk of runoff transfer of sediment and P in Hayes et al. (Citation2023).
2.1.1. Introduced riverbank stabilization techniques at sites 2 and 3
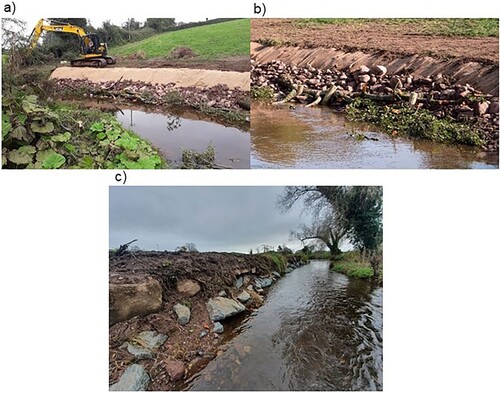
Due to ongoing riverbank erosion at Site 3, a range of riverbank stabilization techniques were independently introduced here by the EU-funded CatchmentCARE project (https://www.catchmentcare.eu/) operating within the wider Blackwater catchment in September 2020. The extensively eroding Riverbank A was targeted for riverbank stabilization using tree stems and coir matting overlying the bank face, which was backfilled with cobblestone to improve strength. Riverbank B underwent rock armouring. (a-b) shows the installation of these techniques along Riverbank A. Due to an increase in riverbank erosion at Site 2 with the collapse of the fence line in December 2020, rock armouring along the length of the riverbank at the meander bend occurred in November 2021 by the landowner. The rock armouring was backfilled with sediment and reseeded to improve stability through root mat vegetation (c).
Figure 2. With (a) installation of riverbank stabilization techniques at Site 3 in September 2020, (b) close-up of coir matting, tree stems, and cobblestone backfill used to support the structure, and (c) rock armouring along riverbank B for Site 2 in November 2021.
2.2. Riverbank core sampling and laboratory analyses
To determine mass wasting rates of sediment and P loading rates, cores of riverbank material were collected at Sites 1–4 on the 18th of August 2020 to undergo analysis for bulk density and total extractable P content. Three samples per riverbank at each site were collected using 10 cm diameter aluminium rings with a volume of 222 cm3. Sampling locations ( (a-d)) were chosen in-field as riverbanks representing typical site conditions. Only riverbanks that were free from vegetation were sampled to reduce the effects of plant roots on core volumes. These were hammered into the bank face below the root mat of any above-ground vegetation before being carefully extracted to ensure an intact core. Samples were then immediately sealed before laboratory refrigeration. Bulk density was determined in the laboratory using Cresswell and Hamilton (Citation2002) and total extractable P following the Olsen P methodology (Olsen & Sommers, Citation1982) as described by the Ministry of Agriculture, Fisheries, and Food (Citation1986).
Figure 3. (a-d) Bulk density sampling locations at Sites 1–4 displayed over summer 2020 drone imagery and upstream and downstream grab sampling points. The predominant flow direction is indicated by an arrow.
2.3. GIS-based processing of LiDAR datasets
To perform image differencing and calculate volume change rates, different dates of LiDAR imagery were required. To calculate the long-term rate of erosion, a 2014 OSNI (Ordnance Survey Northern Ireland) LiDAR dataset – as uniform 1 m DTM (digital terrain model) files – was used (at a resolution of ±0.15 m). These DTM files covered the four sites and gave a baseline date from which to calculate erosion. To provide a comparison dataset from which to calculate erosion rates, drone flights conducted during the summer of 2020 produced DSM (digital surface model) files covering each of the sites at a resolution of ±0.15 m. The data were then converted to a DTM to remove vegetation returns, with some small areas of vegetation requiring manual removal in ArcPro. The 2021 LiDAR data was available as uniform 1 m DTM files from BlueSky (obtained via CatchmentCARE and AFBI (Agri Food and Biosciences Institute, at a resolution of ±0.10 m)). As these DTM datasets consisted of an identical number of X and Y coordinates over an identical spatial extent (ensured through clipping the datasets to each site’s boundaries) only a difference in the Z (elevation) dimension existed. The high resolution of each LiDAR dataset allows small-scale changes in riverbank features to be determined, however this analysis (over both time periods) focuses on the change in riverbank height to infer riverbank erosion rates and does not consider other instream erosional features or changes.
2.3.1. GIS-based analysis of LiDAR to calculate riverbank erosion, sediment, and nutrient loading rates
2014, 2020 and 2021 DTM datasets were first clipped to the extent of the sites before producing an image differenced raster under the expression of; ‘2014 LiDAR DTM Dataset – 2020 LiDAR DTM dataset’ to calculate the longer-term erosion rates and for the shorter-term rates, an expression of ‘2020 LiDAR DTM Dataset – 2021 LiDAR DTM Dataset’ to produce another image differenced raster. Under these expressions, positive values represented erosion, with negative values indicating deposition. To refine this to site-specific riverbank areas, manual digitizing of the riverbanks was performed for each site with an assessment of the specific bank width based on site-specific knowledge. For each of the sites, buffer zones were created for one side of the bank face i.e. that facing into the site itself. The buffer zones were 2 m for Site 2, 3 m for Sites 1 and 3, and 4 m for Site 4, based on specific in-field characteristics and variations in riverbank extents.
These new buffered zones were used to clip the 2014–2020/2020–2021 image differencing rasters to the spatial extent of the riverbanks. Riverbanks were then designated as either Riverbank A or B as shown in (a-d). This allowed any differences in bank erosion to be investigated concerning channel morphology causing a greater regression rate on one particular riverbank. While Thoma et al. (Citation2005) explored net volume change as a result of erosion and deposition on a catchment scale, this research focused on site-specific riverbank erosion and its potential to release sediment and nutrients into waterways. As such, any negative areas representing deposition were removed from the riverbank-clipped differencing rasters. These new rasters containing only positive values of erosion were used to calculate the sum total of elevation differences at each vertex for each riverbank. This summed value was then divided by the spatial extent covered by the riverbank to give an average change in elevation per vertex which represented the average rate of erosion. This elevation difference was indicative of riverbank height, which can alter due to erosion or deposition occurrence.
To give an average annual erosion rate on the longer term period from 2014–2020 this value was divided by six, representing the six years difference between the LiDAR images (this was not performed on the shorter term period from 2020–2021). To calculate a mean mass wasting rate the per annum average erosion rate was multiplied by the mean bulk density. To calculate the average annual input of sediment for the entire riverbank, the average mass wasting rate was multiplied by the spatial extent of the riverbanks. Finally, to calculate the average annual inputs of total extractable P due to riverbank erosion, the average input of sediment was multiplied by the average total extractable P concentration to determine average P loading rates. These values of average annual erosion rate, average annual mass wasting inputs of sediment, and average total extractable P loading rates were individually calculated for each riverbank and then summed, giving an average overall site value for 2014–2020 and 2020–2021. Information on the accuracy of calculated volume change and loading rates is provided in Table B of the Supplementary Materials.
The short-term (2020–2021) LiDAR analysis results for riverbank erosion, sediment and P loading rates were used in comparison to long-term (2014–2020) results to determine the effectiveness of the introduced riverbank stabilization techniques on reducing the erosion and associated loading rates at Site 3. An assessment of the effectiveness of the introduced stabilization feature at Site 2 was not performed as no LiDAR data for 2022 was available for image differencing analysis.
2.4. Water quality monitoring
To assess the results in the context of in-stream water quality, we explored if a relationship existed between sites categorized as having elevated soil P content and high loading rates of sediment and P from riverbank-based erosion, water quality monitoring using monthly grab sampling was conducted from August 2020 to August 2021. (a-d) shows the location of upstream and downstream grab sampling points for each site, with samples collected instream using 2-litre sampling bottles. The average total suspended sediment concentration (TSS) (mg L−1) and total phosphorus (TP) (µg L−1) were compared to calculated annual average riverbank erosion sediment and P loading rates and to assumptions made in Hayes et al. (Citation2023) (detailed in ) on the degree of risk posed for P and sediment transfer by surface runoff. Samples underwent analysis at AFBI Newforge Lane Water Quality Unit Freshwater Laboratory using standard laboratory analysis techniques. It should be noted that the water sampling commenced shortly before the introduction of riverbank stabilization techniques at Site 3, with sampling occurring on 13 monthly occasions.
3. Results
3.1. Long-term (2014–2020) average erosion, mass wasting, and total extractable P input rates
Following laboratory processing of the collected riverbank cores, the results for bulk density and total extractable P were averaged per site (). details the average annual rate of erosion, mass wasting inputs of sediment, and total extractable P due to bank erosion from 2014–2020.
Table 3. Averaged results for bulk density and total extractable P for each site determined from six riverbank cores collected per site.
Table 4. Average annual riverbank erosion, sediment, and P loading rates calculated for Sites 1–4 from 2014–2020.
As demonstrated by , there is wide variability present in the average annual erosion rates of the sites, ranging from the lowest value of 0.21 cm yr−1 at Site 2 to a maximum value of 79.19 cm yr−1 at Site 3. This highlights the variable nature of riverbank erosion in its magnitude and spatial occurrence. For each site, differences are present in the annual average erosion rate calculated for each riverbank. The magnitude of these differences is highly variable, for example, Site 3 Riverbank A records an average annual erosion rate of 50.28 cm yr−1, and Riverbank B shows a considerably lower average annual erosion rate of 28.91 cm yr−1. Site 2 interestingly shows that active riverbank erosion was only occurring on Riverbank B, with Riverbank A undergoing deposition. Elevated erosion rates at Site 4 relate to the lack of fencing at this site preventing grazing livestock from accessing the waterways, which has led to riverbank destabilization through trampling. The average annual mass wasting rates vary across the sites in line with variations in the magnitude of average annual erosion rates. In line with deposition occurring on Riverbank A, Site 2 has the lowest average annual mass wasting input of 0.35 kg yr−1 of sediment, of all the studied sites and the lowest overall P exports at 7.62 mg yr−1, despite the extensive diffuse in-field P sources present. The highest quantities of sediment are released at Site 3, at an overall loading rate of 128.14 kg yr−1.
With the high erosion rates of Site 3, the highest quantities of P are released at an annual average of 2934.55 mg yr−1. Interestingly, previous soil sampling research at this site indicated that in-field soil P content was mostly at the agronomic optimum, which suggested a low risk of transfer (Hayes et al., Citation2023). The high annual loading rates of sediment and P highlight the issues for achieving good water quality. These erosion zones are a major source of diffuse sediment and P losses and require management intervention to improve water quality. As such, a range of riverbank stabilization techniques was introduced by the EU-funded CatchmentCARE project as described in Section 2.1.1.
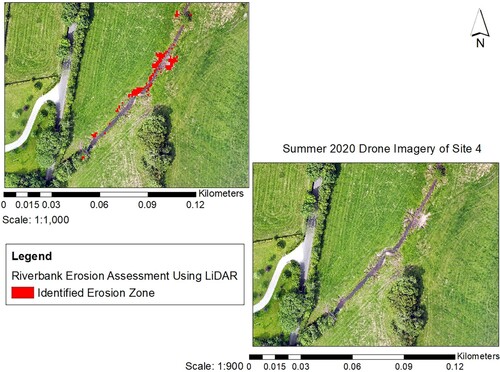
Site 4 was demonstrated in previous research to have wide variability in soil P content with both deficiencies and diffuse sources identified (Hayes et al., Citation2023). Whilst this site has the second-highest rate of erosion, due to the overall lower total extractable P present, the input of P to waterways is the second-lowest of the sites at 17.85 mg yr−1 from 2014–2020. Erosion zones identified by image differencing correlate closely to drone imagery of Site 4 in the summer of 2020 showing visible areas of livestock access scarring in .
Figure 4. Identified erosion zones using image differencing and zonal statistics in ArcGIS displayed over the summer of 2020 drone imagery of Site 4.
The parallel between in-field and riverbank-based P sources (as shown by Sites 2, 3, and 4) highlights the need to have wide-ranging datasets covering all nutrient and sediment sources that contributed to poor water quality to target management techniques for effective catchment management.
3.2. Short-term (2020–2021) average erosion, mass wasting, and total extractable P input rates
details the average annual riverbank erosion, sediment and P loading rates calculated for Sites 1–4 for the 2020–2021 period. Bulk density and P data were based on values specified in .
Table 5. Average annual riverbank erosion, sediment and P loading rates calculated for Sites 1–4 from 2020–2021.
shows that the erosion, sediment and P loading rates remain elevated for Site 3 from 2020–2021 indicating ongoing erosion within this area but at much lower rates. Conversely, at Site 2, recent short-term rates are much higher than the long-term rates, reflecting changes in channel morphology and predominant flow conditions from the 2014–2020 period. Erosion was visible at Site 2 during fieldwork, with the collapse of the fence line into the waterway due to erosion in December 2020, resulting in Riverbank A undergoing stabilization in November 2021. Although the short-term erosion, sediment and P loading rates at Site 1 are slightly higher than the longer-term rates, overall these are still relatively low. No significant changes to the channel morphology were noted at this site. Site 4 showed a decline in erosion, sediment and P loading rates, which may relate to the reduced frequency of grazing livestock and a reduced livestock stocking rate here from 2020–2021 as a part of agricultural management to allow this grassland to recover for future grazing strategies.
3.3. Analysing the effectiveness of riverbank stabilization techniques to reduce annual average erosion, sediment, and P loading rates
As outlined above, riverbank stabilization techniques were introduced at Site 3 in September 2020. details the associated percentage decreases in the average annual erosion, sediment and P loadings rates as a result of the riverbank stabilization technique (based on comparisons between the rates calculated in and ).
Table 6. Percentage decrease in average annual riverbank erosion, sediment, and P loading rates calculated for Site 3 from 2014/2020 in compared to 2020/2021 calculations in .
The introduction of bank stabilization techniques significantly reduces erosion rates and associated sediment and P loading (), indicating the benefit of introducing such techniques to sites undergoing severe erosion. demonstrates the relative spatial variation in the magnitude of erosion and deposition at a rate per pixel for the 2014–2020 rasters to the 2020–2021 rasters.
Figure 5. Comparison between the spatial variation in the magnitude of erosion and deposition as a rate per pixel in ArcMap for Site 3 before and after the introduction of riverbank stabilization techniques. Darker colours represent higher erosion and deposition occurrence and lighter colours represent lower erosion and deposition occurrence.
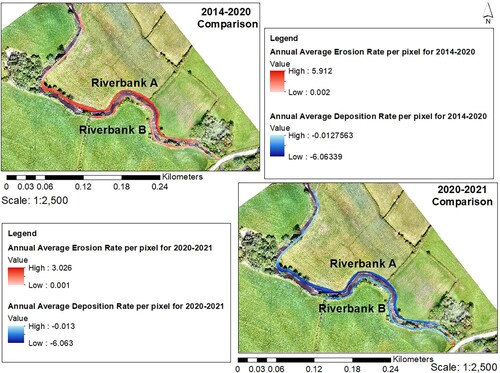
demonstrates the magnitude of variability in erosion and deposition from the 2014–2020 period to the 2020–2021 period. Before the introduction of riverbank stabilization, both riverbanks underwent considerable erosion in the 2014–2020 period. Some small deposition zones were identified during this period, one of which was located at the furthest downstream point for Site 3. It is likely that this area of deposition, which in-field consists of banked sediment, originated from upstream erosive processes and suggested that channel morphology encouraged deposition here. Another deposition zone was identified towards the upstream river channel portions of this site. This particular point of deposition may have occurred due to upstream erosion and deposition activities.
With the introduction of riverbank stabilization, there are major changes in the areas of active erosion, as both riverbanks are now identified as deposition zones in the 2020–2021 comparison as the image differencing process registering the stabilization techniques as an increase in riverbank height. However, the categorization of this height change as deposition was not due to natural deposition by channel morphology. demonstrates this, with higher values of deposition present in the 2020–2021 LiDAR comparison at the point of the riverbank stabilization techniques. Riverbank erosion is now occurring within the previously identified deposition zone located at the downstream area. Visual inspection of this area confirmed this with a reduction in the size of this banked area of sediment. The occurrence of erosion within this former deposition zone likely relates to the changes in flow morphology through the stabilization techniques altering the predominant erosive concentration and flow pathways.
3.4. Comparisons between average annual water quality parameters, in-field soil P content and associated runoff risk of sediment and P transfer and average annual loading rates of sediment and P from riverbank erosion
As water quality monitoring for TP and TSS took place from August 2020 to August 2021 this allows comparisons between the sediment and P loading rates calculated for the shorter term 2020–2021 LiDAR analysis periods to in-stream conditions to be made. details the average water quality parameters for TSS and TP for upstream and downstream sampling locations for Sites 1–4, while shows a time series of observed discharge, TSS, and TP at the downstream sampling locations for Sites 1–4 to consider water quality in the context of riverbank erosion-based losses. Table A in the supplementary materials section details the summary statistics for all of the data.
Figure 6. Time series plots of observed discharge in m3 s−1 (top), Total Suspended Sediment (TSS) in mg L−1 (middle), and Total Phosphorus (TP) in µg L−1 (bottom) at the downstream sampling locations of Sites 1–4.
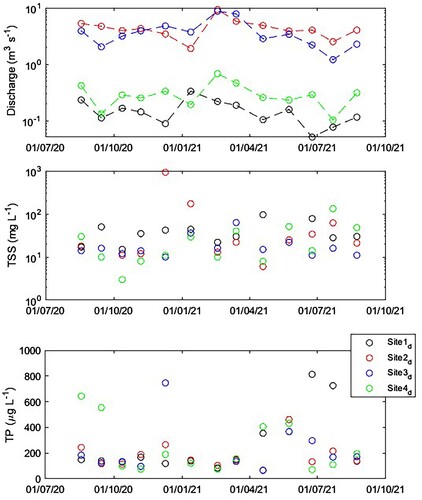
Table 7. Average annual upstream and downstream water quality for TSS (mg L−1) and TP (µg L−1) for Sites 1–4 from August 2020-August 2021.
shows that discharge magnitude varies across the sites with catchment areas. The temporal dynamics in discharge were similar across the sites. The highest discharge was recorded for Sites 2–4 in February 2021, Site 1 recorded its highest discharge in January 2021. The maximum concentrations of TSS and TP were observed for low to mid-range discharges, but generally, we did not find any clear relationships between discharge and TSS nor between discharge and TP.
Overall, water quality monitoring data shows a closer pattern to shorter-term LiDAR analysis (2020–2021) compared to the longer-term LiDAR analysis highlighting the dynamic patterns in water quality both temporally and spatially. The relative average water quality parameters in also compare reasonably well to the loading rates of sediment and P inferred by riverbank erosion in and to the degree of risk posed by in-field sources of P for runoff transfer from Hayes et al. (Citation2023). It should be noted that the water sampling commenced shortly before the introduction of riverbank stabilization techniques at Site 3.
Sites 1, 3 and 4 showed a similar range of downstream TSS concentrations. The highest TSS rates occurred from Site 2, with a large increase in downstream TSS (). This increase likely correlates to the changes in predominant flow conditions and channel morphology concentrating erosion onto Riverbank A (with the subsequent collapse of the fence line into the waterway in December 2020 which recorded high TSS on this sampling occasion of 924.00 mg L−1 shown in ). In agreement, 2020–2021 riverbank-erosion-based sediment loading rates at this site were the highest of Sites 1–4 at 69.64 kg yr−1.
Sites 1 and 3 revealed decreases in TSS from upstream to downstream locations, despite both sites recording increased mass wasting rates. Site 1 recorded an increase in erosion rates from the 2014–2020 period compared to 2020–2021. Site 1, however, shows the highest upstream and second-highest downstream overall average TSS concentrations. This may relate to the high hydrological connectivity of this area as determined by Hayes et al. (Citation2023) causing increased sediment losses through runoff. Site 3 has the lower overall instream TSS concentration for August 2020-August 2021, which corresponds to the aim of lowering sediment losses with riverbank stabilization techniques at this site (introduced in September 2020). This is also supported by the time series in , showing that TSS concentrations were high immediately following the introduction of the stabilization features e.g. losses of 45.00 mg L−1, but have subsequently declined to values of 10.00–12.00 mg L−1. Despite the relatively lower erosion rates for 2020–2021 than 2014–2020, Site 4 still showed a doubling in TSS concentrations from upstream to downstream sampling locations in 2020–2021. The elevated downstream TSS may relate to riverbed erosion occurring at various cattle access points between the upstream and downstream sampling locations, but it should be noted that overall, the TSS concentrations at Site 4 are still among the lowest observed across all sites.
The observations for TP are more complex than for TSS. Sites 1 and 4 generally have increased concentrations from upstream to downstream sampling points, while Sites 2 and 3 have slightly lower concentrations. However, overall, the percentage increases and decreases are relatively small and may not be significant (). Site 1 had the highest overall average TP concentrations. This may relate to the increased hydrological connectivity and potential for runoff to transfer extensive in-field diffuse P sources at these sites (). Furthermore, calculated riverbank-erosion-based P loading rates are high for Site 1 at an annual average of 246.25 mg yr−1. For Site 4 specifically, there was a relatively large increase in downstream TP despite this site having the lowest average P losses at 5.76 mg yr−1 for 2020–2021. Given the reduction in livestock stocking rates and grazing densities at this site, this downstream increase may suggest in-stream processes occurring which may release P. Site 2 showed a large decline from upstream to downstream TP, despite having the highest P loading rates in the 2020–2021 LiDAR analysis at 712.07 mg yr−1. In Hayes et al. (Citation2023), this site had extensive diffuse soil P sources in-field, however low hydrological connectivity was inferred due to predominantly intra-field drainage. These instream water quality conditions may indicate that LiDAR-derived P loading rates are overestimating riverbank-based P contributions. The higher upstream TP results suggest that a specific upstream source is contributing to elevated TP loading at this site, with downstream attenuation lowering average annual TP loading. Site 3 had the lowest TP loading rates of the sites, with little variation between up and downstream readings, following riverbank stabilization, P loading rates had decreased at this site suggesting that riverbank stabilization here has had positive impacts on water quality.
Downstream TP results for the sites were often similar but this did not occur on every sampling occasion, highlighting the variable nature of water quality (). Site 4 had somewhat higher TP compared to the other sites, suggesting TP loading occurs from this site, possibly specific instream processes. Some sampling periods for Sites 1, 3 and 4 showed elevated TP losses indicating that an event has occurred to release TP at these sites such as riverbank erosion.
4. Discussion
4.1. Development of a methodology for rapidly evaluating riverbank erosion, sediment, and P loading rates at the field-scale
For agricultural catchments, the sources of sediment and nutrients can be from soil erosion or runoff from land or riverbanks in fluvial environments. It is important to understand all these input sources and their relative contributing proportions to appropriately tackle waterway pollution. Riverbank-based sources are difficult to quantify as diffuse sources due to the localized and site-specific nature of erosion and deposition due to channel flow and morphology. The ability to calculate the potential loading rates of sediment and nutrients is an important advancement in catchment management to determine the proportion of contributing source areas (Ishee et al., Citation2015; Longoni et al., Citation2016; Thoma et al., Citation2005). This research methodology advances upon that of the original study by Thoma et al. (Citation2005) by focusing field data collection of riverbank core material to field-specific areas to explore erosion at the site scale rather than the generalized catchment scale.
Other research, such as Rose and Basher (Citation2011) have applied sequential LiDAR with historical aerial photography to investigate riverbank erosion. However, issues exist with such an approach due to the accuracy of aerial photography compared to LiDAR. Kessler et al. (Citation2012) similarly followed the methodology of Thoma et al. (Citation2005) to investigate riverbank erosion and sediment and P loading rates for 496 km of several rivers within the USA. Similar to Thoma et al. (Citation2005), a low number of samples were collected from riverbanks by Kessler et al. (Citation2012) to determine the bulk density and total extractable P content from only 26 samples. Arguably, this is too low a sample number to be representative of the degree of variability present in sediment and P for a large number of river lengths compared to the high-resolution samples collected on a sub-field scale basis by this study. Such a notion was explored further in later research by Kessler et al. (Citation2013) which determined that extrapolating volume change rates to an entire river reach is erroneous due to a need for specific data on instream water quality to understand riverbank erosion and associated sediment and P loading rates.
It should be recognized that the application of this research can be limited in terms of the costs of LiDAR and availability of data, however, there are continual advancements in remote sensing, data acquisition, and availability. Currently, in-field data collection is still necessary to determine riverbank sediment and P loading rates accurately. This research advances the applications for determining riverbank erosion rates by providing a universally applicable method to assess erosion rates. It also includes the option to derive sediment and nutrient loading rates by conducting field-based sampling and the ability to apply such a methodology to monitor introduced riverbank stabilization techniques. Furthermore, combined approaches of understanding the transfer risks for soil P and sediment sources, riverbank-based sources, and instream water quality monitoring is an important move forward in improving water quality by fully understanding the main contributing sources and transfer mechanisms for nutrient and sediment losses.
4.2. The degree of variability present in erosion, sediment, and P loading rates at the field-scale
As demonstrated in and and in Sections 3.1–3.2, variability is present within the sites and between the two periods in terms of erosion magnitude and occurrence and the associated sediment and P loading rates, despite these sites being located in a similar agricultural catchment. As erosion processes can be highly dynamic and typically not gradual, it is not unusual to find that short-term erosion and deposition rates are different from long-term observations. Nevertheless, here we were able to explore what the effects of management interventions might have been in the short-term within that context.
For 2014–2020, for Site 1, it is evident that Riverbank B undergoes a greater average annual rate of erosion (1.4 cm yr−1) than Riverbank A (0.4 cm yr−1). Such variation is expected naturally owing to fluvio-geomorphological processes, but could also be related to riverbank management. In 2020, Riverbank B had undergone rock armouring to combat the ongoing erosion here. By 2020–2021, erosion has increased at this site to an overall site rate of 8.6 cm yr−1, with Riverbank A (4.9 cm yr−1) now undergoing a greater rate of regression compared to Riverbank B (3.6 cm yr−1). This may indicate that at least on a short-term basis, the erosion patterns at this site are being altered and may require future intervention strategies to reduce erosion.
Site 2 also demonstrated site-specific variability in riverbank erosion occurrence with Riverbank A undergoing deposition and Riverbank B undergoing erosion in 2014–2020. The specific concentration of erosion along Riverbank B is related to channel morphology and the concentration of specific flows and erosive pathways, similar to Site 1. By 2020–2021, erosion has increased significantly at this site to an overall site rate of 38.07 cm yr−1 compared to 0.21 cm yr−1 in 2014–2020.
Whilst Site 3 is identified to have extensive overall erosion occurring in 2014–2020, analysis between both riverbanks revealed the concentration of erosion onto Riverbank A (50.28 cm yr−1) compared to Riverbank B (28.91 cm yr−1). For 2020–2021, erosion is still predominantly concentrated on Riverbank A (6.95 cm yr−1) compared to Riverbank B (2.83 cm yr−1) indicating that channel morphology and flow conditions have remained similar for this site on a short-term basis. The high regression rate at Site 3 in 2014–2020 has serious implications for water quality (shorter-term rates in 2020–2021 remain elevated for water quality conditions). Excessive sedimentation has negative impacts on river system functioning in terms of fish health, with sedimentation altering fish behaviour, habitats, food availability of aquatic invertebrates, reducing stream visibility, and destroying spawning gravel areas (Watts et al., Citation2003). There is an associated increased risk of eutrophication occurrence due to nutrient enrichment at this waterway.
Site 4 had site-specific issues whereby grazing livestock is allowed direct access to this waterway, which increases the risk of sediment and nutrient transfer and this risk is increased further by the potential for direct animal excretion into the waterway (Henshaw et al., Citation2013 Wilson & Everard, Citation2017;). Across the earlier longer-term period, this site had the second-highest overall average annual erosion rate (). Research has found linkages between livestock grazing in riparian areas causing riverbank erosion on an increased frequency compared to ungrazed locations of three to six times the rate (Smith et al., Citation2019). In the short-term analysis from 2020–2021, the erosion rate at this site has reduced and so have the associated sediment and P loading rates, to the lowest levels across all sites. This could relate to the reduced frequency and density of livestock stocking rates at this particular grassland reducing the severity of riverbank poaching here suggesting that changes in agricultural management can have impacts on instream water quality on a short-term basis.
Whilst the calculations of riverbank erosion and associated sediment and P loading rates are average rates and inputs, considerations must be made on the variable and dynamic nature of fluvial systems in terms of alternations in discharge and flow regimes concerning meteorological changes and how this influences erosion rates. This is evident with comparisons between the long- and short-term in and showing variations in the relative magnitudes of erosion occurrence both between and within the sites. Studies within similar farming regions had found that fluvial processes were one of the main controls on overall morphological activity, however, the degree of this control varies over different spatial scales and specific river zones (Henshaw et al., Citation2013). Other subaerial processes such as the repeated actions of wetting and drying of the riverbank face (often associated with higher river flows and soil moisture content) and resulting desiccation cracks provided lines of weakness for influencing mass wasting (Couper & Maddock, Citation2001). Freeze–thaw processes associated with the actions of swelling, creep, and the downfall of bank materials can further weaken and cause the break-up of bank face materials (Augustowski & Kukulak, Citation2021). Further processes which may influence erosion on a site-specific basis include river flow conditions, antecedent bank moisture conditions, and the extent of vegetation cover for bank stabilization (Henshaw et al., Citation2013). Agricultural activities such as the expansion of agriculture, changes in land use practises, and the removal of bankside vegetation for increased land areas, have a major influence on riverbank erosion rates (Barman, Citation2016; Blankenberg & Skarbøvik, Citation2020; Macfall et al., Citation2014). The results from restoration work at Site 3 demonstrate that the action of installing fencing at this site can have major benefits for reduced riverbank erosion and improved riparian habitats whilst also reducing sediment and P loading rates.
4.3. Assessing the effectiveness of riverbank stabilization techniques to reduce erosion, and suspended sediment and P rates
Obtaining LiDAR data flown after the introduction of a riverbank stabilization technique and following the methodology outlined in Section 2.3 allowed for an assessment of the effectiveness of such a technique to reduce erosion, sediment, and P loading rates at Site 3. Through the introduction of riverbank stabilization techniques at Site 3, and indicate that there had been a significant reduction in erosion rates, sediment and P loading rates, indicating the benefit of these strategies. Furthermore, such an analysis and visualization technique of identifying eroding sections at a field-specific scale as shown in allows the targeting of effective, localized management intervention schemes at areas of the highest erosion magnitude. This will aid in effectively introducing intervention strategies and avoiding resource and financial wastages when planning and implementing these strategies.
Of interest is the movement of erosion zones to the downstream area of Site 3 (which was not included in stabilization techniques). Longer-term monitoring of this site will be important to understand the potential consequences of this introduced stabilization on areas downstream of this site, and to determine how long this artificial riverbank structure will act as a barrier to erosion and whether it can withstand erosion for a long enough period to be a cost-effective management option . Studies have suggested that stabilization techniques are only effective and appropriate in their associated locale, often causing downstream erosion to occur (Russell et al., Citation2021).
4.4. Relationship between average annual water quality parameters, riverbank erosion, sediment, and P loading rates, and at-risk in-field soil P content for surface runoff transfer
While we found correlations between the erosion and suspended sediment rates, this study highlighted that sites which were considered to have extensive diffuse soil P sources available for losses did not correlate strongly to having increased loading rates of P through riverbank erosion. Nor did an increased rate of erosion and associated sediment and P derived by LiDAR necessarily relate directly to elevated in-stream conditions. To understand this variability between nutrient and sediment sources, comparisons between average water quality parameters to average riverbank erosion-based sediment and P loading rates and in-field soil P sources and the degree of transfer risk via runoff were made. There appears to be a relationship between high hydrological connectivity for the transfer of soil P sources and increased waterway P loading, particularly for Site 1. Furthermore, at this site, the higher elevated P content of riverbank cores contributes to higher P loading rates, in 2014–2020 this site had the second-lowest erosion rate of all four sites, by 2020–2021, a nearly fivefold increase in the rate of erosion explains the high TP levels recorded here.
Analysis of short and long-term LiDAR analyses of erosion, sediment and P loading rates compared to in-stream water quality showed that shorter-term patterns closer matched water quality data highlighting the dynamic nature of instream water quality which can be impacted by concentrated shorter-term erosion events (i.e. a significant increase in erosion at Site 2 in 2020–2021, compared to the longer-term erosion occurring at Site 3 for both 2014–2020 and 2020–2021). Understanding the trends in both long and short-term erosion processes is of great importance from a water quality perspective for erosion management approaches. It should be noted that in-stream water quality conditions are not solely a function of riverbank erosion but also in-stream processes, which require further consideration for a full understanding of the contributing sources to sediment and P concentrations within waterways. Given the focus of this study on riverbank erosion (and associated sediment and P loading rates) and the coarse monthly sampling regime used to monitor water quality, this may explain some of the variations in water quality data trends compared to the riverbank erosion analysis due to other instream processes releasing sediment and P.. These processes will continue to alter with changes in climatological conditions and highlights the importance of understanding local field-scale conditions to introduce intervention schemes for the correct contributing sources.
4.5. Wider implications
Here, we developed a quick assessment technique for characterizing riverbank erosion using LiDAR-to-LiDAR comparisons combined with in-field sampling. As erosion rates are expected to change under more intense hydrological regimes under future climate projections (East & Sankey, Citation2020), this technique for quantifying annual rates of erosion may become even more urgently required. The Blackwater catchment is characterized by high winter rainfall rates and the NI region has a mean annual rainfall of 1136 mm (Campbell et al., Citation2015; Kendon et al., Citation2021). Under a changing climate, there are projections of a 10% decrease in total rainfall on an average annual basis, however, more high-intensity winter storm events are projected with amplification of seasonal cycles in hydrology and increased winter rainfall amounts (Lowe et al., Citation2018 Steele-Dunne et al., Citation2008;). Overall lower summer rainfall totals are projected but occur via higher-intensity rainfall events in fewer days (Lowe et al., Citation2018). Hydrological regimes of rivers are altered through rainfall as this influences discharge. With increased discharge and flows, rivers have increased erosive power (relating to stream power which is influenced by both discharge and slope) and this increases the likelihood of bank erosion (Brown et al., Citation2020). The occurrence of repeated rainfall events (typical of the winter period) can increase erosion vulnerability through repeated wetting of the riverbank face, weakening the soil structure and leaving it prone to erosion (Naimah & Roslan, Citation2015). This combined with higher discharge in the winter period will again increase erosion likelihood. Furthermore, with projected increases in the magnitude and frequency of river flows and flood events, there is an increased potential for increasing rates of riverbank erosion and associated sediment and P loading rates (Kay et al., Citation2020, Citation2021).
Recent research suggested that large-scale variations in climatic drivers, e.g. the North Atlantic Oscillation exert large controls on water quality through changes in factors such as rainfall intensity and soil temperature influencing nutrient mobility within catchments (Mellander & Jordan, Citation2021). As such, annual trends in water quality can be drastically influenced and it has been suggested that the complexity of large-systems variations can mean that particular changes may dramatically alter catchment water quality (Mellander & Jordan, Citation2021). In response to such variability, research had highlighted the need to target mitigation techniques to the specific delivery points of nutrient pollution sources (Mellander & Jordan, Citation2021). As such, the ability of this methodology to visualize specific spatial locations acting as nutrient and sediment delivery sources from riverbank erosion is an important tool for introducing targeted and specific mitigation techniques. Furthermore, this methodology has shown the potential for the use of LiDAR-to-LiDAR comparisons to monitor the effectiveness of introduced riverbank stabilization techniques in reducing erosion, sediment and P-loading rates. Such a tool is useful to monitor the success of schemes as well as assess their long-term impacts through monitoring erosion changes in the surrounding riverbank areas.
5. Conclusion
Through the use of image differencing, areas that are undergoing erosion (or deposition), can be identified remotely. LiDAR used in this manner, therefore, represents an exciting new field for achieving the aims of the WFD for improved water quality. Although there are limitations in terms of LiDAR’s accuracy, particularly for heavily vegetated areas, currently no other survey method exists to determine mass wasting rates that are as efficient as LiDAR. Furthermore, LiDAR is a unique tool for erosion prediction and monitoring able to operate at multiple scales and various temporal resolutions. Given the issues surrounding the need to move away from catchment-scale studies, LiDAR is the opportune means to focus riverbank studies on erosion contribution to a site-specific level, especially when combined with relatively simple in-field measurements. The use of LiDAR-based image differencing analyses to locate and quantify erosion, sediment and nutrient loading rates provides a rationale for the selection of riverbanks and locations to undergo stabilization where erosion presents a management issue across multiple regions. Furthermore, LiDAR-to-LiDAR comparisons allowed an assessment of the effectiveness of introduced riverbank stabilization techniques in reducing the erosion rate and associated sediment and P rates. Using LiDAR within catchments experiencing issues with water quality and riverbank erosion can help to identify zones for the appropriate targeting of resources and avoid the issues surrounding blanket management policies that can often lead to negative downstream effects. However, it should be noted that site-specific knowledge must be included within such studies to state all of the potential sources contributing to sediment and nutrient losses to manage water quality effectively.
FigureList.docx
Download MS Word (12.5 KB)Acknowledgements
Thanks go to AFBI (Agri-Food and Biosciences Institute) for access to BlueSky 2021 LiDAR data, OpenData NI for access to 2014 LiDAR DTM data, the Queen’s University Belfast Centre for GIS and Geomatics for access to 2020 LiDAR data, and Gillian Nicholl (AFBI) for assistance with field data collection. Thanks also go to AFBI Water Quality Unit Freshwater Laboratory Newforge Lane for water quality analysis.
Disclosure statement
No potential conflict of interest was reported by the author(s).
Data availability statement
No data is publicly available due to anonymity granted to landowners participating in this research.
Additional information
Funding
References
- Angelopoulous, N. V., Cowx, I. G., & Buijse, A. D. (2017). Integrated planning framework for successful river restoration projects: Upscaling lessons learnt from European case studies. Environmental Science and Policy, 76, 12–22. https://doi.org/10.1016/j.envsci.2017.06.005
- Augustowski, K., & Kukulak, J. (2021). The role of frost processes in the retreat of River Banks. Water, 13(13), 1812. https://doi.org/10.3390/w13131812
- Balana, B. B., Vinten, A., & Slee, B. (2011). A review on cost-effectiveness analysis of agri-environmental measures related to the EU WFD: Key issues, methods, and applications. Ecological Economics, 70(6), 1021–1031. https://doi.org/10.1016/j.ecolecon.2010.12.020
- Barman, T. (2016). Relation of riverbank erosion With agricultural landuse practices on floodplain of River Jaldhaka (Mansai) at Tikiner Char, Bhowerthana Village, Coochbehar, Westbengal, India. International Journal of Research in Geography, 2(2), 1–7. https://doi.org/10.20431/2454-8685.0202001
- Bastola, S., Murphy, C., & Sweeney, J. (2011). The role of hydrological modelling uncertainties in climate change impact assessments of Irish river catchments. Advances in Water Resources, 34(5), 562–576. https://doi.org/10.1016/j.advwatres.2011.01.008
- Blankenberg, A. G. B., & Skarbøvik, E. (2020). Phosphorus retention, erosion protection and farmers’ perceptions of riparian buffer zones with grass and natural vegetation: Case studies from South-Eastern Norway. Ambio, 49(11), 1838–1849. https://doi.org/10.1007/s13280-020-01361-5
- Brecheisen, Z. S., & Richter, D. B. (2021). Gully-erosion estimation and terrain reconstruction using analyses of microtopographic roughness and LiDAR. CATENA, 202, 105264. https://doi.org/10.1016/j.catena.2021.105264
- Brown, D. R. N., Brinkman, T. J., Bolton, R. W., Brown, C. L., Cold, H. S., Hollingsworh, T. N., & Vebyla, D. L. (2020). Implications of climate variability and changing seasonal hydrology for subarctic riverbank erosion. Climate Change, 162(2), 1–20. https://doi.org/10.1007/s10584-020-02748-9
- Campbell, J. M., Jordan, P., & Arnscheidt, J. (2015). Using high-resolution phosphorus data to investigate mitigation measures in headwater river catchments. Hydrology and Earth System Sciences, 19(1), 453–464. https://doi.org/10.5194/hess-19-453-2015
- Cassidy, R., Thomas, I. A., Higgins, A., Bailey, J. S., & Jordan, P. (2019). A carrying capacity framework for soil phosphorus and hydrological sensitivity from farm to catchment scales. Science of The Total Environment, 687, 277–286. https://doi.org/10.1016/j.scitotenv.2019.05.453
- Couper, P. R., & Maddock, I. P. (2001). Subaerial river bank erosion processes and their interaction with other bank erosion mechanisms on the River Arrow, Warwickshire, UK. Earth Surface Processes and Landforms, 26(6), 631–646. https://doi.org/10.1002/esp.212
- Cresswell, H. P., & Hamilton, H. (2002). Particle size analysis. In N. J. McKenzie, H. P. Cresswell, & K. J. Coughlan (Eds.), Soil physical measurement and interpretation for land evaluation. Australian soil and land survey handbook series, Vol 5 (pp. 224–239). CSIRO Publishing.
- De Rose, R. C., & Basher, L. R. (2011). Measurement of river bank and cliff erosion from sequential LIDAR and historical aerial photography. Geomorphology, 126(1–2), 132–147. https://doi.org/10.1016/j.geomorph.2010.10.037
- Doody, D. G., Rothwell, S. A., Ortega, J. M., Johnston, C., Anderson, A., Okumah, M., Lyon, C., Sherry, E., & Withers, P. J. A. (2020). Phosphorus stock and flows in the northern Ireland food system. RePhoKUs Project Report, October 2020.
- East, A. E., & Sankey, J. B. (2020). Geomorphic and sedimentary effects of modern climate change: Current and anticipated future conditions in the Western United States. Review of Geophysics, 58(4), e2019RG000692. https://doi.org/10.1029/2019RG000692
- Haas, F., Heckmann, T., Wichmann, V., & Becht, M. (2012). Runout analysis of a large rockfall in the Dolomites/Italian Alps using LIDAR derived particle sizes and shapes. Earth Surface Processes and Landforms, 37(13), 1444–1455. https://doi.org/10.1002/esp.3295
- Hamshaw, S. D., Bryce, T., O’Neill Dunne, J., Rizzo, D. M., Frolik, J., Engel, T., & Dewoolkar, M. M. (2017). Quantifying Streambank Erosion Using Unmanned Aerial Systems at Site-Specific and River Network Scales. Geotechnical Frontiers. GSP 278.
- Hayes, E., Higgins, S., Geris, J., Nicholl, G., & Mullan, D. (2023). Weighted risk assessment of critical source areas for soil phosphorus losses through surface runoff mechanisms. CATENA, 225, 107027. https://doi.org/10.1016/j.catena.2023.107027
- Henshaw, A. J., Thorne, C. R., & Clifford, N. J. (2013). Identifying causes and controls of river bank erosion in a British upland catchment. CATENA, 100, 107–119. https://doi.org/10.1016/j.catena.2012.07.015
- Ishee, E. R., Ross, D. S., Garvey, K. M., Bourgault, R. R., & Ford, C. R. (2015). Phosphorus characterization and contribution from Eroding Streambank Soils of Vermont’s Lake Champlain Basin. Journal of Environmental Quality, 44(6), 1745–1753. https://doi.org/10.2134/jeq2015.02.0108
- Kay, A. L., Watts, G., Wells, S. C., & Allen, S. (2020). The impact of climate change on U. K. River flows: A preliminary comparison of two generations of probabilistic climate projections. Hydrological Processes, 34(4), 1081–1088. https://doi.org/10.1002/hyp.13644
- Kendon, M., McCarthy, M., Jevrejeva, S., Matthews, A., Sparks, T., & Garforth, J. (2021). State of the UK climate 2020. International Journal of Climatology, 41(s2), 1–76. https://doi.org/10.1002/joc.7285
- Kessler, A. C., Gupta, S. C., & Brown, M. K. (2013). Assessment of river bank erosion in Southern Minnesota rivers post European settlement. Geomorphology, 201, 312–322. https://doi.org/10.1016/j.geomorph.2013.07.006
- Kessler, A. C., Gupta, S. C., Dolliver, H. A. S., & Thoma, D. P. (2012). Lidar quantification of bank erosion in Blue Earth County, Minnesota. Journal of Environmental Quality, 41(1), 197–207. https://doi.org/10.2134/jeq2011.0181
- Kronvang, B., Audet, J., Baattrup-Pedersen, A., Jensen, H. S., & Larsen, S. E. (2012). Phosphorus load to surface water from Bank Erosion in a Danish Lowland River Basin. Journal of Environmental Quality, 41(2), 304–313. https://doi.org/10.2134/jeq2010.0434
- Lerma, A. N., Ayache, B., Ulvoas, B., Paris, F., Bernon, N., Bulteau, T., & Mallet, C. (2019). Pluriannual beach-dune evolutions at regional scale: Erosion and recovery sequences analysis along the aquitaine coast based on airborne LiDAR data. Continental Shelf Research, 189, 103974. https://doi.org/10.1016/j.csr.2019.103974
- Longoni, L., Papini, M., Brambilla, D., Barazzetti, L., Roncoroni, F., Scaioni, M., & Ivanov, V. I. (2016). Monitoring Riverbank Erosion in mountain catchments using Terrestrial Laser Scanning. Remote Sensing, 8(3), 241. https://doi.org/10.3390/rs8030241
- Lowe, J. A., Bernie, D., Bett, P., Bricheno, L., Brown, S., Calvert, D., Clark, R., Eagle, K., Edwards, T., Fosser, G., Fung, F., Gohar, L., Good, P., Gregory, J., Harris, G., Howard, T., Kaye, N., Kendon, E., Krijnen, J., … Belcher, S. (2018). UKCP18 Science Overview Report, November 2018. Retrieved August 06, 2022, from https://www.metoffice.gov.uk/pub/data/weather/uk/ukcp18/science-reports/UKCP18-Overview-report.pdf.
- Macfall, J., Robinette, P., & Welch, D. (2014). Factors influencing bank geomorphology and erosion of the Haw River, a high order river in North Carolina, since European Settlement. PLOS ONE, 9(10), e110170. https://doi.org/10.1371/journal.pone.0110170
- Mason, J., & Mohrig, D. (2018). Using time-lapse lidar to quantify river bend evolution on the Meandering Coastal Trinity River, Texas, USA. Journal of Geophysical Research: Earth Surface, 123(5), 1133–1144. https://doi.org/10.1029/2017JF004492
- McDonald, N., Wall, D., Mellander, P., Buckley, C., Shore, M., Shortle, G., Leach, S., Burgess, E., O’Connell, T., & Jordan, P. (2019). Field scale phosphorus balances and legacy soil pressures in mixed-land use catchments. Agriculture, Ecosystems and Environment, 274, 14–23. https://doi.org/10.1016/j.agee.2018.12.014
- Mellander, P. E., & Jordan, P. (2021). Charting a perfect storm of water quality pressures. Science of The Total Environment, 787, 147576. https://doi.org/10.1016/j.scitotenv.2021.147576
- Ministry of Agriculture, Fisheries and Food (MAFF). (1986). The analysis of agricultural materials. Third edition, reference book 427. Her Majesty's Stationary Office.
- Naimah, Y., & Roslan, Z. A. (2015). Forecasting River Bank erosion with regards to Rainfall Erosivity and soil erodibility. WIT Transactions on The Built Environment, 150, 67–77. https://doi.org/10.2495/DMAN150071
- Neugrig, F., Kaiser, A., Schmidt, J., Becht, M., & Haas, F. (2014, December 11–14). Quantification, analysis and modelling of soil erosion on steep slopes using LiDAR and UAV photographs. Sediment Dynamics from the Summit to the Sea, Proceedings of a symposium, New Orleans, Louisiana, USA.
- Olsen, S. R., & Sommers, L. E. (1982). Phosphorus. In A. L. Page (Ed.), Methods of soil analysis part 2 chemical and microbiological properties (pp. 403–430). American Society of Agronomy, Soil Science Society of America.
- Robins, L., Burt, T. P., Bracken, L. J., Boardman, J., & Thompson, D. B. A. (2017). Making water policy work in the United Kingdom: A case study of practical approaches to strengthening complex, multi-tiered systems of water governance. Environmental Science and Policy, 71, 41–55. https://doi.org/10.1016/j.envsci.2017.01.008
- Russell, M., Mittlstet, A. R., Messer, T. L., Korus, J. T., & Joeckel, R. M. (2021). Evolution of three streambanks before and after stabilization and record flooding. Ecological Engineering, 170, 106357. https://doi.org/10.1016/j.ecoleng.2021.106357
- Sharpley, A. N. (2003). Soil mixing to decrease surface stratification of phosphorus in manured soils. Journal of Environmental Quality, 32(4), 1375–1384. https://doi.org/10.2134/jeq2003.1375
- Smith, H. G., Spiekermann, R., Dymond, J., & Basher, L. (2019). Predicting spatial patterns in riverbank erosion for catchment sediment budgets. New Zealand Journal of Marine and Freshwater Research, 53(3), 338–362. https://doi.org/10.1080/00288330.2018.1561475
- Steele-Dunne, S., Lynch, P., McGarth, R., Semmler, T., Wang, S., Hanafin, J., & Nolan, P. (2008). The impacts of climate change on hydrology in Ireland. Journal of Hydrology, 356(1–2), 28–45. https://doi.org/10.1016/j.jhydrol.2008.03.025
- Thoma, D. P., Gupta, S. C., Bauer, M. E., & Kirchoff, C. E. (2005). Airborne laser scanning for riverbank erosion assessment. Remote Sensing of Environment, 95(4), 493–501. https://doi.org/10.1016/j.rse.2005.01.012
- Ulén, B., & Kalisky, T. (2005). Water erosion and phosphorus problems in an agricultural catchment—Need for natural research for implementation of the EU water framework directive. Environmental Science and Policy, 8(5), 477–484. https://doi.org/10.1016/j.envsci.2005.06.005
- Walling, D. E., & Collins, A. L. (2005). Suspended sediment sources in British rivers. Sediment Budgets 1 (Proceedings of symposium S1 held during the Seventh IAHS Scientific Assembly at Foz do Iguaçu, Brazil, April 2005). IAHS Publ. 291.
- Watts, C. D., Naden, P. S., Cooper, D. M., & Gannon, B. (2003). Application of a regional procedure to assess the risk to fish from high sediment concentrations. Science of The Total Environment, 314–316, 551–556. https://doi.org/10.1016/S0048-9697(03)00073-1
- Wilson, J. L., & Everard, M. (2017). Real-time consequences of riparian cattle trampling for mobilization of sediment, nutrients and bacteria in a British lowland river. International Journal of River Basin Management, 16(2), 231–244. https://doi.org/10.1080/15715124.2017.1402778