
 ?Mathematical formulae have been encoded as MathML and are displayed in this HTML version using MathJax in order to improve their display. Uncheck the box to turn MathJax off. This feature requires Javascript. Click on a formula to zoom.
ABSTRACT
Like many low-income countries, Uganda is struggling to provide sanitation to its inhabitants. Meeting the Sustainable Development Goal related to sanitation (SDG6) will require major investments in sanitation. This study uses the concept of service regimes to analyze existing sanitation infrastructure and services and their respective costs. The service regimes investigated are the sewage regime and the fecal sludge (FS) regime. The results show that approximately 56% of the fecal flow in Kampala is estimated as ‘safely managed’. The results also show that the annual per capita costs for the sewage regime (USD 186) are more than 13-fold those for the FS regime (USD 14). Additionally, there are large differences in subsidies between the regimes. When allocating public funds, decision-makers are advised to consider (i) number of customers within regimes, (ii) total capital and operating costs of services, (iii) cost allocation between stakeholders, and (iv) infrastructure performance.
Introduction
Like most other low- and middle-income countries, Uganda has failed to achieve the United Nations Millennium Development Goal (MDG) related to providing sanitation for rural and urban populations (The Republic of Uganda Citation2015; WHO/UNICEF Citation2015; Satterthwaite Citation2016). In fact, the available data indicate that access to sanitation has decreased in urban areas in Uganda, possibly due to a high rate of population growth without a corresponding increase in the provision of sanitation services (The Republic of Uganda Citation2015). Uganda’s annual urban population growth rate of 5.2% (World Bank Citationn.d.) is one of the highest in the world, and the population of Kampala is expected to more than double by 2035 (United Nations Citation2018). This places enormous stress on the city’s existing sanitation infrastructure and services. For Greater Kampala to meet the Sustainable Development Goal related to sanitation (SDG6), where the targets include universal access to sanitation for all (SDG6.1) and halving the proportion of untreated wastewater (SDG6.2), an unprecedented level of investment in sanitation infrastructure and services will be required in the coming decade. Indeed, Hutton and Varughese (Citation2016) estimate that annual capital investment in the sector will have to be tripled in order to meet SDG6.1 and SDG6.2 on a global level, with the achievement of ‘safely managed sanitation’ in urban areas being the most costly segment of SDG6.2. Uganda is no exception and, in preparation for such investments, it is important to have an understanding of existing infrastructure, services, and their respective costs.
Sanitation services can be provided through a variety of infrastructures at varying organizational scales. Globally, only 60% of the urban population was connected to sewers in 2015 (WHO and UNICEF Citation2017). In sub-Saharan Africa, the corresponding figure was 11%. The remainder of the population uses on-site sanitation systems or open defecation. Since each of these different modes of providing sanitation services can be linked to different organizational and financing structures, institutional arrangements, social meaning, and technological processes, it can be useful to discuss them in terms of social-technical or ‘service’ regimes (Geels Citation2002). Even within the same urban context, there can be a number of different service regimes in use (van Welie et al. Citation2018). This study considered two parallel service regimes, centralized sewage and on-site services for faecal sludge management, each using different technical infrastructures and financing structures.
Few costing studies accurately reflect the differences in costs between existing service regimes. Many such studies focus only on capital costs, or only on one part of the sanitation chain. A recent review of research on life-cycle costs in urban sanitation only found 11 relevant studies that provided cost data for various sanitation options covering the full sanitation chain, i.e. from user interface to collection and treatment/disposal (Daudey Citation2018). In a study in Dakar, Senegal, Dodane et al. (Citation2012) found that the per capita annual costs for fecal sludge management (FSM), including collection, transport, and treatment of sludge from on-site sanitation systems, were significantly lower than those of a conventional sewerage system. In contrast, a study in Dhaka, Bangladesh, found that small-bore sewers connected to municipal sewers via anaerobic-baffled reactors had a lower cost per household than the FSM system (Ross, Scott, and Joseph Citation2016). In general, costing studies show a wide variation in costs depending on the local context, highlighting a need for more local studies. In addition, most costing studies do not use primary data for their calculations, but rely on secondary data sources (e.g. Tilmans et al. Citation2015), sometimes from other cities (Daudey Citation2018), and few studies break down costs between stakeholders. A World Bank study in three African countries compared household costs to donor inputs and total costs, but did not include costs for other stakeholders, such as the utility (World Bank Citation2009). Knowing who will pay the costs of improved sanitation is a critical ethical question for policy development to meet SDG6.
The aim of this study was to compare financial costs and infrastructure performance of sanitation service regimes in Greater Kampala. Specific objectives were to (1) analyze infrastructure performance and (2) compare life-cycle costs for each of the regimes. The intention was to fill a knowledge gap by providing a clear breakdown of actual costs during the system lifetime and how these costs are divided between stakeholders. Cost comparisons were based on the actual capital costs and operating costs of full-scale systems implemented in Kampala. The infrastructure performance in relation to the number of customers connected to each regime was also determined, to provide the infrastructural backdrop to the financial costs per regime.
Methods
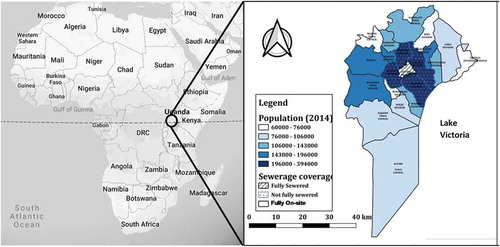
The study area was Greater Kampala, the metropolitan core of the Ugandan capital, since the existing Kampala Sanitation Master Plan aims at serving this region (Government of Uganda/NWSC Citation2015). Kampala has around 3.2 million inhabitants in its greater metropolitan area (Government of Uganda/NWSC Citation2015) and is perched on several hills just north of Lake Victoria. The existing sewage system only covers part of central Kampala, connecting 1.3% of the total population in the metropolitan area (7.5% of the population in the central districts) (Schoebitz, Niwagaba, and Strande Citation2016). The remaining population is served by on-site sanitation systems ().
Figure 1. Maps of the study area: left-hand map shows the location of Kampala, Uganda in Africa (Google) and right-hand map shows the districts within Greater Kampala Metropolitan area, including demarcation of population levels and type of sanitation system. The central Division of Kampala is largely sewered (striped area), while parts of Rubaga, Makindye, Nakawa, and Kawempe Divisions are sewered although a majority still use on-site systems (dotted areas). The remaining areas are served by septic tanks and pit latrines, with a strong predominance for pit latrines. Data source: Uganda Bureau of Statistics (http://ubos.geo-solutions.it). Accessed 2019-09-10.
A comparison was performed of two different service regimes in Kampala. van Welie et al. (Citation2018) describe five common service regimes in the city: domestic sewers, on-site sanitation (private or shared), public toilets, container-based sanitation, and open defecation. In the context of Greater Kampala, we identified the presence of sewers, private and shared on-site sanitation, public toilets, and open defecation. For the purposes of this study, we grouped these into two service regimes based on the waste flow streams managed: (i) a sewage regime and (ii) a fecal sludge (FS) regime. The sewage regime manages mixed wastewater, while the FS regime manages fecal waste from on-site sanitation systems. Public toilets may be connected to either of the two regimes, depending on location and infrastructure used. Different customer groups are associated with these regimes. The sewage regime has industries, commercial and public institutions, and households as its customers, while the FS regime serves households through private and shared sanitation and the general public through public toilets and institutional toilets. There are significant differences between the various services within the FS regime, e.g. public toilets, shared or private on-site sanitation. However, in this study, we decided to cluster the different services for managing fecal sludge into a single regime, including most public toilets. When this could have created inconsistencies within the results for the FS regime, this is noted in the text. Given that open defecation is not common in Kampala (0.2% according to Government of Uganda/NWSC Citation2015), it was considered negligible in this study.
Sewage regime
The sewage regime in Greater Kampala is served mainly by two separate sewerage systems, each connected to a wastewater treatment plant (located in Bugolobi and Lubigi). The treatment plants together serve approximately 41,000 people (domestic wastewater represents ~16% of the total wastewater flow), industries and commercial entities (~56% of the wastewater flow) and institutions (~17% of the wastewater flow) (Government of Uganda/NWSC Citation2015). There are approximately 180 km of sewerage pipes in Greater Kampala, the majority of which were laid between 1940 and 1969. In the present analysis, we used the costs for the recently upgraded wastewater treatment plant (WWTP) at Bugolobi (to be commissioned in 2020), with a design capacity of 45,000 m3/day, although current flow is 13,000 m3/day. The upgraded plant is comprised of two inlet screw pumping stations, mechanical pre-treatment with coarse and fine screens and aerated grit removal, primary sedimentation, aerobic treatment in high-rate trickling filters, secondary clarifiers, mechanical sludge thickening, anaerobic mesophilic sludge stabilization, biogas power generation, mechanical sludge dewatering, and odor treatment. The dried sludge is sold to farmers and the effluent from the plant discharges into the Nakivubo Channel, which is connected to Lake Victoria. The sewage treatment plant at Lubigi was commissioned in 2014 with a design capacity of 5000 m3/day and consists of manual screening and grit removal, followed by anaerobic and facultative ponds with unplanted drying beds for sludge. It currently treats 3000 m3/day. The dried sludge is sold to farmers and the effluent from the plant discharges into the Lubigi wetland system, which drains into Lake Albert. The main stakeholders within this regime are household-level users, the utility National Water and Sewerage Corporation (NWSC), and the end users of the treated end-products. Industries, institutions, and commercial entities were included in the present analysis via the fees they pay to NWSC.
Fecal sludge regime
On-site sanitation systems at the household level in Greater Kampala consist of septic tanks, lined ventilated improved pit latrines (VIPs), and traditional (unlined) pit latrines. The Kampala Sanitation Master Plan estimates that 35% of the fecal sludge produced is collected, transported, and delivered to the fecal sludge treatment plant at Lubigi, operated by NWSC. The population of the regime used for cost calculations was thus assumed to be 35% of those using on-site systems, or approximately 1.1 million people. This is most likely a slight overestimate, given that about 20% of sludge collected is from institutions (PEAU Citation2018). There are 89 vacuum trucks in operation in Greater Kampala (PEAU Citation2018). Six of these trucks are operated by the Kampala Capital City Authority (KCCA), while the remaining trucks are privately operated. There are no exact figures on the volume of fecal sludge collected and treated. In this study, it was assumed that all fecal sludge collected (around 35% of sludge produced) is brought to the fecal sludge treatment plant at Lubigi and that the plant operates at maximum capacity. This plant was commissioned in 2014 with a design capacity of 400 m3/day, and it consists of manual screening and grit removal followed by covered settling/thickening tanks, covered drying beds and covered storage areas for sludge. The liquid effluent from the settling/thickening tanks is treated in the WWTP at Lubigi. The dried sludge is sold to farmers. The main stakeholders within this regime are the household-level users, private collection and transportation (C&T) businesses who operate the vacuum trucks, the utility NWSC, and the end-users of the treated end-products.
Visualization of infrastructure performance
Peal et al. (Citation2014) developed a tool (the Shit-Flow Diagram, SFD) to illustrate the flow of human excreta through a city and the degree to which it can be considered ‘safely managed’ or ‘unsafely managed’. The SFD methodology has since been widely used to identify and communicate challenges with urban sanitation worldwide. The Sustainable Sanitation Alliance hosts a platform with a database of about 100 SFDs available for cities around the world (Sustainable Sanitation Alliance Citationn.d.). The SFD Promotion Initiative (Citation2018) defines ‘safely managed’ as a service delivery outcome that results in a low public health risk through reducing excreta exposure. It uses the Joint Monitoring Programme definition of safely managed sanitation: Use of improved facilities that are not shared with other households and where excreta are safely disposed of in situ or transported and treated offsite (WHO & UNICEF Citation2017). This definition includes the management of all excreta, whether collected in on-site systems or in wastewater. In the SFD methodology ‘safely managed’ is assessed using, e.g. available data, stakeholder engagement, and assumptions (SFD Promotion Initiative Citation2018). An SFD document exists for Kampala, explaining the assumptions, estimates and methodology behind SFDs (Schoebitz, Niwagaba, and Strande Citation2016, further updated by Niwagaba Citationn.d.). A combination of government documents, published research, key informant interviews, and assumptions was used to generate this visual illustration of fecal flows in Central Kampala and the quality of these data is generally considered high (Schoebitz, Niwagaba, and Strande Citation2016). However, it needs to be underlined that an SFD is a visualization tool to give a quick overview of the existing sanitation situation, which was the intended level of ambition for determining ‘infrastructure performance’ in this paper.
The geographical area of interest in this paper, Greater Kampala, differs from that of the existing Kampala SFD. Therefore, simplified SFDs for both sanitation regimes studied were generated, based on (i) the Kampala Sanitation Master Plan (Government of Uganda/NWSC Citation2015) with data for Greater Kampala and (ii) an updated SFD for Kampala (Niwagaba Citationn.d.). The SFD generated in this way for Greater Kampala is hence a visual illustration of the functionality of the technical infrastructure. In contrast to the original Kampala SFD (Schoebitz, Niwagaba, and Strande Citation2016), the simplified SFD produced in this paper does not take into account the fact that commuters may use other services during daytime.
Determination of costs and financial flows
In order to compare the capital costs and operating costs for the two regimes, we calculated annualized costs per capita associated with each regime. The financial flows considered in this study represent those of the key stakeholders in the system and the most significant components along the sanitation service chain. The annualized capital and operating costs within each regime were calculated with the formula:
where AC0 is the annualized cost of the sanitation component (USD capita−1 year−1), C0 is the capital cost of the component (USD capita−1), n0 is the lifetime of the component (years), i is the real interest rate, and F0 is the annual operating cost of the component (USD capita−1 year−1). A real interest rate of 6% was assumed, based on the discount rate used by the World Bank (Fay et al. Citationn.d.). Note that the annualized cost equation accounts for differences in lifetimes of the system components and thus potential replacement costs. Detailed assumptions and specific costs are provided in the Supplementary Material.
Costs for sewage regime
The capital costs for the sewage regime include costs for (i) household toilet and indoor plumbing, (ii) household sewerage connections, (iii) the sewer network including pumping stations, and (iv) wastewater treatment plants. Data on the household connection costs were obtained from NWSC and included materials, excavation for one manhole, and up to 60 m of connection pipe. Data on remaining costs for the sewerage network and treatment plants were taken from NWSC financial statements. A surcharge of 15%, in order to account for costs for preliminary design studies and project management, was added to the capital investment costs for the two WWTPs (Ministry of Water and Environment Citation2013).
Data on the operating costs and revenues for the sewage regime were taken from financial statements from NWSC and included (i) NWSC’s actual operating budget for the sewer network, including pumping stations and the wastewater treatment plants, (ii) sanitation fees for sewage services, and (iii) sale of dried sludge. Note that the operating budget for NWSC is not broken down into specific categories so that a detailed analysis of operating costs was not possible in this study. According to NWSC, an estimated 50% of its operating budget is used on the sewer network, and the remaining 50% on the two treatment plants. Volumetric flows were used to divide the remaining 50% of the operating budget between the two treatment plants, which resulted in an estimated 10% of the total NWSC operating budget being spent on Lubigi WWTP. According to NWSC, 40% of the operating budget for Lubigi is used for sewage treatment (and hence 60% of the Lubigi operating budget is spent on FS treatment processes). Thus, the overall sewage regime operating budget was estimated to be 94% of the total NWSC sanitation operating budget. The sanitation fees paid by each customer type connected to the system (households, industries, commercial entities, and institutions) were estimated from NWSC annual revenues. Since the comparison between the two regimes was per capita connected to each regime, the sanitation fees for other customer types were divided by the number of residents connected to the sewage regime, to give a fair overview of total costs and revenues for the sewage regime.
Costs for fecal sludge regime
The capital costs for the FS regime included (i) estimated construction costs for the toilet and septic tank or latrine, (ii) costs for vacuum trucks, and (iii) costs for the fecal sludge treatment processes at Lubigi WWTP. The construction costs for toilets and latrines were estimated based on personal experience of construction of each technology type. A proportional average, based on the population using each on-site technology in Greater Kampala (Government of Uganda/NWSC Citation2015), was then calculated. The costs for vacuum trucks were estimated proportionally between ‘small trucks’ (<5 m3 capacity, 49 in Kampala in 2018) and ‘large trucks’ (>5 m3 capacity, 40 in Kampala in 2018), depending on size and number of trucks serving Kampala in 2018 (PEAU Citation2018). The capital costs for the fecal sludge processes at the WWTP were estimated from NWSC financial statements. As done for the sewage regime, a surcharge for project management of 15% was added to the capital cost of the fecal sludge treatment plant (Ministry of Water and Environment Citation2013).
The operating costs and revenues for the FS regime included (i) emptying of the on-site systems, (ii) operation and maintenance (O&M) of the vacuum trucks for the C&T entrepreneurs, (iii) dumping costs at Lubigi WWTP, and (iv) O&M for the fecal sludge treatment processes at Lubigi WWTP. The emptying costs of the on-site systems were based on a proportional average fee per m3 for households <5 km from the treatment plant, based on volumetric fees per truck and number of different-sized trucks operating in the city (PEAU Citation2018). We assumed that 55% of collected emptying fees go to cover operating costs, including fuel, labor, and drivers’ wages, based on Murungi and van Dijk (Citation2014). The O&M for Lubigi WWTP related to fecal sludge treatment was estimated to be 6% of the total operating budget for NWSC, see above.
Limitations of the study
It should be noted that the two regimes are not completely comparable since the sewage regime handles both blackwater and greywater, while the fate of greywater is largely unknown in the FS regime. It is possible that some greywater enters systems with septic tanks, and therefore could be considered ‘managed’ in some way by these systems, but the volumes are unknown. It is also not known how greywater is managed in households with VIPs or traditional latrines. In addition, assumptions were necessary regarding the degree to which fecal sludge that is stored in on-site sanitation systems can be considered ‘safely managed’ and regarding the functionality within the sewage regime due to lack of data. Rather than making our own assumptions we used stakeholder-generated estimates made by Schoebitz, Niwagaba, and Strande (Citation2016) in their work with Kampala’s Shit-Flow Diagram and in its updates (Niwagaba Citationn.d.). To make a full comparison of infrastructure within the regimes, greywater would need to be included and more accurate data on the actual performance of on-site and off-site sanitation systems in Greater Kampala would be required.
This study also does not assess the potential for internal cost optimization in the existing regimes. There are likely opportunities for cutting costs within both regimes, e.g. through optimizing electrical or chemical use in the sewage regime or by optimizing the transportation logistics in the FS regime. The optimization analysis provided in this study only compares costs if the systems were optimized to serve a maximum number of users, e.g. sanitation for all. Further studies would be needed to investigate the potential for internal cost saving within each regime.
Results and discussion
Infrastructure performance
By combining (i) the percentages of households on each technology type stated in the Kampala Sanitation Master Plan (Government of Uganda/NWSC Citation2015) and the estimated treatment efficiency for each of the regimes from an SFD report (Niwagaba Citationn.d.), a simplified SFD for Greater Kampala was developed (). It should be noted that the percentages in the simplified SFD show the population served by different sanitation technologies at home. It does not take account of the fact that commuters in the population may use other services during daytime, which may shift usage between the regimes slightly.
Figure 2. Simplified fecal flow diagram for the Greater Kampala region, based on data from Kampala Sanitation Master Plan (2015), and assessments made by Schoebitz, Niwagaba, and Strande (Citation2016) and Niwagaba (Citationn.d.).
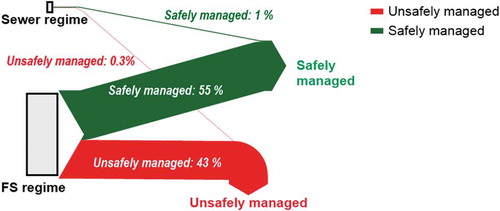
As can be seen from , the regimes differ greatly in size, with almost 99% of the population in Greater Kampala estimated to be relying on on-site sanitation systems (also including 0.7% on ‘undefined’ systems) and hence belonging to the FS regime. Implementation of the Kampala Sanitation Master Plan would connect an estimated 31% of Greater Kampala’s population to sewage services with sewers and treatment plants by 2040. Even with a fluctuation between the regimes based on commuter influx to the city (which will increase the population using the sewage regime during daytime) and even with the fulfilment of the objectives in the Kampala Sanitation Master Plan, the FS regime will continue to dominate Greater Kampala for the foreseeable future.
In , the estimates of ‘safely managed’ and ‘unsafely managed’, using the estimates of ‘safely managed’ from SFD calculation for Kampala (Niwagaba Citationn.d.), are applied to the two regimes, and not to each technology type, due to lack of specific data on how well each system type functions within each regime. As can be seen from the diagram, up to 55% of the fecal sludge generated was estimated to be ‘safely managed’ in the FS regime. This safely managed fraction includes fecal sludge that is collected and treated, and fecal sludge that is contained and stored. There is documented evidence that fecal waste is stored on-site in Kampala (Nakagiri et al. Citation2015), but there is a lack of data to confirm that it is safely stored. According to a KCCA study based on household questionnaires (about 160,000 households surveyed), 53% of all septic tanks in Kampala have never been emptied and another 25% of households with septic tanks are unsure whether their systems have ever been emptied (Government of Uganda/KCCA Citation2017). That survey also found that 93% of surveyed households were accessible to septic tank emptying services, so lack of access does not explain the low rate of emptying.
The sewage regime is estimated to safely managing 1% out of 1.3% total flow in the regime, based on assumptions made in earlier studies (Niwagaba Citationn.d.). The ‘safely managed’ efficiency in both regimes was estimated to be 56% of all fecal matter generated in Greater Kampala. Unsafely managed fecal flows in the sewage regime are primarily the result of sewage leaks prior to reaching WWTPs (Schoebitz, Niwagaba, and Strande Citation2016). It is important to remember that only attempts to describe the fate of fecal waste in Greater Kampala within the two dominant regimes and does not account for greywater management.
Annualized costs
The annualized capital costs and operating costs calculated in this study were based on current connection rates and infrastructure in the Greater Kampala area (full details of assumptions and calculations can be found in the Supplementary Material). The total annual capital and operating costs included both costs and revenues for the key stakeholders in the system and are shown in , while shows the ratios between different annualized costs in the sewage regime and FS regime. As can be seen in , total annualized capital costs for the sewage system were around 23-fold higher than for the FS system. In terms of operating costs, the sewage regime was 101-fold more expensive than the FS regime. These substantial differences in annualized costs between the sewage and FS regimes are primarily due to the high capital costs for the sewer network and WWTP ().
Table 1. Annualized capital and operating costs for the centralized and on-site sanitation regimes in Greater Kampala, Uganda. Costs are broken down by stakeholder and service along the service chain.*
Table 2. Comparison of costs and households’ share of costs for the sewage and fecal sludge (FS) regimes, presented as the ratios of costs between regimes and percentage of costs paid by households (derived from values shown in ).
Due to significant income from sanitation fees from non-domestic sewerage customers, NWSC brings in more revenue on sewerage services than it uses for operations within the sewage regime (). This means that the sewage regime has an annual operating surplus of USD 118 per capita. When the annualized costs were combined with the revenues generated, the difference in cost ratio between the regimes decreased, so that the costs for the sewage regime were 13-fold higher than for the FS system (). However, despite this net operating surplus, the Kampala Sanitation Master Plan states that an estimated 12% of sewerage revenue is used for the sanitation regime, leaving the regime’s operation underfunded, with an extremely low service expansion rate and with no preventative maintenance (Government of Uganda/NWSC Citation2015). Instead, the revenue from sewage services is used for the water services supplied by NWSC.
The total annual costs for the sewage system in Kampala (USD 186 capita−1 year−1) were approximately three-fold greater than those reported for a sewerage system in Dakar, Senegal (~USD 55 capita−1 year−1), while the total annual costs for the FS system were similar (USD 14 capita−1 year−1 in this study, ~USD 12 capita−1 year−1 in Senegal) (Dodane et al. Citation2012). The higher annual costs for sewage regimes in this study are likely due to low connection rates to the sewage system in Kampala (e.g. 7% in central Kampala vs. 30% in Dakar). The annual costs calculated for sewage and FS in this study are within the same orders of magnitude as other sanitation cost studies. For example, von Munch and Mayaumbelo (Citation2007) found that annual costs for FS management from VIP latrine and urine-diverting dry toilet systems, including processing, ranged from 36 to 45 USD per capita. Similarly, Mara (Citation1996) found that annual costs for low-cost sewerage systems (exclusive treatment) were in the range of 35–390 USD per person. Hutton and Varughese (Citation2016) estimated annual capital and O&M costs for ‘safely managed’ sanitation of USD 12–19 capita−1 year−1, which is in line with the value obtained in this study for the FS regime ().
Figure 3. Annualized capital and operating costs for the (left) centralized sewage regime and (right) on-site fecal sludge regime in Greater Kampala, Uganda. Note that some cost items are too small to be shown in the diagram (see for exact values).
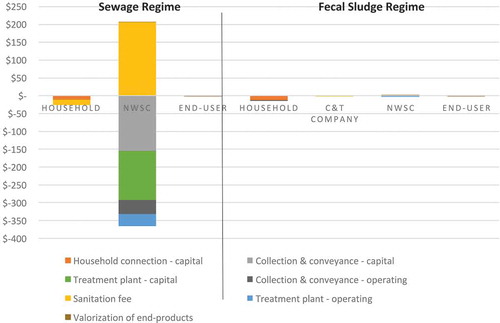
In addition to the evaluation of total costs, it is important to consider who pays these costs. As shown in , the cost of the sewage system in Greater Kampala is mostly the responsibility of NWSC. Despite substantial revenues from sanitation fees from non-domestic customers ( and ), the sewage system is operating at a net loss. If revenues from sanitation fees and valorization of end-products were used within the sewage regime, they would cover 56% of NWSC’s total annualized costs. However, this is not the case according to the Kampala Sanitation Master Plan (Government of Uganda Citation2015), so the net loss to NWSC for its sewage services is estimated to be even higher than shown in . The financial sustainability of the sewage regime can thus be questioned, particularly in light of the low percentage of total costs (14%) paid by the households in this regime (). In the FS regime, households are responsible for the majority of the costs, including subsidizing the profit made by the collection companies. Capital costs for household on-site infrastructure represent 89% of total annualized costs. If operating costs are included, households with on-site systems are paying 95% of the total capital and operating costs of that system ().
A critical difference in the FS regime is also the presence of C&T companies, which carry out collection and transport of fecal sludge. In addition to providing conveyance services at a fraction of the cost of the sewer network, these businesses are the only stakeholder in either regime to make a profit (total annualized revenue of USD 0.11 capita−1 year−1). Other studies have also found that profits can be made in this part of the service chain (Chowdhry and Koné Citation2012; Dodane et al. Citation2012; Murungi and van Dijk Citation2014). Another potential source of profit within the service chain is the end-use step (Lalander et al. Citation2014), but the end-use product needs to be safe, which requires treatment ().
Optimization analysis
Neither of the regimes is operating at an optimal level. A key reason for the substantially higher per capita costs in the sewage regime is that the population served by this regime is so low. Moreover, the existing sewage treatment plants are under-utilized. At the same time, the FS regime safely manages only approximately half of the fecal waste produced. Therefore, we performed a sensitivity analysis of costs if both regimes were optimized for service coverage.
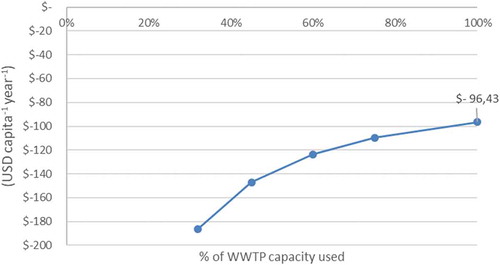
In the case of the sewage regime, this optimization was calculated by increasing the population served by the system until the WWTPs were operated at capacity. If the existing WWTPs were operated at full capacity and the existing ratio of wastewater flows remained the same (i.e. 16% domestic connections), then 130,000 domestic customers could be served and the combined capital costs and operating costs would be USD 96 capita−1 year−1 or approximately half the existing costs (). However, this cost is still approximately seven-fold greater than the current costs of the FS system and would serve 4% of the population.
Figure 4. Changes in total annualized capital and operating costs in the sewage regime based on increasing the number of people connected to the system to the maximum capacity of existing wastewater treatment plants (WWTPs), while keeping the ratio of domestic to non-domestic customers the same (i.e. 16% domestic).
For the FS regime, the optimization analysis was calculated for a system that included collection and treatment for all those currently using FS systems (3,136,000 people). We calculated this by determining the additional capital and operating costs for upgrading all on-site systems to a minimum of a VIP (lined) latrine, which would enable emptying, and the subsequent need for additional treatment capacity if 100% of fecal matter from on-site systems were to be collected and treated. The number of people using septic systems was not changed (20%), while the 56% currently using traditional pit latrines were assumed to upgrade to VIPs. This means that 380,323 households would need to upgrade to VIP latrines, which would be a capital investment of USD 285 million. Moreover, additional collection services would be necessary. If the proportion of small and large pit-emptying trucks remained the same, this would mean capital investment in additional 91 small trucks and 74 large trucks, costing USD 8 million. Two additional fecal sludge treatment plants of similar size to the Lubigi plant would be necessary to treat the collected fecal sludge, representing a capital investment of USD 57 million. A total capital investment of USD 350 million, or annualized capital costs of USD 30 million, would be necessary to guarantee that all on-site sanitation systems in Greater Kampala safely captured, collected, and treated fecal sludge. This is the equivalent of an additional annualized capital investment of USD 9 per capita served by the FS regime.
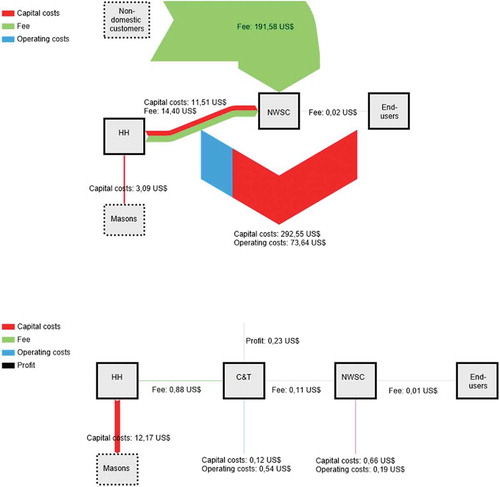
Annualized capital costs and operating costs for an FS system that provided a ‘safely managed’ service to all within the FS regime would be USD 17 capita−1 year−1. Operating costs can be assumed to remain the same, since these costs were calculated in relation to a fully utilized treatment system. This value is approximately one-sixth of the cost of the optimized sewage system. It is also interesting to note that the majority of the annualized costs for the FS system come from investment in household infrastructure. In this optimized scenario, households need to invest USD 285 million, giving an annualized capital cost of USD 16 capita−1 year−1. The per capita public funding that is spent on providing sanitation services through NWSC in the sewage regime (USD 160 capita−1 year−1) is approximately 10-fold this figure. This translates to an 8.4-fold difference in public spending between the regimes, even when the regime sizes are taken into account (currently USD 6.7 million year−1 for the sewage regime and USD 0.79 million year−1 for the FS regime). From an equality point of view, it would be reasonable to consider redistributing public funds between the regimes proportionately to their size. The FS regime would in that case access USD 7.4 million yearly from public funds, instead of USD 0.79 million year−1. These funds would be enough for NWSC to extend treatment capacity to serve the full population of the FS regime (USD 2.3 million year−1) and leave USD 5.1 million year−1 available, e.g. improvements in treatment, investigations into the functionality of the regime, innovations within the sector, subsidies to the poorest quintile of the population, etc ().
Figure 5. Financial flows between stakeholders in the (top) centralized sewage regime and (bottom) on-site fecal sludge regime. The size of the arrows is proportionate to the financial flow in question. The dashed lines represent stakeholders not included in this study.
Additional implications for the future
The Kampala Sanitation Master Plan (Government of Uganda/NWSC Citation2015) makes reference to a tariff study from 2012, which concluded that the sewerage tariff should be double the current water tariff to cover the actual operating costs of sewerage services. For full cost recovery, including investments, it should be seven-fold higher. The Master Plan also states that additional investments would create a need for even higher tariffs within the sewage regime. Hutton and Varughese (Citation2016) underline the necessity of national governments providing a policy environment for the implementation of equitable tariff structures, considering both basic and higher-level services. An increase in household tariffs within the sewer regime, which seems to be needed for financial sustainability and would be reasonable to decrease the difference in household participation between the two regimes, would, however, decrease the affordability of the service to the customers. A way forward for NWSC could be to start considering alternative, and cheaper, technological options. Luckily, SDG6.2 and SDG6.3 can be met using different technologies and systems. The Kampala Sanitation Master Plan mentions a proposal to experiment with condominium sewerage systems, to increase connectivity in urban poor areas at lower cost. Condominium sewers are well established, for example, in Latin America, and are a proven way to reduce costs for the conveyance of sewage (Mara Citation1996). NSWC should thus explore condominium sewers within its sewage regime, as well as options for extending its service within the FS regime. Decision makers need to start considering alternative sanitation systems and services, in order to provide sanitation services that are both affordable and financially sustainable to Kampala’s citizens.
Lastly, Hutton and Varughese (Citation2016) highlight the need for donors, public funding bodies, and decision-makers to engage in the larger and more difficult discussion about sub-populations and service levels that should be supported with public funds in order to reach SDG6.2 and SDG6.3. Decision-makers may need to decide whether available public funds should be spent on bringing basic water and sanitation services to under-served sub-populations, or on improving services to those who already enjoy basic services.
Conclusions
The existing SFD estimates the sewage regime to have higher performance than the SF regime in Kampala. However, in the Greater Kampala setting only 1.3% of the population are connected to the sewage regime, showing the importance of continuing focus on infrastructural improvements in the FS regime. The FS regime has many performance uncertainties, regarding, for example (i) estimates of ‘safely managed’ FS that is simply stored (ii) estimates of what ‘treatment’ actually takes place in current septic tanks and VIPs, (iii) the extent of current greywater management practices, and (iv) strategic improvements to adequately manage greywater in the FS regime. There is therefore a need for more knowledge on functionality within the existing FS regime in Kampala. Furthermore, capacity has already been reached in the transport and treatment steps of the service chain in the FS regime and further expansion is needed.
According to our calculations, the sewage regime is a 13-fold more costly service (USD 186 capita−1 year−1) than the FS regime (USD 14 capita−1 year−1) and the household contribution to the total system cost is only 14%, compared with 93% for the households connected to the FS regime. The financial sustainability of the sewage regime can be questioned, given how much public funds are used to effectively subsidize sewer-connected customers, but not customers within the FS regime. From an equality perspective, each sanitation regime should receive a proportional share of subsidies via public funding, which is not the case today. Hence, in their allocation of public funds for sanitation, decision-makers should consider (i) number of customers within the regime, (ii) total capital costs and operating costs of services in each regime, (iii) cost re-allocation between stakeholders, and (iv) infrastructure performance in each regime. Furthermore, decision-makers need to start considering alternative sanitation systems and services, in order to provide affordable and financially sustainable sanitation services to Kampala’s citizens.
Supplemental Material
Download PDF (685.4 KB)Disclosure statement
No potential conflict of interest was reported by the authors.
Supplementary Material
Supplemental data for this article can be accessed here.
Additional information
Funding
Related Research Data
References
- Chowdhry, S., and D. Koné. 2012. Business Analysis of Fecal Sludge Management: Emptying and Transportation Services in Africa and Asia - Draft Final Report. Seattle, WA: Bill & Melinda Gates Foundation.
- Daudey, L. 2018. “The Cost of Urban Sanitation Solutions: A Literature Review.” Journal of Water Sanitation and Hygiene for Development 8 (2): 176–195. doi:10.2166/washdev.2017.058.
- Dodane, P. H., M. Mbéguéré, O. Sow, and L. Strande. 2012. “Capital and Operating Costs of Full-Scale Fecal Sludge Management and Wastewater Treatment Systems in Dakar, Senegal.” Environmental Science and Technology 46 (7): 3705–3711. doi:10.1021/es2045234.
- Fay, M., S. Hallegate, A. Kraay, and A. Vogt-Schilb. n.d. Discounting Costs and Benefits in Economic Analysis of World Bank Projects. World Bank Internal Note. Washington, DC: World Bank Group.
- Geels, F. W. 2002. “Technological Transitions as Evolutionary Reconfiguration Processes: A Multi-Level Perspective and a Case-Study.” Research Policy 31 (8–9): 1257–1274. doi:10.1016/S0048-7333(02)00062-8.
- Government of Uganda/KCCA. 2017. Final Report - Consultancy Services Provided for Sanitation Mapping/Baseline Survey. Grant: City Partnerships for Urban Sanitation Service Delivery in Africa and South Asia. Supported by DFID and BMGF. Kampala, Uganda: Government of Uganda & Kampala Capital City Authority.
- Government of Uganda/NWSC. 2015. Kampala Sanitation Master Plan Update - Volume 1: Report. Kampala, Uganda: Government of Uganda & National Water and Sewerage Corporation.
- Hutton, G., and M. Varughese. 2016. The Costs of Meeting the 2030 Sustainable Development Goal Targets on Drinking Water, Sanitation, and Hygiene. Washington, DC: World Bank Water and Sanitation Program (WSP).
- Lalander, C. H., J. Fidjeland, S. Diener, S. Eriksson, and B. Vinnerås. 2014. “High Waste-to-Biomass Conversion and Efficient Salmonella Spp. Reduction Using Black Soldier Fly for Waste Recycling.” Agronomy for Sustainable Development 35 (1): 261–271. doi:10.1007/s13593-014-0235-4.
- Mara, D. D. 1996. “Low-Cost Sewerage.” In Promotion Through Innovation/Innovative Technologies, edited by Duncan Mara, 249–262. Chichester, UK: Wiley.
- Ministry of Water and Environment. 2013. Water Supply Design Manual. 2nd ed. Kampala, Uganda: Ministry of Water and Environment.
- Murungi, C., and M. P. van Dijk. 2014. “Emptying, Transportation and Disposal of Feacal Sludge in Informal Settlements of Kampala Uganda: The Economics of Sanitation.” Habitat International 42 (April): 69–75. doi:10.1016/J.HABITATINT.2013.10.011.
- Nakagiri, A., R. N. Kulabako, P. M. Nyenje, J. B. Tumuhairwe, C. B. Niwagaba, and F. Kansiime. 2015. “Performance of Pit Latrines in Urban Poor Areas: A Case of Kampala, Uganda.” Habitat International 49: 529–537. doi:10.1016/j.habitatint.2015.07.005.
- Niwagaba, C. B. n.d. Shit Flow Diagram (SFD) for Kampala City. Draft Report Prepared as Part of the Deliverables for AfWA on the Project Reinforcing African Sanitation Operators Partnerships (RASOP), under Review. Abidjan, Côte d'Ivoire: African Water Association.
- Peal, A., B. Evans, I. Blackett, P. Hawkins, and C. Heymans. 2014. “Fecal Sludge Management (FSM): Analytical Tools for Assessing FSM in Cities.” Journal of Water, Sanitation and Hygiene for Development 4 (3): 371–383. doi:10.2166/washdev.2014.139.
- PEAU. 2018. Personal Communication, 25th October, 2018. Kampala, Uganda: Private Emptier Association Uganda.
- The Republic of Uganda. 2015. Millennium Development Goals Report for Uganda. Special Theme - Results, Reflection and the Way Forward. http://www.ug.undp.org/content/uganda/en/home/library/mdg/final-millennium-development-goals-report-for-uganda-2015.html
- Ross, I., R. Scott, and R. Joseph. 2016. Fecal Sludge Management : Diagnostics for Service Delivery in Urban Areas Case Study in Dhaka, Bangladesh. Washington, DC: World Bank Water and Sanitation Program (WSP).
- Satterthwaite, D. 2016. “Missing the Millennium Development Goal Targets for Water and Sanitation in Urban Areas.” Environment and Urbanization 28 (1): 99–118. doi:10.1177/0956247816628435.
- Schoebitz, L., C. Niwagaba, and L. Strande. 2016. SFD Promotion Initiative – Kampala, Uganda. Kampala, Uganda. https://www.susana.org/_resources/documents/default/3-2593-7-1478269444.pdf
- SFD Promotion Initiative. 2018. “SFD Manual - Volume 1 and 2. Version 2.0.” https://www.susana.org/_resources/documents/default/3-2357-7-1529046600.pdf#nameddest=Section_5
- Sustainable Sanitation Alliance. n.d. “SuSanA.” SFD Diagrams. Accessed 28 May 2019. https://sfd.susana.org/
- Tilmans, S., K. Russel, R. Sklar, L. Page, S. Kramer, and J. Davis. 2015. “Container-Based Sanitation: Assessing Costs and Effectiveness of Excreta Management in Cap Haitien, Haiti.” Environment and Urbanization 27 (1): 89–104. doi:10.1177/0956247815572746.
- United Nations. 2018. “2018 Revision of World Urbanization Prospects.” https://population.un.org/wup/
- van Welie, M. J., P. C. Cherunya, B. Truffer, and J. T. Murphy. 2018. “Analysing Transition Pathways in Developing Cities: The Case of Nairobi’s Splintered Sanitation Regime.” Technological Forecasting and Social Change 137: 259–271. doi:10.1016/j.techfore.2018.07.059.
- von Munch, E., and K. M. K. Mayaumbelo. 2007. “Methodology to Compare Costs of Sanitation Options for Low-Income Peri-Urban Areas in Lusaka, Zambia.” Water SA 33 (5): 593–602.
- WHO and UNICEF. 2017. “Progress on Drinking Water, Sanitation and Hygiene.” JMP Report. Geneva, Switzerland: World Health Organization (WHO) and the United Nations Children’s Fund (UNICEF). http://www.who.int/water_sanitation_health/publications/jmp-2017/en/
- WHO/UNICEF. 2015. Progress on Sanitation and Drinking Water - 2015 Update and MDG Assessment. Geneva, Switzerland: World Health Organization & UNICEF. http://www.who.int/water_sanitation_health/publications/jmp-2015-update/en/
- World Bank. 2009. Study for Financial and Economic Analysis of Ecological Sanitation in Sub-Saharan Africa. Nairobi, Kenya: World Bank Water and Sanitation Program - Africa (WSP).
- World Bank. n.d.. “Country Overview - Uganda.” Accessed 26 February 2019. http://www.worldbank.org/en/country/uganda/overview