
 ?Mathematical formulae have been encoded as MathML and are displayed in this HTML version using MathJax in order to improve their display. Uncheck the box to turn MathJax off. This feature requires Javascript. Click on a formula to zoom.
Abstract
In the past, reinforced concrete structures were built utilising plain reinforcement bars. Currently, this construction method is seldom considered by codes and research; however, many heritage structures are still standing and in need of proper assessment. In particular, there is a lack of knowledge on the effect of corrosion on the bond between concrete and plain reinforcement bars. To address this gap, pullout tests were performed on reinforced concrete specimens sourced from a decommissioned bridge originally constructed in 1935. The specimens were naturally corroded, as the use of accelerated corrosion techniques in structural tests is still debated.
A total of 156 pullout tests were conducted on specimens with varying thicknesses. The pullout force, active and passive slip, and corrosion levels were measured. The effect of corrosion on the bond strength, and the amount of visible damage owing to the presence of corrosion products, were influenced by the casting position of the reinforcing bars. The presence of stirrups influenced the post-peak behaviour, increased the residual bond strength, and helped maintain the bond strength in the presence of cracks and spalling damage. Additionally, current code provisions were found to provide conservative values for the peak bond stress of plain reinforcing bars.
1. Introduction
Engineering structures are increasingly expected to sustain higher loads, additional utility, and to maintain performance without loss of function. This ideal requires existing structures to withstand demands beyond which they might have been designed, and for their load-carrying capacity to persist in spite of deterioration effects. In a survey from 2011, about 86% of bridges in Europe were estimated to be made with reinforced or prestressed concrete (Kioumarsi, Markeset, & Hooshmandi, Citation2017). Reinforced concrete (RC) structures are vulnerable to deterioration effects, among which chloride-induced corrosion of the reinforcement bars is known to be the most common (Hobbs, Citation2001). Indeed, within the last several decades, a number of structural failures have been attributed to corrosion damage (Bertolini, Elsener, Pedeferri, & Polder, Citation2004). Additionally, in the U.S. alone, the annual direct cost of corrosion for highway bridges was estimated to $8.3 billion (Virmani, Citation2002). The magnitude of this phenomena, hastened by climate change (X. Wang, Stewart, & Nguyen, Citation2012), results in the need to properly assess and verify the strength of existing infrastructures, as demolition and reconstruction is neither economically nor sustainably viable.
The degradation process linked to corrosion occurs as a result of chemical depassivation, typically associated with carbonation and/or chloride penetration. Corrosion affects the structural performance in different ways: 1) the development of corrosion products results in a loss of the steel cross-sectional area; 2) corrosion products occupy a volume larger than uncorroded steel, inducing mechanical pressure on both the bar and the surrounding concrete; and 3) corrosion introduces a layer of corrosion products between the steel-concrete interface. These effects can compromise the function (Fernandez, Herrador, Marí, & Bairán, Citation2016; Malumbela, Alexander, & Moyo, Citation2009) and structural integrity of the structure (Dang & François, Citation2013; Fernandez, Herrador, Marí, & Bairán, Citation2018). In particular, the bond between the steel and surrounding concrete is strongly affected.
Previous studies discussed the impact of corrosion on the bond behaviour of deformed (ribbed) reinforcing bars, e.g. CEB-FIP Bulletin n.10,10 (Citation2000). The bond behaviour is commonly viewed as a result of three independent mechanisms: chemical adhesion, friction, and mechanical interlocking between the ribs and the concrete. Mechanical interlock provides the primary anchoring resistance. In connection with these studies, extensive research has been conducted on assessment methods for structures currently in use (Blomfors, Zandi, Lundgren, & Coronelli, Citation2018; Cairns, Plizzari, Du, Law, & Franzoni, Citation2005; Coronelli, François, Dang, & Zhu, Citation2019; Khan, François, & Castel, Citation2014; Kioumarsi, Hendriks, Kohler, & Geiker, Citation2016; Tahershamsi, Fernandez, Lundgren, & Zandi, Citation2017; Zhu, François, Cleland, & Coronelli, Citation2015); however, little information can be found, both at the theoretical and assessment levels, for the case of RC structures containing plain (smooth) reinforcement bars.
RC structures built with plain reinforcement bars are an older construction practice that has been almost uniformly replaced by deformed reinforcement bars. This transition occurred in Europe around the mid-1960s, though it varied among countries: Sweden phased out this practice in the 1940s, whereas Italy continued to use it through the 1980s (Verderame, Ricci, Esposito, & Sansiviero, Citation2011). Much infrastructure built during these years remains in use today, years after original construction. The need of assessing such structures was already emerging in the 90 s, where 42% of the infrastructure assessed by the London Underground Ltd was failed due to the absence of adequate data for the assessment of the anchorage of older structures (Baldwin & Clark, Citation1995). Nowadays, in Europe, 16% of concrete bridges currently in use are estimated to be between 50 and 100 years old (Bell, Citation2004).
Plain reinforcement bars do not have ribs with which to interlock with the surrounding concrete. The bond behaviour of plain bars is primarily a function of chemical adhesion and friction; mechanical interlock does exist, but only at a micro level dependent on the roughness of the steel. Sliding friction, i.e. the wedging action of small particles of concrete detached by the initiation of the slip, contributes to the post-peak behaviour of plain bars (Abrams, Citation1913). As can be expected, the bond strength for plain reinforcement bars is lower than that for deformed bars. Studies on deformed bars, with and without corrosion, are not applicable for the assessment of RC structures with plain bars owing to the different nature of the steel/concrete bond. The bond of plain bars relays mostly on friction (Lundgren, Citation2007); hence the increase in normal confinement given by the presence of the corrosion products is expected to increase the bond strength of the bar before the surrounding concrete is cracked. Additionally, the density of the concrete surrounding the bars is expected to have high impact on the bond behaviour. Top-cast bars are most likely surrounded by less dense concrete owing to settlements of aggregates and accumulation of bleed water below the bar (ACI Committee 408, 408, Citation2003). The lower density of concrete leads to a lower confinement of the bar and, consequently, lower bond strength for uncorroded, top-cast plain bars (Cairns, Du, & Law, Citation2006). This, on the other hand, results in a larger corrosion-accommodating region, delaying the appearance of corrosion-induced cracks and increasing the bond capacity in the presence of corrosion products (Robuschi, Lundgren, Fernandez, & Flansbjer, Citation2020).
Studies on plain bars have been mostly carried out by testing the bond between the concrete and the bars by means of pullout tests (Cairns & Feldman, Citation2018; Feldman & Bartlett, Citation2005; Melo, Rossetto, & Varum, Citation2015; Verderame, De Carlo, Ricci, & Fabbrocino, Citation2009; Verderame, Ricci, De Carlo, & Manfredi, Citation2009). Few studies are available in the literature on the effect of corrosion damage (Cairns, Du, & Law, Citation2008; Cairns et al., Citation2006; Fang, Lundgren, Chen, & Zhu, Citation2004), and all are based on artificially corroded specimens. Artificial corrosion methods are often preferred owing to their speed and efficiency, though questions arise as to whether these samples can adequately represent the natural phenomena experienced by real structures (Austin, Lyons, & Ing, Citation2004). Yingshu, Yongsheng, and Surendra (Citation2007) found that different corrosion-induction methods affect the surface condition of corroded steel bars: e.g. the galvanostatic method generates a homogeneously corroded surface, whereas in natural corrosion conditions the surface corrodes heterogeneously. Williamson and Clark (Citation2002) tested artificially corroded plain bars with different levels of corrosion (0-20%) and current densities (250-2000 µA/cm2). Varying the current density was found to affect the morphology of the corrosion products and, by extension, the bond capacity.
In this study, we opted to use naturally corroded specimens taken from a decommissioned structure. This permitted a focused investigation into the bond behaviour of corroded reinforcement bars in relation to visible indicators of damage/deterioration in the surrounding concrete. A few other studies also focused on naturally corroded specimens, attempting to link visible damage to the corrosion type, extent, and structural capacity (Fernandez & Berrocal, Citation2019; François, Khan, & Dang, Citation2013; Tahershamsi, Zandi, Lundgren, & Plos, Citation2014). However, to the authors’ best knowledge, there has been no study on naturally corroded, plain reinforcement bars available in the literature outside of those published by the authors themselves. This work, in fact, follows up on a previous structural investigation on the anchorage of plain reinforcement bars, carried out on specimens sourced from the same bridge (Robuschi et al., Citation2020). That study focused on the anchorage capacity of plain bars in structural members. The aim of this investigation, rather, is to characterise the local bond-slip behaviour.
2. Experimental testing
2.1. Test specimens
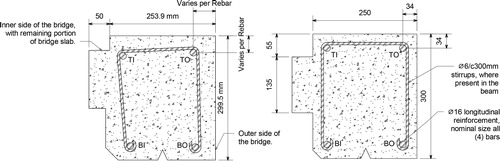
The test specimens were taken from edge beams at the decommissioning of an existing bridge in Gullspång, Sweden. The bridge was built in 1935 and torn down in 2016 owing to heavy corrosion damage. As is common for bridges of the time, the concrete used was characterised by large aggregates, and the production of the edge beams was cast in place by tamping instead of vibrating. The type of reinforcing steel used was plain steel bars. Specifically, the edge beams, which were chosen as the subject of this study, featured ϕ6 stirrups open on the bottom side with respect to the original position on the bridge, and 2ϕ16 plain reinforcement bars on the top and bottom. shows a representation of a general specimen, including marked locations of bars.
Figure 1. Drafted reference of RC specimen (dimensions in mm). The left image shows width, height, and bar positioning based on average measuraments of all specimens. The right image shows nominal dimensions from original drawings of the bridge. Bars are labelled as follows: TO = top-outer, TI = top-inner, BO = bottom-outer, and BI = bottom-inner. The remaining part of cut-off bridge slab is clearly visible on the left.
The edge beams along the entire bridge length on both the west and east sides were carefully taken out, cut in 2 to 6 m segments, and designated to be used for research. In ,the layout of the edge beams is presented. Each segment of the edge beams extracted from the bridge and used for testing is denoted by a number. The segments were later cut in smaller pieces to fit the design of the experimental campaign. Letters were used to denote the specimens resulting from these later cuts, in addition to the original number of the segment. Having been exposed for 81 years to weather conditions that included snow, freezing-thawing cycles, and wind, as well as to deicing salts and traffic loads, the edge beams presented different levels of damage, i.e. cracking on their surfaces and spalling of the concrete cover. Signs of corrosion were clearly visible but were not uniform along the bridge length.
Figure 2. Original position of the segments extracted from Gullspång bridge. A number was assigned to each segment of the edge beams as received after the demolition of the bridge. Letters were used to denote later cuttings, carried out in the laboratory. The cutting was carried out with all the segment oriented in the same direction: this implies that the specimens from the west edge beams were named in alphabetical order from north to south, while the specimens from the east edge beam followed the alphabetical order from south to north (see above). Please note that the drawing is not in scale.
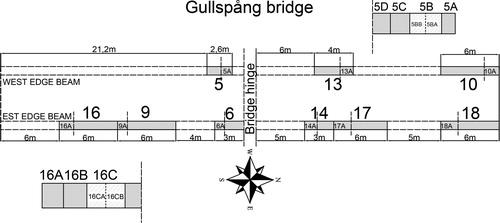
Parts of the extracted specimens were used in structural tests, while others, presented in this work, were used for pullout testing of the steel reinforcements. The pullout specimens consisted of segments cut from the edge beams using a concrete saw. The section thickness t was divided into three categories: 50 mm, 75 mm, and 100 mm. Each grouping was allocated 17 specimens each. The specimens were labelled with a name composed of two parts, of which the first denotes the original position on the bridge, and the second denotes the thickness of the specimens. For example, in specimen” 5EL50”, 5E indicates the position on the bridge (see , and L50 indicates that the specimen had a nominal thickness of 50 mm. The thickness was determined based on previously conducted pilot tests on specimens sourced from the same edge beams (Lundgren, Robuschi, & Zandi, Citation2019) and taking into consideration the material properties of the steel. The purpose for varying the specimen thickness was to include the effect of the bonded length on the pullout behaviour in the study. In addition, 10 specimens of different thicknesses were cut to contain a stirrup so that the influence of the confinement effect given by the presence of a stirrup on the bond strength could be studied as well. The mechanical properties of the concrete and steel material were determined in Robuschi et al. (Citation2020). The compressive strength of the concrete was evaluated as 45.6 MPa with a standard deviation of 4.6 MPa. The tensile strength of the steel bars was measured in 27 tensile tests of uncorroded bars. The average yield stress was 259.6 with a standard deviation of 10.1 MPa.
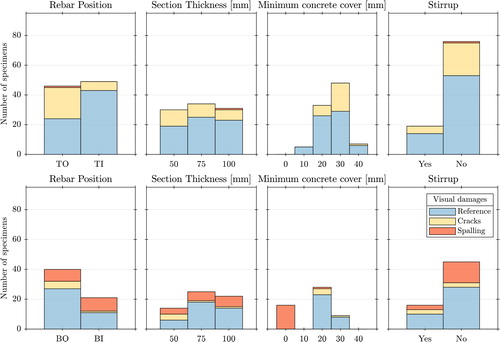
In order to track the original position of the bars on the bridge, a naming convention was used: Top-Outside (TO), Top-Inside (TI), Bottom-Outside (BO), and Bottom-Inside (BI) (see ). ‘Top’ and ‘bottom’ refer to top-cast and bottom-cast bars, and ‘outside’ and ‘inside’ denote the exterior and interior sides of the edge beams as positioned on the bridge, respectively. The specimens were inspected for external damage before testing. Inspections considered both sides of each specimen and tracked information relevant to individual bars: concrete dimensions, concrete cover, and visible cracks (see ). Each bar was classified based on the extent of visible deterioration of the concrete cover around the bar location. The ‘reference’ (R) state corresponds to the absence of visible damage. Moderate damage, i.e. cracking without loss of the concrete cover, is defined a ‘cracked’ state (C). Substantial damage, i.e. cracking and spalling of the concrete cover, is defined a ‘spalled’ state (S). shows a tabulation of the dataset sorted by bar position, section thickness, minimum concrete cover, presence of a stirrup and classification. Note that measurements of the minimum concrete cover were conducted on the specimens as received after the demolition of the bridge. A concrete cover equal to zero indicates spalling of the concrete and does not represent the minimum concrete cover in the original design of the structure.
Figure 3. Examples of test specimens with varying deterioration states.
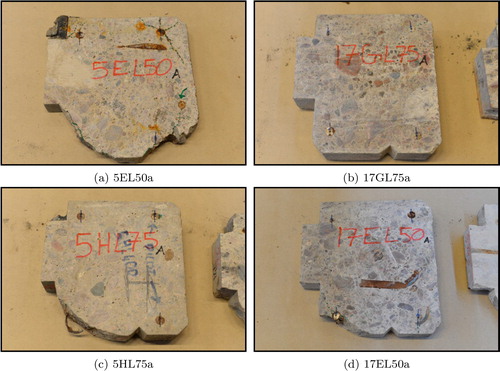
Figure 4. Inventory of tested samples, divided by category (Reference, Cracks, and Spalling).
2.2. Test preparation
Specimen acquisition through saw-slicing of the edge beams led to two important challenges for the pullout-test preparation. First, the steel bars were cut at the concrete surface level. Second, the cutting method did not allow for obtaining perfectly flat surfaces. A threaded drill into the steel bars was chosen as solution to prolong the bar length with an extension threaded rod.
Owing to the nonparallel opposite faces of the specimens, the drilling setup had to be adapted. This was done with a specific setup consisting of a drill press and the combination of a pin support and two variable-height bearing platforms. This arrangement allowed for the angular positioning of the specimen in order to position the drill press concentric about and parallel with the bar longitudinal axis. The objective was to best align the pullout axis along the bar axis to ensure a straight pullout. Possible misalignment between the pullout axis and the bar axis was later checked using 3 D scanning data, but no significant errors were found (see section 3.3).
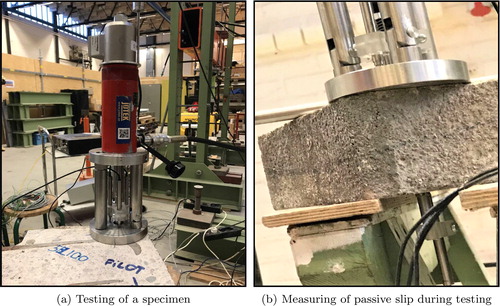
An 8 mm-diameter, 20 mm-deep shaft was drilled into each bar, and threading was performed using manual tooling. The hole diameter, length, and thread distance were selected based on the expected bond strength of the bars and the yield strength of the drilled zone. shows the complete test set-up during testing of a specimen. This setup allowed for pullout forces up to 40 kN. Over 40 kN of force, yielding of the threaded section of the bar, followed by failure of the threaded rod at approximately 46 kN, was expected.
Figure 5. Photographs of pull-out rig assembly and slip measurements during testing of a specimen.
2.3. Pullout testing
Pullout testing employed a testing rig developed in-house (Lundgren et al., Citation2019), see and . This was necessary to compensate for the aforementioned inclination of the concrete surface owing to the specimen preparation so that the bar could be pulled out straight.
Figure 6. Pullout rig (dimensions in mm), designed by Laboratory Engineer Sebastian Almfeldt.
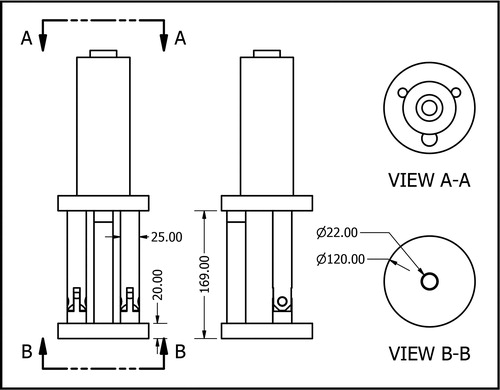
The rig was designed to ensure that the applied load was exactly in the same direction of the bar axis. The rig was composed of two thick steel plates separated by three steel rods acting as legs. One of the steel plates acted as a base plate and was positioned in direct contact with the test specimen. The second steel plate acted as support for the hydraulic jack. Holes centred in the plates facilitated the connection of a threaded rod between the hydraulic jack and the bar. Two legs were attached to the base plate via pinned connections and were attached rigidly to the top plate. This permitted variable positioning of the jack relative to the base plate, thus aligning the bar. The third leg contacted the base plate as a bearing surface and had an adjustable height by screwing up through the top plate. This leg was locked in position to define the desired rig-alignment angle prior to pullout testing.
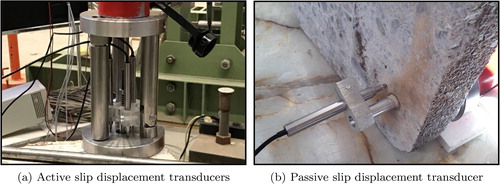
Slip between concrete and steel was measured using four displacement transducers (LVDTs). Three transducers were located above the base plate and tracked the so-called ‘active’ slip of the pulled bar relative to the top surface of the base plate. The transducers were connected to a hollow steel tube positioned around the rod but large enough to avoid contact. The steel tube was pushed against the bar with the help of a spring, and the transducers measured with respect to the base plate. In this way, the active slip measurement was possibly only affected by settlements between the base plate and the concrete. The fourth transducer was glued to the bar and positioned against the bottom surface of the specimen to measure the so-called ‘passive’ slip of the bar relative to the bottom surface of the concrete. The specimens were positioned on a support surface specially designed to have a hole in line with the bar axis. This allowed for positioning of the LVDT that measured the passive slip. gives two views of testing rig and slip transducers.
Figure 7. Photographs of pull-out rig and slip measurement devices. Note that specimen (b) is tilted with respect to normal testing position to better show the measurement device.
Pullout testing employed a displacement-controlled loading scheme limited to 5 mm of measured passive slip. The loading rate was defined as separated for pre-peak (0.10 mm/min) and post-peak phases (0.50 mm/min). The post-peak loading was initiated once the force in the hydraulic jack dropped below 80% of peak. Testing was stopped when the measured force exceeded an imposed limit of 46 kN to avoid rupture of the threaded rods.
3. Evaluation of corrosion level and bond stress
3.1. Cleaning of bars
Following pullout testing, all specimens were broken to extract the bars. Cleaning of the bars was performed inside a sandblasting cabinet using silica sand at 5-7bar of pressure. The process followed recommendations as detailed in Fernandez, Lundgren, and Zandi (Citation2018). Cleanliness (i.e. removal of the corrosion product) was determined on the basis of visual inspection.
3.2. Three-dimensional scanning for surface geometry
High-resolution surface geometry measurements were captured for each of the cleaned bars. This was performed using a three-dimensional (3 D) scanning software as detailed in Tahershamsi et al. (Citation2017). The measurement tool was a portable laser scanner, Hand Scan 700TM, from Creaform 3 D® coupled with the software VXElements (Creaform, n.2017d.). The scanning equipment was calibrated to an accuracy of 20 µm with a maximum spatial resolution of 0.1 mm. The high resolution of data collection allowed for sufficiently detailed replication of the surface.
3.3. Evaluation of corrosion level from 3 D scanning results
The corrosion level of each bar was calculated as the percent of area loss at cross sections along the length of the individual bar:
(1)
(1)
where An was the nominal bar cross-sectional area, i.e. the cross-sectional area of the bar before the corrosion process; and
was the average bar cross-sectional area. The area parameters were obtained from the 3 D scanned geometry; details are described below. Preliminary filtering of the 3 D scanned point cloud data was required to remove instances of erroneous scatter and ‘disturbed’ zones at either end of the bar and to align the axis concentric about the pullout axis. From this analysis, misalignment between pullout direction and bar axis was found not to exceed 3
The sample was virtually sliced along the length at intervals of 20 µm to allow for calculation of the average cross-sectional area
and the average cross-sectional perimeter
for each bar.
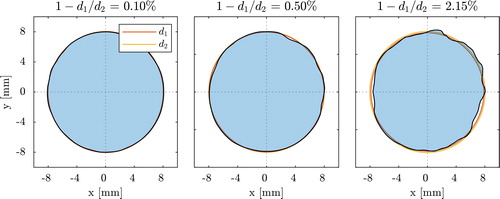
The bar nominal area An, i.e. the cross-sectional area of the bar before the corrosion process, was calculated according to Robuschi et al. (Citation2020) based on the assumption that an uncorroded cross section could be idealised as circular. The circularity of each cross section was evaluated based on the ratio between two idealised circular diameters with d1 the diameter of the idealised circle having an area equal to the cross-sectional area Ai, and d2 the diameter of the idealised circle having the same perimeter as the cross-sectional perimeter pi. For the case of a circular cross section, these values were identical, while d2 increased for noncircular bars. The tolerance was set to be equal to 0.1%. provides a visual reference of the calculated circularity against the cross-sectional appearance.
Figure 8. Example of cross-sectional circularity evaluation.
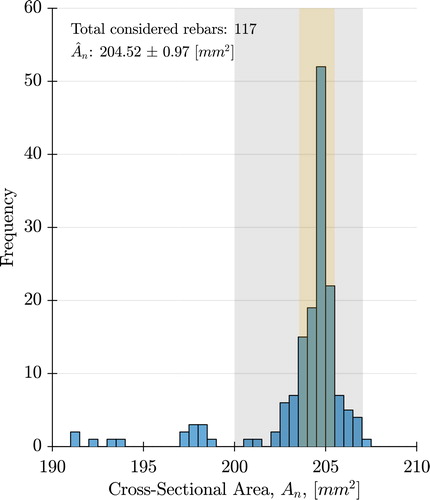
When no cross sections within an individual bar met the circularity limit, i.e. no uncorroded section was found, were assigned as the average calculated from all ‘acceptable’ cross sections across the entire dataset:
respectively. indicates that three distinct bar sizes were present in the dataset. However, only the range of bars describing the most populous size was considered in assigning
for the ‘non-circular’ bars. Data suggesting the existence of two other possible sizes were considered negligible given the small amount of samples collected. The corresponding
calculated in a similar matter, was 50.65 ± 0.39 mm. When the calculated corrosion resulted negative, zero corrosion was assumed.
Figure 9. Calculated nominal bar area assigned to bars without any circular cross section. The grey shaded region denotes the range over which bar areas were averaged in assigning
for ‘noncircular’ bars, and the yellow shaded region indicates associated standard deviation in area assignment.
3.4. Evaluation of bond stress
In this work, the authors assumed the bond constant along the length of the bar. Uniformly distributed bond stresses at peak can be explained by assuming the local bond slip curve to have a plateau (as in, e.g. CEB-FIP (Citation2013)). Additionally, this assumption provides conservative values for the peak and residual bond strength and allows for comparison with previous results from literature (Cairns et al., Citation2006; Fang et al., Citation2004; Feldman & Bartlett, Citation2005; Melo et al., Citation2015; Verderame, De Carlo, et al., Citation2009).
The measured pullout force (F) was thus converted into the average bond stress () by assuming a uniform bond along a cylindrical contact surface area:
(2)
(2)
where
is the nominal perimeter of the bar,
is the measured length of the bar, and
is the accumulated passive slip, sourced from LVDT measurements. The length of the bars was measured with the help of a digital caliper. It is to be observed that the bond calculation adopted a surface area which is a conservative overestimation for some of the extensively cracked (C) or spalled (S) specimens.
4. Results and discussion
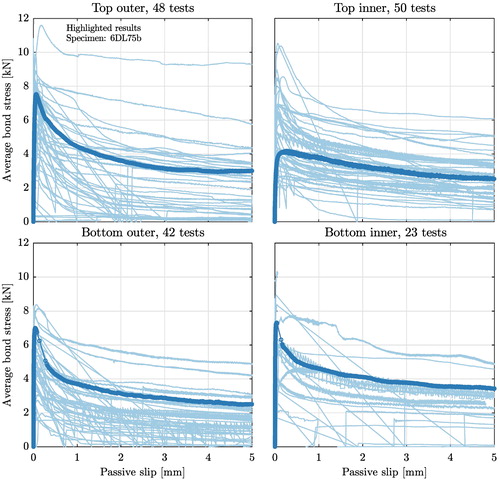
This chapter presents the outcomes from the experimental test regime. shows an overlay plot of all pullout records with results separated by bar position. The average bond stress is plotted against the passive slip. Curves from the bars of one specific concrete sample (four bars, each with a different position in the cross section of the edge beams) are highlighted for illustration purposes. A high scatter in the results was observed in the same specimen as well as between bars sharing the same location in the cross section. Different behaviours can be observed both at peak and after peak. To explain these differences, parameters possibly influencing the bond slip relation were investigated. The corrosion level, presence of a stirrup, and casting position were identified as the most relevant influencing factors.
Figure 10. Average bond stress vs. passive slip for entire dataset. Bars from the same sample with different cross-section locations are highlighted as an example.
4.1. Peak bond stress
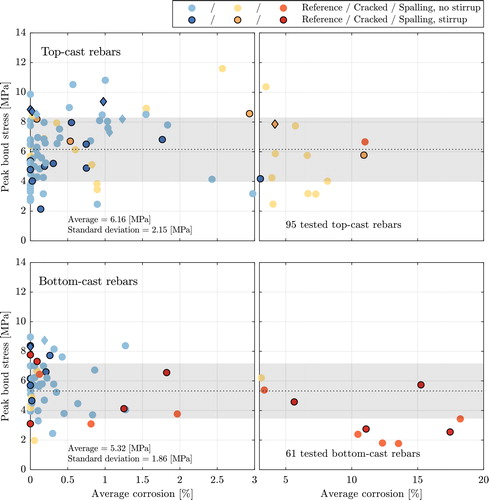
In , the average bond stress at peak of each bar is plotted against the average corrosion level for all tested specimens. On the x-axis, corrosion is presented on two different scales: (from 0 to 3% and from 3 to 20%). This was done to allow the reader to focus on the area with the highest concentration of data, namely, below 3% of corrosion, while still having a full overview of the dataset in the same figure. The grey shaded area corresponds to the average bond stress across the displayed dataset, and the corresponding standard deviation. Successful tests are included in the presented results, together with tests that exceeded the rig capacity, which are marked with a separate marker. Few tests, all 100 mm long, exceeded the rig capacity; possible causes were the overloading of the connecting rod or the yielding of the tested bar. The tests were included by assuming the peak bond stress equal to the maximum bond stress reached during testing.
Figure 11. Peak bond stress vs. average corrosion across entire dataset, divided by casting position. Deterioration classification is designated by colour. Dashed black lines mark average value of peak bond stress, and grey colour patches indicate plus/minus one standard deviation. Specimens which exceeded rig capacity are marked with diamond markers.
4.1.1. Influence of corrosion on peak bond stress
In , different behaviours and characteristics of bottom-cast and top-cast specimens are shown. For top-cast bars, the peak bond stress initially increases with increasing corrosion levels. Loss of bond capacity follows, in connection with the opening of cracks in the surrounding concrete. Bottom-cast bars, instead, show a constant decrease in bond capacity with increasing corrosion level. Spalling damage in the concrete surrounding the bars is already present at relatively low levels of corrosion. Uncorroded bars, however, present highly scattered results for both casting positions.
As stated above, differences in the visible damage of the specimens in connection with their corrosion level can be observed between top-cast and bottom-cast bars. Many top-cast bars present cracks in the surrounding concrete. This is not true for bottom-cast bars, where few specimens show cracks in the concrete surrounding the bar and often for low corrosion levels (see ). Spalling is instead more common for bottom-cast specimens. It appears that similar levels of corrosion influence the cracking behaviour of the specimen differently depending on the bar position: top-cast specimens crack for larger corrosion levels than bottom-cast ones and present smaller crack openings. In , the average corrosion levels of specimens with different visible damages are shown. The specimens are divided between top-cast and bottom-cast bars, and on the basis of the average width of the observed crack(s). For the case of specimens with multiple cracks, the cumulative crack width is considered.
Figure 12. Average corrosion level of specimens with cracks in the surrounding concrete, sorted by crack width. Note that the y-axis is in logarithmic scale.
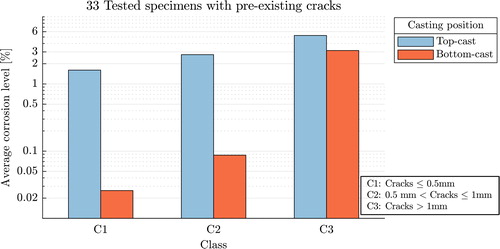
The average corrosion level of top-cast bars is shown to be significantly higher than the one of bottom-cast bars with similar measured crack width in the surrounding concrete. Such behaviour can be explained by considering different densities of the concrete surrounding the bars. For the case of top-cast bars, the presence of larger voids in the concrete around the bar allows for the corrosion product to expand freely to a higher corrosion level before generating stresses high enough to crack the surrounding concrete. This process, at the same time, increases the confinement on the bar and consequently the bond. Accordingly, an initial increase in the peak bond strength with the corrosion level of top-cast bars can be observed in . This observation does not hold true for bottom-cast specimens, where a higher concrete density leads to the opening of splitting cracks at lower corrosion levels and, consequently, to a loss of bond strength.
4.1.2. Influence of stirrups on peak bond stress
In , spalled specimens are shown to maintain relatively high peak bond stresses. Such observation needs to take into account the absence of data on missing bars in the figure. Many bars had, in fact, approximately 0 MPa bond stress and fell off during test preparation as a result of severe spalling. These results were not included in the figure, but the presence of missing specimens is highlighted by the difference in the number of tested specimens between bottom-cast and top-cast bars (see ). In total, 32 of the 34 missing bottom-cast specimens were a consequence of severe spalling. However, of the 20 bottom-cast specimens with a stirrup that were tested, 15 resulted in successful testing despite the presence of splitting cracks in the surrounding concrete (see ). Thus, the presence of a stirrup helped to maintain bond capacity in the presence of spalling of the concrete cover.
In , the average peak bond stresses are listed, following previous classifications (casting position and presence of a stirrup). The presented values are in line with previous results where top-cast bars were shown to maintain high bond strength in spite of external damage. The same does not apply to bottom-cast bars, where the average bond is substantially decreased by the external damage. The presence of a stirrup increases the bond strength of cracked and spalled specimens. The presence of a stirrup is also observed to marginally increase the bond strength of uncracked (reference) bars, but only for bottom-cast bars.
Table 1. Peak bond stress values across dataset.
4.1.3. Influence of visual damage on peak bond stress
In , data from specimens of category” C” are plotted against the corresponding corrosion level. Two different colour classifications are presented: in the top plot, specimens with cracks are classified based on the number of cracks in the surrounding concrete. In the bottom plot, bars are classified based on the maximum crack width. Both the crack width and number of cracks are observed to increase with the corrosion level. On the other hand, specimens with a stirrup were observed to be less affected by the presence of cracks and maintained higher bond stresses in the presence of large and multiple cracks.
Figure 13. Peak bond stress vs. average corrosion for cracked specimens. In the upper figure, the number of cracks surrounding the bar is designated by colour. In the lower figure, colour indicates different maximum crack width openings. Dashed black lines mark the average value of peak bond stress, and grey colour patches indicate plus/minus one standard deviation.
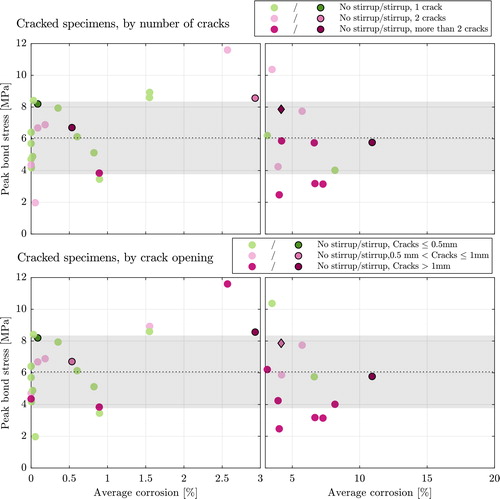
Corrosion induced cracks are the result of pressure generated by increasing amounts of corrosion products at the bar-concrete interface. The formation of such cracks is a complex phenomenon, as it is not only linked to the loss of cross-sectional area in the steel, but also to the chemistry of the corrosion product, the presence of voids around the bars (corrosion accommodating region), as well as the external environment (Papakonstantinou & Shinozuka, Citation2013). Numerous models are presented in literature linking measured corrosion loss to corrosion-induced cracking, (Dai, Bian, Wang, Potier-Ferry, & Zhang, Citation2020; L. Wang, Dai, Bian, Ma, & Zhang, Citation2019), however, the applicability of such models is often limited, and current research is still in need of more comprehensive models to increase accuracy in the prediction of corrosion-induced cracking (Khan et al., Citation2014). In this study, despite the observed difference in corrosion levels corresponding to a certain crack width between top-cast and bottom-cast bars (see ), a general trend showing increasing number of cracks and increasing crack width with increasing corrosion level can still observed.
4.2. Residual bond stress
In , the residual bond stress is plotted against the peak bond stress for each tested specimen. The residual bond stress is defined in this work as the bond stress at 4.5 mm of passive slip (see Section 3.4). Data are divided by bar position in the cross section, and conventions similar to those in previous figures are used.
Figure 14. Residual bond stress vs. peak bond stress. Specimens are divided by casting position. Two different linear fits are presented per graph: in blue, specimens with a stirrup, in red, specimens without a stirrup.
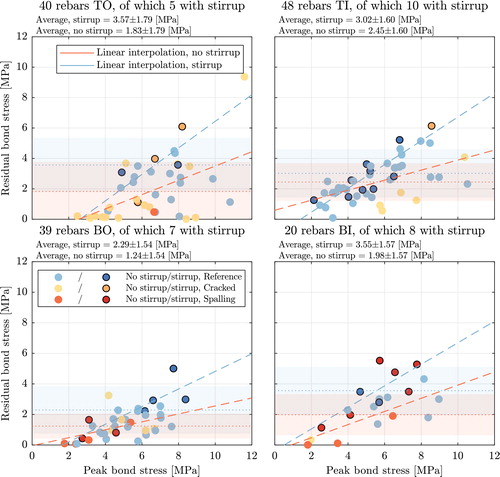
The average residual bond stress is evaluated separately for bars belonging to specimens with and without a stirrup. The same applies to the linear interpolation of the data, represented in figure with a dotted line. Three main observations are made: 1) the residual bond stress increases with increasing peak bond stress, 2) the residual bond stress is higher for specimens with a stirrup, and 3) the residual bond stress is higher for reference specimens and lower for spalled specimens if no stirrup is present. The latter implies that the presence of corrosion decreases the residual bond strength of the bar.
The contribution of the stirrup to the residual bond strength is particularly evident for the bottom-inner cast bars. This cross-section location encompassed a significantly larger number of specimens affected by severe spalling. While only 50% of tests were successful in this category, the majority of the specimens containing a stirrup were satisfactorily tested. This is explained by the additional confinement provided by the stirrup.
4.3. Slip at peak bond stress
Pullout tests allow for investigating the slip at which the maximum bond action is developed (smax). Previous literature (Verderame, De Carlo, et al., Citation2009) argued that the difference between passive and active slip is fundamentally negligible for plain bars given the particularly low load-transferring capacity of the bar type. This implies that the bar acts like a rigid body and is generally connected with the assumption of a uniform bond stress distribution along the length of the bar. Bars with a length up to five times their diameter are commonly assumed to present a uniform bond stress distribution (CEB-FIP, Citation2013).
However, in this study, relatively large differences were observed between active and passive slip measurements. The observed difference was significant both at peak force and after, when the force had reached the residual stage. This difference was found to be too large to be explained by the elongation of the steel in tension. This implies that the slip measurement was affected by settlements between the plate of the pull-out rig and the concrete surface and by the deformations in the concrete, in compression during the pull-out test. Since the active slip was measured as the relative displacement between the pull-out rig and the reinforcing bar, this measurement is considered unreliable, and was excluded from the test results.
In , the passive slip at peak force, is plotted against the peak bond stress. Results for top-cast bars are plotted in the upper part of the figure, while results for bottom-cast bars are plotted in the lower part. Similar conventions as in the previous images are used. Two dashed lines mark the average value of the passive slip at peak bond stress for specimens with and without a stirrup, and a patch of the same colour indicates plus/minus one standard deviation.
Figure 15. Peak bond stress and corresponding passive slip across entire dataset. Deterioration classification is designated by colour. Dashed lines mark the average value of slip at peak bond stress with and without stirrups, and patches of same colour indicate plus/minus one standard deviation.
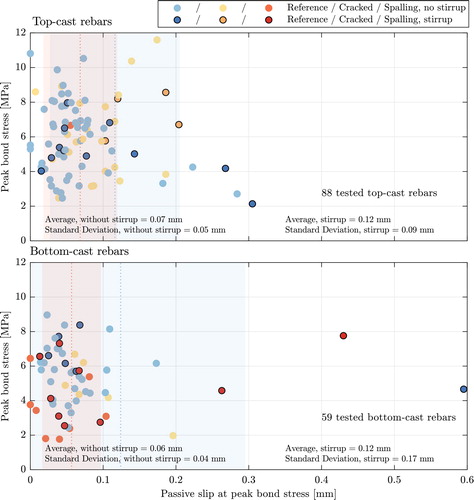
In Model Code 2010 (CEB-FIP, Citation2013), the slip at peak bond, smax, is assumed to be independent from the peak bond stress and corresponds to 0.1 mm. Results from this study showed a slightly smaller slip at peak compared to previous studies for samples without a stirrup, averaging 0.07 ± 0.05 mm for top-cast bars and 0.06 ± 0.04 mm for bottom-cast bars. No conclusion for the influence of the casting position on the bond stiffness could be determined, but the presence of a stirrup was observed to allow for larger slip values.
In one of the earliest studies on bond properties (Abrams, Citation1913), the bond resistance was observed to reach its maximum value at a passive end slip of about 0.25 mm, and smax was considered independent from other variables. A similar value was given in a more recent analytical model by Verderame, De Carlo, et al. (Citation2009), where smax was treated as an empirical constant equal to 0.23 mm. In this case, smax was evaluated as the average between the measured active and passive slip. Additionally, Verderame, De Carlo, et al. (Citation2009) observed a trend where smax increased together with the peak bond stress. Melo et al. (Citation2015) later suggested a modified version of the same model, where smax was reformulated as a function of the embedded length based on experiments where either active or passive slip were measured. They were assumed to be approximately equivalent given the small elongation of the bar. Such a trend, i.e. an increase in smax with the embedded length, was not observed in the present study (see ). For specimens with a stirrup, the data instead suggested the opposite trend, but the scatter in the collected data did not allow for definitive conclusions.
Table 2. Slip at peak bond stress values across data set.
4.4. Discussion
The bond stress curves obtained showed a peak bond strength higher than in most of the previous studies available in the literature with regard to plain uncorroded bars.
In Model Code 2010 (CEB-FIP, Citation2013), the bond of hot-rolled plain reinforcement bars is calculated as a function of the concrete compressive strength expressed in MPa (). Good and poor bond conditions (depending on the confinement of the bar) are distinguished, and a reduction factor of 0.5 is suggested for poor conditions (
). This assumption yields a maximum predicted peak bond stress of c.a. 2 MPa for good bond conditions or 1 MPa for poor bond conditions for the tested bars. However, looking at the present results, only a few tests resulted in a peak bond stress lower than 2 MPa if the results of severe spalling were excluded. Other bond models can be found in the literature for uncorroded plain bars, most commonly based on the results of simple pullout tests (Cairns & Feldman, Citation2018; Feldman & Bartlett, Citation2005; Melo et al., Citation2015; Verderame, De Carlo, et al., Citation2009; Verderame, Ricci, et al., Citation2009). Such models predicted a peak bond stress similar to that given in Model Code 2010.
Very few works on plain corroded bars can be found in the literature. Cairns et al. (Citation2006) tested a total of 48 specimens (18 RILEM pullout tests and 30 beam end tests) with artificially corroded plain bars at different levels of corrosion and developed an empirical expression for evaluating the bond strength, taking into account the concrete strength, longitudinal cracks and cover/diameter ratio. As in this study, top-cast bars were observed to increase bond strength with an increase in the corrosion level, while bottom-cast bars lost bond strength. However, the bond strength of top-cast bars was observed to be initially much lower than that of bottom-cast bars. This result was in general not reflected by the data presented in this paper, where the average peak bond stress of reference bars was estimated to 6.07 ± 2.10 MPa for top-cast bars and to 5.88 ± 1.66 MPa for bottom-cast bars. It is however true that a large number of uncorroded, reference, top-cast bars had a peak-bond stress lower than the average, but the high scatter in the results did not allow for a definite conclusion. Additionally, Cairns et al. (Citation2006) measured a bond strength between 1 and 3 MPa, which is a low value compared with these test results.
By contrast, a second study on artificially corroded specimens by Fang et al. (Citation2004) presented higher values than this study for the bond strength of moderately corroded plain bars (peak bond stress up to 16 MPa). The study consisted of 16 pullout tests of plain bars with different levels of corrosion. The peak bond strength was observed to increase with corrosion to a threshold of 2-4% in corrosion level. The presence of a stirrup was observed to help maintain this increase in peak bond strength even at higher levels of corrosion (over 4%). Specimens without a stirrup instead registered a decrease in bond strength for higher corrosion levels.
Higher peak bond stress values were obtained in a study on naturally corroded specimens by the authors (Robuschi et al., Citation2020). The study investigated the anchorage capacity of beams taken from the same bridge as this study (Gullspång bridge) using a three-point bending test setup. On average, the peak bond stresses obtained were higher than those in this work (with an average for the entire sample equal to 7.39 MPa, compared to 5.83 MPa in this work). However, it is important to point out that all of the tested beam specimens presented a stirrup in the anchorage failure zone. Additionally, the use of a direct support in the three-point bending test setup may have contributed to an increase in the bond capacity. Similar trends regarding the effects of corrosion on the bond capacity were observed in both studies.
A common factor in the cited studies is the initial increase in the bond strength with low amounts of corrosion products, especially for top-cast bars. Additionally, similar differences in behaviour between top-cast and bottom-cast bars were observed by the authors and by Cairns et al. (Citation2006). The work by Cairns et al. agrees additionally with the observation of increased peak and residual bond strengths owing to the presence of a stirrup.
The discrepancies in the peak bond values are, however, substantial between the presented work and previous works using artificially corroded specimens. One of the causes of such differences could be found in the use of different corrosion methods. The data presented in this paper are the result of natural corrosion over a period of over 80 years in an environment that included freezing and thawing cycles. Cairns et al. (Citation2006) used a combination of impressed currents and wet/drying cycles over a period of 1 to 3 months, while Fang et al. (Citation2004) opted for impressed currents over a much shorter period. Different current densities could influence the bond strength (Saifullah & Clark, Citation1994).
The difference in casting techniques (concrete in 1930s was usually tamped instead of being vibrated) and in surface roughness could also be influencing factors. The difference in surface roughness could also explain discrepancies in tests of uncorroded plain bars. Feldman and Bartlett (Citation2005) observed a relationship between bond capacity and surface roughness for plain reinforcing bars. In a study from 2005, they opted to sandblast new bars prior to lab testing, claiming that bars used in the past had rougher surfaces than those produced today. Additionally, Gustavson (Citation2004) studied the influence of concrete density and surface roughness on the bond behaviour of three-wire strands and found that an increase in the microroughness of the strand surface strongly increased adhesion in the initial bond response. The study on three-wire stands also determined a relationship between the bond strength of uncorroded bars with an increase in the concrete density.
5. Conclusions
The aim of this work was to investigate the bond between naturally corroded, plain reinforcing bars and concrete. Consequently, 156 pullout tests were conducted on specimens taken from a decommissioned 81-year old bridge in Gullspång, Sweden. The major outcomes of this investigation are as follows:
The casting position and, consequently, the concrete density around the bar were recognised to be relevant parameters which significantly influence both the bond strength and the damage linked to the presence of corrosion products.
Both bottom-cast and top-cast bars presented a reduction in the peak bond with the corrosion level. However, top-cast bars were initially positively affected by the presence of corrosion, yielding to higher bond peaks than bottom-cast bars.
The corrosion level necessary to yield damage to the surrounding concrete was observed to be smaller for bottom-cast bars than for top-cast bars as a consequence of the concrete density variation.
A relationship between the residual bond stress, in this work defined as the bond stress at 4.5 mm of passive slip, and the peak bond stress was observed. The highest peak bond stress corresponded to the highest residual capacity, and vice versa.
The presence of a stirrup positively impacted the residual bond stress capacity regardless of the damage level of the specimen. The stirrup also contributed to maintaining the bond strength in specimens presenting several cracks, spalling, or large crack openings.
A clear connection between the number of cracks, crack width, and corrosion level was observed, where higher corrosion levels corresponded to more numerous and wider cracks.
Current code provisions give conservative values for the peak bond strength with respect to the results obtained in this work.
The passive slip at the peak bond stress was estimated at around 0.06-0.07mm, and no influence of the casting position was observed. This value is slightly lower than the slip defined in current bond provisions (0.1mm) and significantly lower than the values suggested in analytical models currently available in the literature.
The passive slip at the peak bond stress was observed to significantly increase with the presence of stirrups.
To conclude, this work investigated the effect of corrosion damage on the bond of plain reinforcing bars. This topic is difficult to find in the literature. Nevertheless, structures with plain bars are still standing, and acquiring more knowledge on their aging process is the only way we can properly assess them. Some of the findings in this paper support previous researchers’ work. Others, such as the bond strength values, should not be generalised since they are linked to the particular characteristics of the materials involved and to the specific corrosion process. Nevertheless, it is the authors’ opinion that the results highlight the importance of detailed investigation into the materials and techniques of the time of construction when assessing heritage structures.
Data repository
All data collected and processed in this experimental study has been compiled and uploaded to https://zenodo.org/, an open-source data repository, DOI: 10.5281/zenodo.3675267. is a direct link to the data location. Separate folders contain photos, measurements, test results, and processed data.
Acknowledgements
The authors would like to thank Laboratory Engineer Sebastian Almfeldt for the development of the pullout rig, and for his assistance through the entire testing procedure. His help and guidance made this project possible. Additional thanks are given to Ph.D. candidate Yu Xiaotong (Hohai University), who provided insight and suggestions throughout the project implementation during her overlapping research period at Chalmers University of Technology.
Disclosure statement
No potential conflict of interest was reported by the author(s).
Additional information
Funding
References
- Abrams, D. (1913). Test of Bond Between Concrete and Steel. University of Illinois at Urbana-Champaign: Bulletin No. 71, Engineering Experiment Station, University of Illinois, Urbana.
- ACI Committee 408. (2003). ACI 408R-03 Bond and Development of Straight Reinforcing Bars in Tension. American Concrete Institute, 1–49.
- Austin, S., Lyons, R., & Ing, M. (2004). Electrochemical behavior of steel-reinforced concrete during accelerated corrosion testing. CORROSION, 60(2), 203–212. doi:10.5006/1.3287722
- Baldwin, M. I., & Clark, L. A. (1995). The assessment of reinforcing bars with inadequate anchorage. Magazine of Concrete Research, 47(171), 95–102. doi:10.1680/macr.1995.47.171.95
- Bell, B. (2004). European Railway Bridge Demography - Deliverable D 1.2 (Tech. Rep.).
- Bertolini, L., Elsener, B., Pedeferri, P., & Polder, R. (2004). Corrosion of steel in concrete. prevention, diagnosis, repair. Weinheiim, Germany: John Wiley & Sons.
- Blomfors, M., Zandi, K., Lundgren, K., & Coronelli, D. (2018). Engineering bond model for corroded reinforcement. Engineering Structures, 156, 394–410. doi:10.1016/j.engstruct.2017.11.030
- Cairns, J., Du, Y., & Law, D. (2006). Residual bond strength of corroded plain round bars. Magazine of Concrete Research, 58(4), 221–231. doi:10.1680/macr.2006.58.4.221
- Cairns, J., Du, Y., & Law, D. (2008). Structural performance of corrosion-damaged concrete beams. Magazine of Concrete Research, 60(5), 359–370. doi:10.1680/macr.2007.00102
- Cairns, J., & Feldman, L. (2018). Strength of laps and anchorages of plain surface bars. Structural Concrete, 19(6), 1782–1791. ), doi:10.1002/suco.201700242
- Cairns, J., Plizzari, G. A., Du, Y., Law, D. W., & Franzoni, C. (2005). Mechanical Properties of Corrosion-Damaged Reinforcement. ACI Materials Journal, 102-M29(102), 256–264.
- CEB-FIP (2013). fib Model Code for Concrete Structures 2010. Lausanne: International Federation for Structural Concrete.
- CEB-FIP Bulletin n.10. (2000). Bond of reinforcement in concrete: State of the art. FIB Bulletin, 10(December), 434.
- Coronelli, D., François, R., Dang, H., & Zhu, W. (2019). Strength of corroded RC beams with Bond deterioration. Journal of Structural Engineering, 145(10), 04019097–04019018. doi:10.1061/(ASCE)ST.1943-541X.0002358
- Creaform. (n.d.). Retrieved from https://www.creaform3d.com.
- Dai, L., Bian, H., Wang, L., Potier-Ferry, M., & Zhang, J. (2020). Prestress Loss diagnostics in pretensioned concrete structures with corrosive cracking. Journal of Structural Engineering, 146(3), 04020013. doi:10.1061/(ASCE)ST.1943-541X.0002554
- Dang, V. H., & François, R. (2013). Influence of long-term corrosion in chloride environment on mechanical behaviour of RC beam. Engineering Structures, 48, 558–568. doi:10.1016/j.engstruct.2012.09.021
- Fang, C., Lundgren, K., Chen, L., & Zhu, C. (2004). Corrosion influence on bond in reinforced concrete. Cement and Concrete Research, 34(11), 2159–2167. doi:10.1016/j.cemconres.2004.04.006
- Feldman, L. R., & Bartlett, F. M. (2005). Bond strength variability in pullout specimens with plain reinforcement. ACI Structural Journal, 102(6), 860–867.
- Fernandez, I., & Berrocal, C. (2019). Mechanical properties of 30 year-old naturally corroded steel reinforcing bars. International Journal of Concrete Structures and Materials, 13(1), 9. doi:10.1186/s40069-018-0308-x
- Fernandez, I., Herrador, M. F., Marí, A. R., & Bairán, J. M. (2016). Structural effects of steel reinforcement corrosion on statically indeterminate reinforced concrete members. Materials and Structures, 49(12), 4959–4973. doi:10.1617/s11527-016-0836-2
- Fernandez, I., Herrador, M. F., Marí, A. R., & Bairán, J. M. (2018). Ultimate capacity of corroded statically indeterminate reinforced concrete members. International Journal of Concrete Structures and Materials, 12(1), 75. doi:10.1186/s40069-018-0297-9
- Fernandez, I., Lundgren, K., & Zandi, K. (2018). Evaluation of corrosion level of naturally corroded bars using different cleaning methods, computed tomography, and 3D optical scanning. Materials and Structures, 51(3), 1–13. doi:10.1617/s11527-018-1206-z
- François, R., Khan, I., & Dang, V. H. (2013). Impact of corrosion on mechanical properties of steel embedded in 27-year-old corroded reinforced concrete beams. Materials and Structures, 46(6), 899–910. doi:10.1617/s11527-012-9941-z
- Gustavson, R. (2004). Experimental studies of the bond response of three-wire strands and some influencing parameters. Materials and Structures, 37(266), 96–106. doi:10.1617/13909
- Hobbs, D. (2001). Concrete deterioration: causes, diagnosis, and minimising risk. International Materials Reviews, 46(3), 117–144. doi:10.1179/095066001101528420
- Khan, I., François, R., & Castel, A. (2014). Prediction of reinforcement corrosion using corrosion induced cracks width in corroded reinforced concrete beams. Cement and Concrete Research, 56, 84–96. doi:10.1016/j.cemconres.2013.11.006
- Kioumarsi, M., Hendriks, M., Kohler, J., & Geiker, M. (2016). The effect of interference of corrosion pits on the failure probability of a reinforced concrete beam. Engineering Structures, 114, 113–121. doi:10.1016/j.engstruct.2016.01.058
- Kioumarsi, M., Markeset, G., & Hooshmandi, S. (2017). Effect of pit distance on failure probability of a corroded RC beam. Procedia Engineering, 171, 526–533. doi:10.1016/j.proeng.2017.01.365
- Lundgren, K. (2007). Effect of corrosion on the bond between steel and concrete: an overview. Magazine of Concrete Research, 59(6), 447–461. doi:10.1680/macr.2007.59.6.447
- Lundgren, K., Robuschi, S., & Zandi, K. (2019). Methodology for testing rebar – concrete bond in specimens from decommissioned structures. International Journal of Concrete Structures and Materials, 13(1), 38. doi:10.1186/s40069-019-0350-3
- Malumbela, G., Alexander, M., & Moyo, P. (2009). Steel corrosion on RC structures under sustained service loads - A critical review. Engineering Structures, 31(11), 2518–2525. nov). doi:10.1016/j.engstruct.2009.07.016
- Melo, J., Rossetto, T., & Varum, H. (2015). Experimental study of bond–slip in RC structural elements with plain bars. Materials and Structures, 48(8), 2367–2381. doi:10.1617/s11527-014-0320-9
- Papakonstantinou, K. G., & Shinozuka, M. (2013). Probabilistic model for steel corrosion in reinforced concrete structures of large dimensions considering crack effects. Engineering Structures, 57, 306–326. doi:10.1016/j.engstruct.2013.06.038
- Robuschi, S., Lundgren, K., Fernandez, I., & Flansbjer, M. (2020). Anchorage of naturally corroded plain reinforcement bars in flexural members. Materials and Structures, 53(2), 38. doi:10.1617/s11527-020-01471-2
- Saifullah, M., & Clark, L. (1994). Effect of corrosion rate on the bond strength of corroded reinforcement. Proceedings of International Conference: Corrosion and Corrosion Protection of Steel in Concrete, I, 591–600.
- Tahershamsi, M., Fernandez, I., Lundgren, K., & Zandi, K. (2017). Investigating correlations between crack width, corrosion level and anchorage capacity. Structure and Infrastructure Engineering, 13(10), 1294–1307. doi:10.1080/15732479.2016.1263673
- Tahershamsi, M., Zandi, K., Lundgren, K., & Plos, M. (2014). Anchorage of naturally corroded bars in reinforced concrete structures. Magazine of Concrete Research, 66(14), 729–744. doi:10.1680/macr.13.00276
- Verderame, G. M., De Carlo, G., Ricci, P., & Fabbrocino, G. (2009). Cyclic bond behaviour of plain bars. Part II: Analytical investigation. Construction and Building Materials, 23(12), 3512–3522. doi:10.1016/j.conbuildmat.2009.07.001
- Verderame, G. M., Ricci, P., De Carlo, G., & Manfredi, G. (2009). Cyclic bond behaviour of plain bars. Part I: Experimental investigation. Construction and Building Materials, 23(12), 3499–3511. doi:10.1016/j.conbuildmat.2009.07.002
- Verderame, R., Ricci P., Esposito, S., & Sansiviero F. C. (2011). Le Caratteristiche Meccaniche degli Acciai Impiegati nelle Strutture in c.a. realizzate dal 1950 al 1980. XXVI Convegno Nazionale AICAP.
- Virmani, Y. P. (2002). Corrosion Costs and Preventive Strategies in the United States (Tech. Rep.). U.S. Department of transportation, Federal Highway Administration (FHWA).
- Wang, L., Dai, L., Bian, H., Ma, Y., & Zhang, J. (2019). Concrete cracking prediction under combined prestress and strand corrosion. Structure and Infrastructure Engineering, 15(3), 285–295. doi:10.1080/15732479.2018.1550519
- Wang, X., Stewart, M. G., & Nguyen, M. (2012). Impact of climate change on corrosion and damage to concrete infrastructure in Australia. Climatic Change, 110(3-4), 941–957. doi:10.1007/s10584-011-0124-7
- Williamson, S., & Clark, L. (2002). Effect of corrosion and Load on Reinforcement Bond Strength. Structural Engineering International, 12(2), 117–119. doi:10.2749/101686602777965559
- Yingshu, Y., Yongsheng, J., & Surendra, P. (2007). Comparison of two accelerated corrosion techniques for concrete structures. ACI Structural Journal, 104(3), 344–347.
- Zhu, W., François, R., Cleland, D., & Coronelli, D. (2015). Failure mode transitions of corroded deep beams exposed to marine environment for long period. Engineering Structures, 96, 66–77. doi:10.1016/j.engstruct.2015.04.004