
Abstract
Nowadays, with the aging of the bridges and the advancements in technology, load testing has emerged as an effective method to assess existing concrete bridges with missing information, or where analytical methods do not provide an accurate assessment. Two types of load tests are identified: diagnostic load tests and proof load tests. Both rely on field measurements of parameters or structural responses of the bridge during the test. A diagnostic load test measures the response of the bridge so that analytical models can be calibrated and evaluated. In a proof load test, the bridge directly demonstrates that it can carry a certain load. Since large loads are applied, the bridge needs to be carefully monitored. In this case, monitoring the measurements provide a warning to avoid damage. This paper reviews the literature on reported load tests and the measurement techniques used during these tests. It also includes a review of traditional and recently developed sensing technologies. Finally, the measurement requirements for diagnostic and proof load tests are given as well as a flow chart to guide engineers in the selection process of appropriate monitoring and measurement techniques during load tests. This paper can serve engineers during the preparation of a load test.
1. Introduction
Load testing has been used throughout history to assess and evaluate the condition and lower bound capacity of bridges. Load tests were carried out before the opening of a bridge to demonstrate to the public that the bridge was safe. In the early 1900s, the bridges were load tested with heavy masses and trucks. Back then, the most accessible structural response was the deflection (Lantsoght, Van Der Veen, De Boer, & Hordijk, Citation2017b) and it was used as proof of the capacity of the bridge to carry live loads and show adequate performance. Currently, load testing can be applied to both existing and new bridges. Load testing is a suitable assessment method for bridges which are lacking information such as structural plans, present degradation of the material (e.g. corrosion or alkali-silica reaction), or when an initial assessment shows insufficient capacity but additional capacity is expected as a result of the activation of additional load-carrying mechanism (Lantsoght et al., Citation2017b).
There are two types of load tests: diagnostic tests and proof load tests. The goal of a diagnostic load test is to validate or update analytical models using the measurements obtained during the field test. The sensors installed aim to capture the actual behaviour of the bridge through the field measurements of strains, deflections, and rotations. In a proof load test, the goal is to directly evaluate the structural safety of existing bridges. This type of test involves heavy loads. Therefore, monitoring provides a warning to avoid irreversible damage or the collapse of the structure. The installation of the sensors must capture the structural response of the bridge at critical locations in terms of parameters such as strains, deflection, crack widths and crack development. The aim is to check the field measurements in real-time during the test to stop the loading.
Nowadays, instrumenting a bridge that is load tested can be time-consuming (Lantsoght, Citation2019) because most of the measurement techniques are based on contact sensors, which need to be calibrated, installed, and wired individually. In order to prepare a load test faster and improve the efficiency of the measurements, recently developed techniques can be incorporated into the sensor plan. Currently, no guideline includes up-to-date recommendations on the selection and the implementation of the sensors to measure the structural response of a concrete bridge during a load test. This paper provides a review of the literature on reported load tests on reinforced concrete bridges and the measurement techniques used during the tests. The paper also includes the working principles, advantages, and disadvantages of several measuring techniques including the recent techniques. Finally, recommendations for the development of a sensor plan for load tests are given. The novelty of this paper lies in the development of a flowchart for the selection of sensors or measuring techniques for load testing. The goal is to guide engineers in the selection of the appropriate measuring technique which can help to save time during the preparation, execution, and analysis of a load test.
2. Literature review of load testing
Successful load tests on concrete bridges have been widely reported in the literature during the last decades. The next sections compile information from load tests on concrete bridges reported in the literature, and the measuring techniques or sensors used during these tests.
2.1. Diagnostic load tests
The most common type of load test is the diagnostic load test. As the name suggests, the goal is to diagnose the performance of a bridge through the application of a load at a level similar to the service conditions. This type of test can be classified according to variation in time/position of the load as, static (the load, vehicle, or weight is applied in a fixed position), pseudo-static (a vehicle moves across the bridge at a crawl speed), and dynamic (the vehicle moves at full speed) (Olaszek, Chen, Frangopol, & Ruan, Citation2014). A flow chart outlining the diagnostic load tests objectives and the process can be found in Alampalli et al. (Citation2019).
For existing bridges, diagnostic tests are used to update analytical models and get a better understanding of the bridge behaviour. These tests can determine specific elements of bridge behaviour, such as the transverse load distribution, support rotations, and stiffness, or can be used to develop a field-verified model for load rating purposes. For new bridges, diagnostic tests help to confirm design assumptions by comparing the field measurements to the analytical calculations. This is useful to verify new design methods or materials as well as to quantify load-bearing mechanisms not typically accounted for (Lantsoght et al., Citation2017b). Diagnostic tests can also verify the performance of a bridge after rehabilitation measures. The following sections present examples of diagnostic load tests and the application of the measurements taken during the tests.
The transverse distribution of a bridge is quantified with strains measurements taken over the width of the bridge. A guideline can be found in ACI 342 R-16 (ACI Committee 342, 2016). Examples have been reported in the USA (Saraf, Citation1998, Al-Mahaidi, Taplin, & Giufre, Citation2000, Catbas, Ciloglu, & Aktan, Citation2005, Jones, Citation2011, Sanayei, Reiff, Brenner, & Imbaro, Citation2016). The strain measurements were obtained using strain gauges, clip gauges, wire vibrating strain gauges, and LVDTs. The sensors were typically mounted to the underside of the concrete bridge using frames or scaffolding. In Wang, Taylor, Hosteng, and Phares (Citation2016), the strain measurements helped to assess the transverse load distribution of a lightweight concrete bridge. The instrumentation was based on strain transducers installed on the underside of the bridge deck and the top and bottom flange of the girders. In addition, strain measurements over the height of the girders in reinforced concrete bridges can help to determine if the element is cracked or uncracked by finding the position of the neutral axis. This information can be determined by adhesively bonding strain gauges or by attaching strain transducers over the height of girders (Jáuregui, White, Woodward, & Leitch, Citation2003, Hag-Elsafi & Kunnin, Citation2006, Jeffrey, Breña, & Civjan, Citation2009).
Deflection measurements taken during load tests are used to compare the analytical stiffness to the actual stiffness of the bridge. The deflections are usually recorded with LVDTs (Aktan, Zwick, Miller, & Shahrooz, Citation1992). In Ireland, a diagnostic load test and laboratory tests were used to quantify the amount of arching action in a bridge deck slab (Taylor, Barry, Cleland, & Kirkpatrick, Citation2007). The instrumentation consisted of displacement transducers to provide the deflected shape for comparison and vibrating wire strain gauges for the measurement of crack widths. For the identification of the cracks, a first load level was applied to initiate the cracking and to position the strain gauges over the cracks. The crack widths were compared to the UK SLS allowable limits. In Merkle and Myers (Citation2004), the deflection measurements helped to verify a fiber-reinforced polymer (FRP) strengthening system. The deflections were recorded with a total station and LVDTs installed in a frame. Similarly, in Hernandez and Myers (Citation2015), the deflections measurements helped to assess the performance of a self-consolidating bridge. In this case, the deflections were measured with an automated total station.
In Colombani and Andrawes (Citation2022), a 96-year old skewed RC bridge was load tested for load rating. Strain measurements were recorded with strain transducers mounted in the concrete slab to capture the load distribution of the bridge. A 50-year old precast concrete bridge was load tested in Abedin, De Caso Y Basalo, Kiani, Mehrabi, and Nanni (Citation2022). The objective of the test was to develop a detailed finite element (FE) model. With the FE model and the load test results, the authors developed a damage detection method for deck joints. The instrumentation of the bridge consisted of dial gauges, LVDTs, and a total station to measure vertical deflections. presents a summary of the diagnostic load tests that are reviewed in this paper. The table includes the goal of the test, the loading system, and the instrumentation.
Table 1. Overview of diagnostic load tests reviewed in this study.
2.2. Proof load tests
The goal of a proof load test is to directly prove the ability of an existing bridge to carry the corresponding prescribed factored live load without signs of distress or non-linear behaviour (Lantsoght et al., Citation2017b). Loads in a proof load test are considerably higher than in a diagnostic load test and applied such that the response of the bridge can be followed and checked during the test. This test can be considered a static load test since the load is applied in a fixed position. A flow chart summarizing the proof load test objectives and the process can be found in Alampalli et al. (Citation2019). The type of sensors is similar to those in a diagnostic load test, however, the instrumentation in a proof load test requires redundancy to improve the reliability of the monitoring system and real-time measurements to allow on-site judgement to stop the loading. The following sections present examples of proof load tests and the application of sensors for monitoring structural parameters.
Proof load testing is used when the uncertainties on the bridge are large. For example, Shahawy (Citation1995) used proof load testing to evaluate two existing prestressed concrete bridges. Static and dynamic load tests were carried out. The static load test was performed with trucks that were incrementally loaded with concrete blocks. The dynamic load test was a supplementary test to the static load test and it consisted of driving loaded trucks over the bridge at different constant speeds. LVDTs were used to obtain strain readings and displacements, and the acceleration response was measured with accelerometers mounted at the bottom flange of the girders. The measurements of acceleration, deflection, and strain were monitored in real-time during the tests. Regarding the static load test, the measured data of deflections and strains was immediately compared to the theoretical predictions. The results of the proof load tests were that the bridges had greater residual strength.
Another example was the 68-year-old reinforced concrete T-beam bridge (Juntunen & Isola, Citation1995) that was load tested in the USA to estimate the amount of degradation. For this load test, a two-unit vehicle was used for the load application. The deflection measurements were recorded using LVDTs and monitored in real-time during the experiment. A spotting scope was used to observe the fascia beams to monitor the development of cracks. Deflection measurements were also taken with an electronic level however the accuracy was not adequate and the results were not interpreted. During the test, the load versus deflection diagrams were monitored for non-linear behaviour and compared to the theoretical response. The result was that the bridge had a greater load-bearing capacity than predicted.
Another application of proof load tests is to evaluate bridges without structural plans. For example, Aguilar, Jáuregui, Newtson, Weldon, and Cortez (Citation2015) developed a load rating procedure to rate prestressed concrete T-beam bridges without plans and to evaluate their performance at the serviceability limit state. The load was applied through dump trucks and the strains measurements served to control the test. Four reinforced concrete slab bridges were proof loaded with a system of hydraulic jacks and one bridge was tested to collapse in the Netherlands (Lantsoght, Van Der Veen, De Boer, & Hordijk, Citation2017a). The objectives of the tests were to evaluate the bridges and provide recommendations for the preparation, execution, and analysis of proof loading. These bridges were instrumented with LVDTs to measure the support deflections, crack widths, and strains on the bottom of the slab. Laser distance sensors recorded deflections at different locations along the span. Acoustic emission sensors tracked the cracking active areas and load cells measured the applied load. All the measurements provided real-time read.
Four prestressed overturned T-beam concrete bridges were proof-loaded in Denmark (Schmidt, Halding, Jensenm, & Engelund, Citation2018). The bridges were loaded using a test rig that consists of weights and hydraulic jacks. The initial goal was to develop a fast testing method that involved advanced monitoring systems. LVDTs, a total station, and laser distance sensors recorded the deflections to evaluate the load distribution and degree of fixation at the supports. The deflection measurements from the three methods had comparable results. The total station provided reliable measurements with a precision of 0.1 mm from a distance of approximately 5 m. Load cells measured the applied loads. In addition, digital image correlation technique was applied using a wide-angle lens camera. Photographs were taken of the bottom of the deck without applying an artificial pattern which allowed to register the crack initiation, and deformations and strains of the surface. However, the distortion of the camera lens and the out-of-plane deflection of the monitored surface caused deviations in the deformation results. Finally, a 3 D laser scanner was used to reproduce the test environment in virtual reality, which enables the measurement of distances after the test.
A 96-year old skewed RC bridge was proof loaded in Colombani and Andrawes (Citation2022). for load rating. The objective of the test was to update the load rating. The instrumentation consisted of strain transduces for the load distribution, LVDTs for displacement profiles, and computer vision method for displacement measurements. presents a summary of the reviewed proof load tests that includes the instrumentation, the loading system, and the measurements taken during the tests.
Table 2. Overview of proof load tests reviewed for this study.
2.3. Current challenge
The literature study in Sections 2.1 and 2.2 shows that the most common demands for load tests in terms of structural parameters are strains, deflections, load, acceleration, and rotations. These parameters are typically measured with strain gauges, strain transducers, linear displacements sensors, accelerometers, and inclinometers. These measuring techniques are contact sensors, that need to be physically attached to the structure or mounted with frames. Overall, these sensors require electrical wiring and a data acquisition system. Additionally, they must be calibrated before their initial use to ensure reliable measurements and can only monitor a single location.
The literature also shows that sensors such as acoustic emission sensors or non-contact techniques are not widely implemented. The most common remote sensing equipment used during load tests is the total station (Jáuregui et al., Citation2003, Merkle & Myers, Citation2004, Diaz Arancibia & Okumus, Citation2018, Hernandez & Myers, Citation2018). This could be attributed to the lack of understanding and knowledge of these new technologies which is necessary to develop a sensor plan. The following sections focus on providing an overview of the measuring techniques currently available.
3. Review of measuring techniques
In the literature, sensors are usually classified based on the behaviour or the mechanisms and the measurement. However, in this paper, the measuring techniques are divided into three categories: traditional techniques, recent developments, and emerging technology. This section also includes sensors used to measure environmental conditions such as temperature and humidity, since the structural response of a structure and the sensor output can be affected by environmental effects.
3.1. Traditional measuring techniques
3.1.1. Linear variable differential transformers
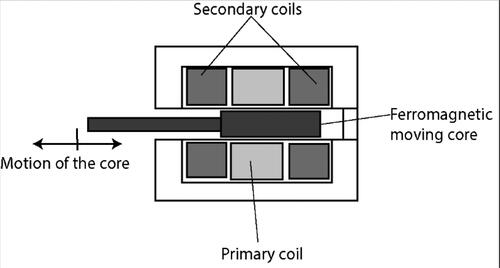
Linear variable differential transformers (LVDTs) are a type of electromechanical transducers used to measure linear displacements. The transducer detects the displacement between the central core and the electrical coils, usually referred to as the primary and secondary coils. The core movement causes the mutual inductance between the primary and the secondary coils to vary (Ettouney & Alampalli, Citation2012). The movement varies the output voltage proportional to the position. The principle is illustrated in .
Figure 1. The basic principle of LVDT transducer.
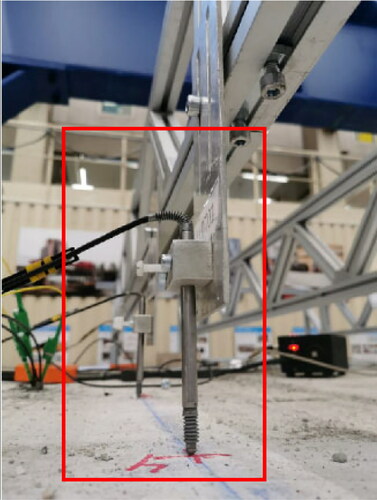
The calibration is usually performed with a precision instrument such as a micrometer. Since LVDTs are contact sensors, the installation requires mounting blocks that need to be attached or glued to the structure. LVDTs can also be attached to a bar placed underneath the bridge as in Halding, Schmidt, Jensen, & Henriksen, Citation2017. shows a typical LVDT sensor installed to measure deflections. A wide variety of measurement ranges are available for LVDTs, typically from µm to cm. The accuracy of the LVDTs is usually expressed as a percentage of the sensor’s full measurement range, which can be 0.5% or less (Wilson, Citation2004).
Figure 2. Typical LVDT sensor installed for measuring displacements.
The advantages of LVDTs are that they are reliable, measure small displacements (microns), rugged, easy to maintain, and light. Some disadvantages are that they are sensitive to temperature variations, setup can be difficult on-site and the operating range can be limited. A similar approach is to measure linear displacements using cable extension transducers (potentiometers). In this case, the transducer is mounted in a fixed position and a thin cable is attached to the specimen. A constant torque spring keeps the cable in tension, when the specimen moves relative to the fixed position, the cable rotates the potentiometer producing a proportional linear voltage output (Aktan, Catbas, Grimmelsman, & Pervizpour, Citation2003).
3.1.2. Laser distance sensors
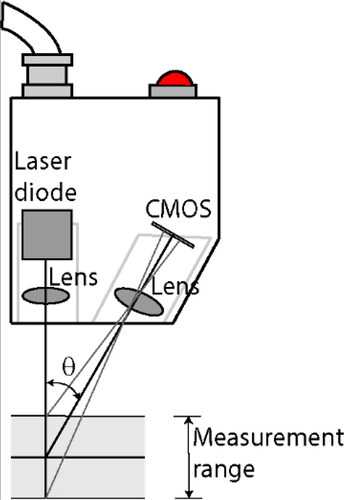
The laser triangulation sensors, or laser distance sensors, determine the position of a target by measuring the reflected light from the surface (MTI Instruments Inc,. Citation2014). This sensor consists of a complementary metal-oxide-semiconductor (CMOS), a charged coupled device (CCD) or a position-sensitive detector (PSD), and a laser light source. The operating principle consists of projecting a laser beam on a measuring target. Then, a part of the beam is reflected via focusing optics onto a detector. When the target moves, the laser beam is reflected onto the detector (MTI Instruments Inc,. Citation2014). The principle is illustrated in .
Figure 3. Laser triangulation principle.
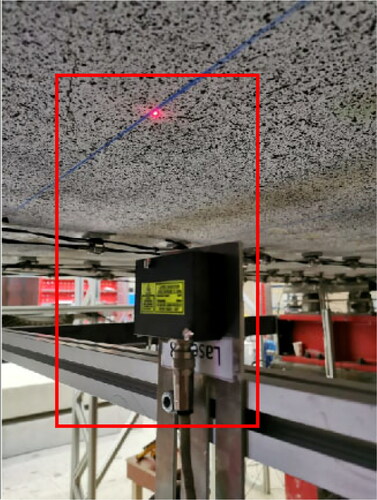
The basic calibration setup of a laser consists of a mounting platform, a displacement mechanism, and a reference sensor (Haitjema, Citation2020). Laser distance sensors are non-contact sensors which means they can measure displacement or position without touching the object. However, the installation of the lasers usually requires mounting brackets to position the laser at an operating distance far away from the object. depicts the application of a laser distance sensor to measure deflection.
Figure 4. Application of laser distance sensor to measure the deflection.
Laser distance sensors can be found on a wide variety of measurement ranges from µm to m. The accuracy can be on the scale of µm. The main advantages are that lasers are non-contact, accurate, light, and easy to maintain. However, they are highly sensitive, need to be clean from dirt, foreign materials, raindrops, and dust.
3.1.3. Electrical resistance strain gauge
Bonded electrical resistance strain gauges are the most used type of sensor for bridge load tests. An electrical resistance strain gauge consists of a thin metallic film deposited on a non-conducting plastic film (Aktan et al., Citation2003). The operating principle relies on the relationship that the resistance of a conductor will change directly proportional to a change in its length, and this change in electrical resistance is related to strain. Electrical strain gauges are available with nominal resistance values from 30 to 3000 Ohm (National Instruments, Citation1998). A Wheatstone bridge circuit converts the change in resistance to voltage. shows the scheme of a strain gauge.
Figure 5. Electrical resistance strain gauge.
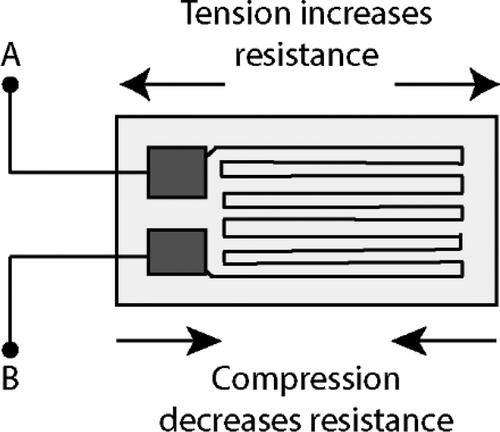
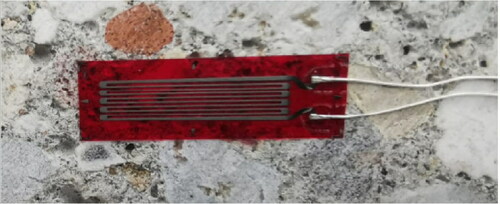
This type of sensor is usually welded or bonded to the structure. They are available in different gauge lengths in the order of mm, can measure strains within 1 microstrain (Brooks, Citation2014), and are not expensive. These sensors are ideal to measure stress concentrations, average strain values, and can also be grouped to get tri-axial strains (Ettouney & Alampalli, Citation2012). However, they are not reusable and are affected by environmental conditions. shows a typical strain gauge applied to a concrete surface.
Figure 6. Typical strain gauge.
3.1.4. Vibrating wire strain gauge
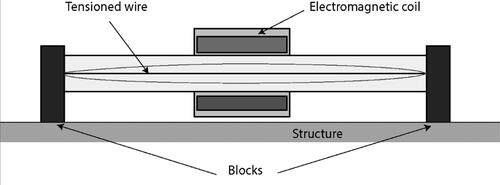
Vibrating wire strain gauges (VWSG) use the principle that a wire vibrates when held in tension and a force is applied (Ettouney & Alampalli, Citation2012). These sensors consist of two end blocks and a tensioned steel wire coupled with an electromagnetic coil fixed in between (see ). The blocks are fixed to the surface and the variation of the distance between them alters the natural frequency of variation of the wire. This change in the frequency is correlated with the change of length or strain causing it.
Figure 7. Vibrating wire strain gauge.
The sensors can be glued, welded, or embedded in the structures to measure strains and are available in different gauge lengths. They can measure approximately ±3000 microstrains with an accuracy of approximately 1% of the sensor’s full scale (FS) (Geokon Inc, Citation2014). The advantages are that they are immune to electrical noise, able to tolerate wet environments, transmit data to long distances, and are rugged and durable. Traditionally, they are not suitable for dynamic measurements. However, an 8-Channel Dynamic Vibrating- Wire analyser (Campbell Scientific Inc,. Citation2020) was developed to enable the operation of VWSG at dynamic rates. In Yarnold, Golecki, and Weidner (Citation2018), VWSG and the analyser were utilized to obtain longitudinal strain measurements at a sampling rate of 50 Hz during a dynamic load test.
3.1.5. Strain transducers
Demountable strain gauges or strain transducers consist of a full Wheatstone bridge foil strain gauge mounted inside a flexible proving ring (Ettouney & Alampalli, Citation2012). The strain transducer is attached to the structure in two ends with a known distance between them. The change in the length gauge is related to the strain. Some of the advantages are that they are reusable, waterproof, and easy to attach through anchors or adhesive. These advantages make this sensor very common in the USA. However they need maintenance to keep them operational (Bridge Diagnostics, Citation2018), require additional accessories to increase the gauge length which complicates the installation, and are limited to short-duration tests. They have an accuracy of ± 2% FS and a strain range of approximately ±2000µε (Bridge Diagnostics, Citation2018). shows a typical strain transducer.
Figure 8. Typical strain transducer.

3.1.6. Load cells
Load cells measure the force acting on a structure. The most common types of load cells are the hydraulic, pneumatic, and strain gauge. Hydraulic and pneumatic load cells operate on the force-balance principle using a pressurized fluid (see ) or gas. Strain gauge load cells consist of an assembly of strain gauges in a Wheatstone bridge configuration positioned inside the load cell to convert the acting force into an electrical signal.
Figure 9. Hydraulic load cell.
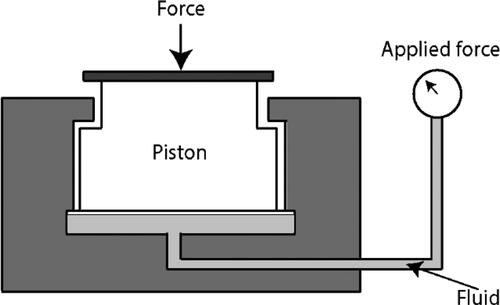
Load cells must be applied directly to the structure and they can only measure a single force component. The application highly affects the reliability of the measurements (Modares & Waksmanski, Citation2013). The accuracy of the measurements is between 0.03 to 1% FS (Omega Engineering Inc,. Citation2020). The advantages are that load cells can measure tension and compression, good long-term stability, and low thermal effects.
3.1.7. Inclinometer
Inclinometers measure the inclination of a structural element. They can be used to evaluate the degree of fixity of the supports and the displacement. The latter can be computed by integrating the slopes along the span of a bridge if numerous inclinometers are installed as in Caglayan, Ozakgul, and Tezer (Citation2012) and Olaszek, Chen, et al. (Citation2014). There are several types of inclinometers: capacitive, electrical, hydrostatically-based, fiber optic tiltmeter, vibrating wire-based, and the pendulum.
The most common type is the capacitive inclinometer. shows the working principle of an inclinometer with a capacitive pendulum. This type of inclinometer measures the inclination with respect to gravity. When the inclinometer is tilted, the gravity produces a component on the pendulum changing the corresponding capacitance The inclination angle is obtained by amplifying, filtering, and converting the capacitance (Rion, Citation2014).
Figure 10. Capacitive pendulum inclinometer working principle.
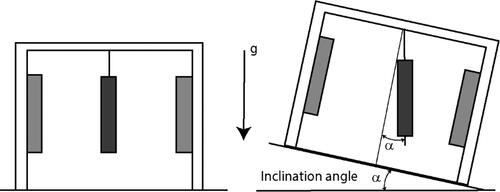
The advantage of inclinometers is that they provide an absolute slope without the need for interpolation. However, the installation method can be complicated, since they need to be attached to the surface of the structure. Capacitive inclinometers can have an accuracy of ±0.5 FS and a measuring range of up to 0.5° (Modares & Waksmanski, Citation2013).
3.1.8. Accelerometer
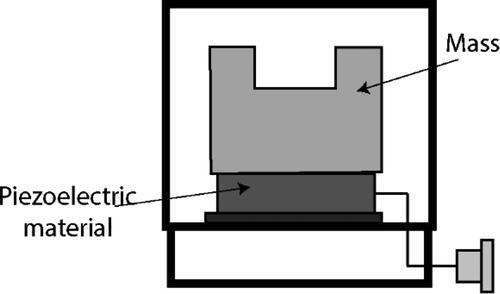
Accelerometers are sensors that measure the acceleration of a structure on one, two, or three axes. There are different types: force-balance, capacitive, piezoresistive, and piezoelectric inclinometers. The piezoelectric accelerometers are the most common type. They are designed to produce an electrical signal proportional to the forces induced by the vibration of the structure (Ettouney & Alampalli, Citation2012). Quartz and lead zirconate titanate (PZT) are common materials used to output the electrical charge when they are placed under acceleration. A scheme of this type of sensor is shown in . The resolution of the measurements can be up to 0.0001 g (PCB, Citation2011). The advantages of piezoelectric accelerometers are that they are widely commercialized, low cost, and easy to install. However, the interpretation of the measurements for the analysis of structural dynamic can be complex.
Figure 11. Piezoelectric accelerometer.
3.1.9. Total station
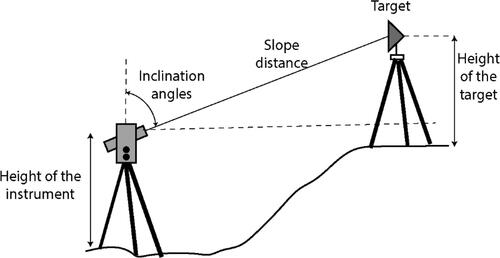
A total station is used to measure the positions or heights of points in a structure. The modern total station is equipment that combines the use of an electronic distance measuring device (EDM) with an electronic theodolite. The total station consists of two parts: the target or prism and the equipment mounted on the tripod provided with a lens to focus on the prism. The robotic total stations (RTS) have an automatic target recognition system, which makes targeting easier and faster (Zeiske, Citation2004).
The theodolite measures the vertical and horizontal angle, while the EDM uses electromagnetic waves to measure the slope distance to the target or prism (see ). The EDM sends a light signal which reflects from the prism. The time interval that the light takes to travel is measured and used to calculate the distance. A typical total station can measure distances up to 2000 m with an accuracy of about 2 mm (Lachat, Landes, & Grussenmeyer, Citation2017). The accuracy of total stations with regards to vertical displacements has been reported to be ±0.1 mm (Merkle & Myers, Citation2006, Halding et al., Citation2017). The main advantages of the total station are that they are rugged and widely commercialized. However, data gathering can be time-consuming and the equipment is sensitive to vibrations and environmental conditions.
Figure 12. Measurement of the distance and angles with the total station.
3.2. Recent developments
3.2.1. Digital Image correlation
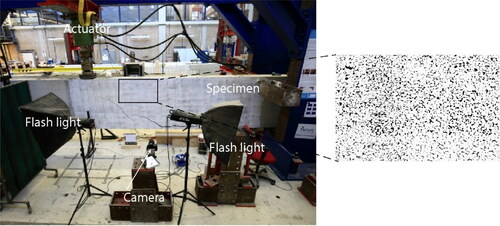
Digital Image Correlation (DIC) is a non-contact optical technique that provides 2 D or 3 D full-field displacement measurements of a surface by comparing digital images measured at different status of the target specimen. The surface strain field can be calculated from the displacement measurements. Two- dimensional DIC (2 D DIC) is implemented to capture the surface deformation of a specimen in two dimensions using a single camera. The surface is required to have a random speckle pattern. DIC uses random this pattern to track and match subsets between two digital images (Pan, Xie, Guo, & Hua, Citation2007). The evaluation of the images for DIC is performed through a cross-correlation algorithm that evaluates the degree of similarity between the subsets. The difference in the locations of the subsets results in in-plane displacements. A typical 2 D DIC setup is shown in .
Figure 13. 2 D DIC setup for a reinforced concrete beam showing the random pattern.
Three-dimensional DIC (3 D DIC) uses a two-camera stereo vision system to capture pair of images of the deforming object. The 3 D surface geometry is obtained using the camera intrinsic and extrinsic parameters, and geometric triangulation (Murienne & Nguyen, Citation2016). The 3 D deformation of the surface is obtained through the correlation of the image pairs and triangulation.
In general, the accuracy of the measurements is highly dependent on the quality of the pattern, the resolution of the camera, and the lens. Algorithms may be needed to correct the lens distortion, the amount of light, or the out-of-plane movements if 2 D DIC is implemented. The application of DIC in concrete structures has been continuously increasing due to the evolution of technology. Thus, DIC has been implemented in several research programs to investigate the shear-carrying mechanisms in concrete members without shear reinforcement in the laboratory (Campana, Fernández Ruiz, Anastasi, & Muttoni, Citation2013, Schacht, Bolle, & Marx, Citation2015, Huber, Huber, & Kollegger, Citation2016, Cavagnis, Fernández Ruiz, & Muttoni, Citation2018, Zhang, Zarate Garnica, Yang, Lantsoght, & Sliedrecht, Citation2020).
However, the application to full-scale concrete bridges is still rare. Examples of applications include the implementation of DIC to measure bridge deflections during field tests by mounting targets to the bottom of girders (Jáuregui et al., Citation2003, Yoneyama & Ueda, Citation2012, McCormick et al. Citation2014, Murray, Hoag, Hoult, & Take, Citation2015, Alipour, Washlesky, & Harris, Citation2019b). Recently, Tian, Zhao, Pan, and Wang (Citation2021) obtained full-field deflection measurements of a bridge using an off-axis DIC approach. In general, the deflection measurements were comparable to the readings obtained with traditional displacement measurements.
Cases, where DIC was used to monitor the cracks during field tests, have been reported in Küntz, Jolin, Bastien, Perez, and Hild (Citation2006), Sas, Blanksvärd, Enochsson, Täljsten, and Elfgren (Citation2012), Kundu et al. (Citation2013), Schmidt, Hansen, Barbosa, and Henriksen (Citation2014), Schacht et al. (Citation2015), and Christensen, Schmidt, Halding, Kapoor, and Goltermann (Citation2021). The challenges reported included the weather conditions, the distance between the cameras and the surface of interest, the geometry of the bridge, the availability of space, and the light conditions. In recent years, an image-based measurement method defined as feature-based image registration (FBIR) has been applied to bridge deformation monitoring (Feng, Fukuda, Feng, & Mizuta, Citation2015, Khuc & Catbas, Citation2017, Lydon et al., Citation2019). The method relies on an automated contactless feature identification and tracking algorithm used to measure changes of specific feature points on a target object.
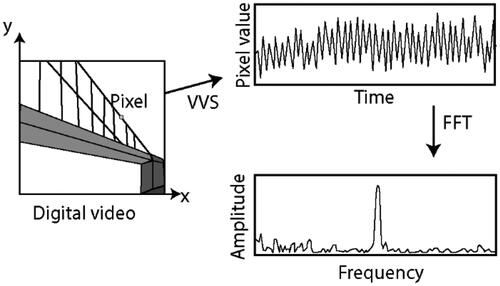
3.2.2. Virtual visual sensors
This technique proposes that every pixel in a digital video taken from a structure represents a candidate of a virtual visual sensor (VVS) (Song et al., Citation2014). The methodology uses an Eulerian specification where a pixel is selected and its intensity is monitored over time and analysed using the Fast Fourier Transform (FFT), to reveal the fundamental frequency of vibration (Schumacher & Shariati, Citation2013). Natural frequencies of vibration can be extracted by using the Discrete Fourier Transform (DFT) and the displacement amplitudes can be estimated using targets. The methodology is shown in .
Figure 14. Methodology to measure vibrations with VVS.
The equipment needed to implement this technique consists of a digital camera, the algorithm to process the video and make the vibration analysis, and targets to improve the signal. Examples of the implementation of VVS in the field can be found in Shariati, Schumacher, and Ramanna (Citation2015), Alipour, Shariati, Schumacher, Harris, and Riley (Citation2019a), Zheng, Li, Mao, Wang, and Zhou (Citation2020), where the frequency response of bridges during load testing was identified using targets and commercial digital cameras. The technique was used mainly to calibrate finite element models.
The main advantages are that it is a non-contact technique, multiple objects can be monitored continuously and it has comparable accuracy to accelerometers. The limitations are that small structural vibration can be difficult to measure and the accuracy is dependent on the resolution and frame rate of the digital camera, the distance to the region of interest, the optical lens zoom, and the spatial gradient.
3.2.3. Microwave interferometer radar
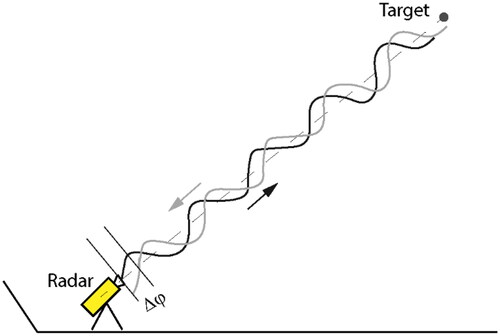
An interferometric radar is a sensor that detects differential displacements of targets in its cone of view by exploiting the phase information of the back-reflected microwave signal (Pieraccini, Citation2013), as illustrated in . The phase difference depends on the distance between the radar and the target. If the target moves fractions of a wavelength, the differential displacement can be detected as a phase shift. The precision depends on the capability of the electronic device to detect the small phase rotation (Pieraccini, Citation2013). The radar transmits a modulated signal that provides the sensor with the ability to detect displacements of several targets. The targets can be positioned at different distances from the radar if they are spaced at a distance equal or more than the resolution of the radar.
Figure 15. Working principle of interferometric radar. Δφ: phase difference.
The microwave radar measures the static deflections of several points on a large structure as well as vibrations to identify resonant frequencies and mode shapes. Every discontinuity on the structure is a potential reflecting target. The implementation of the radar involves two steps. First, several consecutive radar images of the structure are acquired. Then, the displacements of the targets are evaluated with the backscattered microwaves.
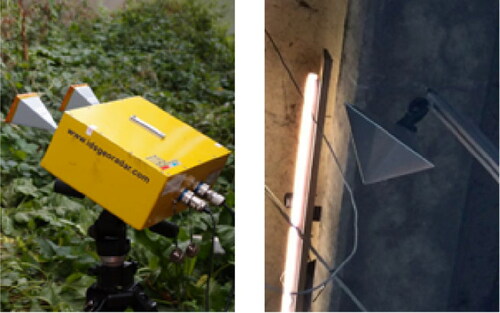
The equipment of the microwave interferometer radar consists of the sensor module mounted on a tripod, the control unit, and the power supply (Gentile, Citation2011). The sensor module is a radar that generates, transmits, and receives electromagnetic waves (see ). It consists of two air horns, one that continuously emits and the other one receives a series of discrete electromagnetic waves for the measurement period. The interferometric radar was designed to obtain a range resolution of 0.50 m (Gentile & Bernardini, Citation2008), this means that two targets can be distinguished if the relative distance between them is at least 0.50 m. It can measure displacements as little as 0.01 mm up to 0.5 km away (IDS Ingegneria Dei Sistemi, Citation2014).
Figure 16. Radar measurement equipment. Left: radar, and right: the reflector (target).
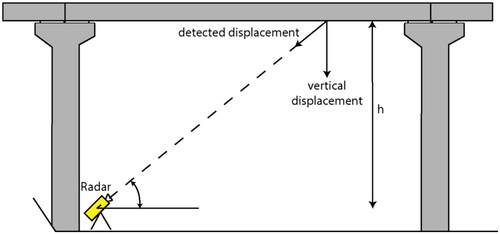
The interferometric technique provides the displacements along the line of sight of the reflecting targets illuminated by the antenna beam. For the computation of the displacements, the direction of motion should be known and then the real displacement can be calculated with a geometric calculation as shown in . The latest version of the radar provides real-time monitoring of the displacements.
Figure 17. Scheme of calculation of actual displacements for bridge monitoring.
The main benefits of the microwave interferometer radar are that it is a real-time remote sensing technique and operates day and night and in all weather conditions. Some of the limitations are that it only measures the relative displacements of the targets in the line of sight and the location of the measurements requires careful planning with the absence of disturbances such as vegetation or other sources.
Some examples of the implementation of the interferometric radar for non-contact vibration and displacement measurements of concrete bridges can be found in Gentile and Bernardini (Citation2008), Mayer, Yanev, Olson, and Smyth (Citation2010), and Sofi, Lumantarna, Mendis, Duffield, and Rajabifard (Citation2017). In Mayer et al. (Citation2010), the radar was used to measure deflections and resonant frequencies on the Manhattan Bridge in New York. Overall, the interferometric measurements compare well with those determined with conventional methods as reported in Pieraccini, Fratini, Parrini, Atzeni, and Bartoli (Citation2008) where the difference was approximately 0.1 mm. Recently, researchers have proposed methods to retrieve displacement components in two directions (vertical and horizontal: transversal or longitudinal) by installing multiple radars (Miccinesi, Beni, & Pieraccini, Citation2021, Michel & Keller, Citation2021, Olaszek, Świercz, & Boscagli, Citation2021). The methods have been applied to monitoring bridges obtaining measurements errors of approximately 0.1 mm.
3.2.4. Fiber optic sensors
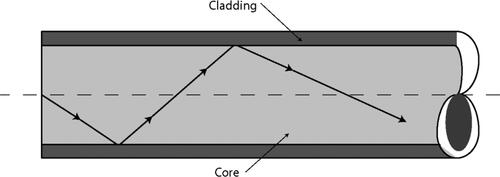
An optical fiber consists of a central core surrounded by a cladding and a coating. The core has a diameter between 4 and 600 µm (Gupta, Citation2006) and it has the function to carry the light inside. The cladding traps light by reflecting the light waves as shown in . This effect is created because the core and the cladding have different refractive indexes. The fiber optic sensors (FOS) measure the change of some property of the guided light.
Figure 18. Scheme of light traveling and reflecting in an optical fiber.
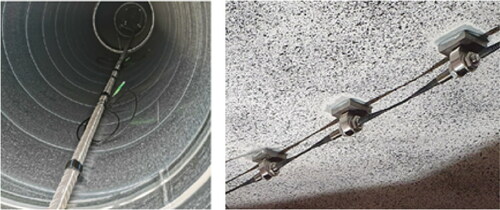
Fiber optic sensors can be classified depending on which properties of light they can modulate: interferometric sensors, polarimetric sensors, intensity-modulated sensors, and spectrometric sensors. The most used sensors are the Fiber Bragg grating (FBG) which are spectrometric sensors that can be multiplexed and can function as quasi-distributed sensors (Ferdinand, Citation2014). The spectrometric sensors monitor changes in the wavelength of the light, which is affected by changes such as strain, and temperature. The usual equipment of an FBG system consists of three elements: (1) the fiber optic sensors, (2) an optical interrogator that illuminates the sensor network and records the reflection return from each of the sensors, and (3) a computer to perform data processing. The fiber optic sensors can be embedded during the concrete casting or bonded to the structure. shows the application of FBG sensors in a concrete slab to monitor strains in steel and concrete (Faassen, Citation2021).
Figure 19. Application of FBG sensors. Left: glued to steel rebar, and right: attached to a concrete surface.
Another type of sensor is the distributed sensor (DFOS) which is based on the interaction between the emitted light and the backscattering caused by changes in strain and temperature. Three different scattering processes can occur, Raman, Brillouin, and Rayleigh (Casas, Barrias, Rodriguez, & Villalba, Citation2019). The advantages of fiber optic sensors are that they are immune to electromagnetic interference, deliver multiple measurements using one cable, no reference is needed, and provide reliable measurements (1 µε) within a relatively wide temperature range (Casas et al., Citation2019). Some of the limitations are that the processing equipment is expensive, they require careful handling and installation (preparation of the surface before bonding and fiber can break with the cracking of concrete), and temperature sensitivity.
Examples of the application of DFOs to concrete bridges have been reported in the literature (Barrias, Rodriguez, Casas, & Villalba, Citation2018, Gehrlein & Fischer, Citation2018, Casas et al., Citation2019). Three DFOS were used to measure the longitudinal bending strain of the San Cugat bridge during a diagnostic load test (Casas et al., Citation2019). It was possible to calculate the deflections through the double integration of the curvature obtained with the DFOS and the results had good agreement with the LVDTs. In Germany, more than 750 m of DFOS were installed to monitor the strain distribution and the occurrence of cracks during the failure tests of an old prestressed concrete bridge (Gehrlein & Fischer, Citation2018).
3.2.5. Acoustic emission sensors
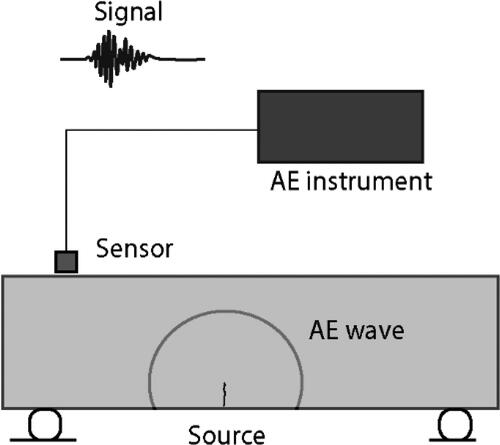
Acoustic emission (AE) sensors are typically made of piezoelectric elements like lead zirconate titanate (PZT) and are protected by metal housings as illustrated in . They are mounted to the surface of the specimen. The sensors detect the mechanical waves generated by changes in the concrete and convert them into electric signals which are recorded and processed by a specialized data acquisition system (Grosse & Ohtsu, Citation2008). AE is considered a passive phenomenon which means that AE signals are only generated when cracks or damage occurs. The AE waves are emitted and captured by the sensors.
Figure 20. Scheme of AE monitoring principle.
AE sensors in reinforced concrete structures can detect cracking (Schechinger & Vogel, Citation2007, Zhang et al., Citation2020), damage using tomography (Choi, Palacios, Popovics, & Chao, Citation2018), or bond-slip of steel bars (Van Steen, Verstrynge, Wevers, & Vandewalle, Citation2019). AE monitoring is mainly used for source localization. It aims to estimate the position of the source, which can be the crack opening or closing for the case of concrete structures. The advantages of AE sensors are that they are very sensitive, and they provide early detection of internal cracking and real-time measurements of the fracture process. Some limitations are the wave propagation is influenced by the material heterogeneity, signal attenuation, noise, highly dependent on the coupling of the sensors and the results can be difficult to interpret.
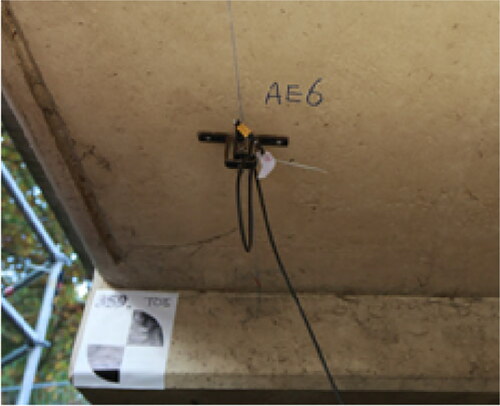
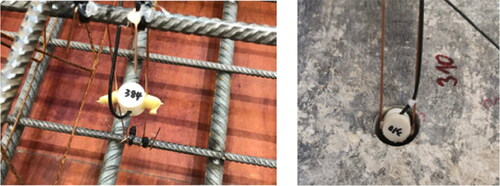
Examples of the use of acoustic emission in load tests on reinforced concrete bridges can be found in the literature since it is useful to monitor the cracking process. Shiotani, Aggelis Dimitrios, and Makishima (Citation2009) used AE sensors to characterize the structural condition of a concrete bridge. In Poland, a three-span concrete bridge made of pre-stressed beams was field-tested and instrumented with AEs (Olaszek, Swit, & Casas, Citation2010). The AE signals allowed researchers to evaluate the cracking state without inducing significant damage. In the USA, AE sensors were used to assess the condition of a prestressed concrete bridge during load testing (Anay, Cortez Tamara, Jáuregui David, Elbatanouny Mohamed, & Ziehl). The AE data helped to develop crack maps and to identify signs of internal microcracking. In the Netherlands, AE sensors were used in a proof load test of an ASR-affected reinforced concrete slab bridge (Yang, Hordijk, & De Boer, Citation2016) as shown in . The AE sensors helped to track the crack active areas and showed that the damage due to the proof loading was limited.
Figure 21. Installation of AE sensor in a proof load test in the Netherlands.
3.2.6. Laser scanning technology
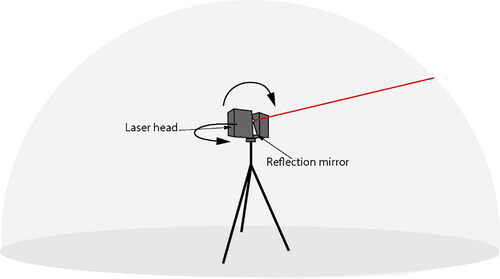
Laser scanning technology, also known as range-finding laser or LiDAR (Light Detection and Ranging) is based on the transmission and receiving of pulsed light (Chen, Citation2012). LiDAR systems can detect position data points (point cloud) in two possible ways: (1) by measuring the traveling time of emitted light pulses between the scanner and the object, and (2) by detecting the phase shift between the two signals. A laser scanner can only collect data points along its direction of view. To obtain the surrounding information, a reflection mirror is placed opposite to the scanner transmitter that allows 360° vertical rotation, and the laser head rotates 360° horizontally (Liu, Citation2010) as illustrated in . A pulse or a series of light is emitted from the transmitter and part of the scattered energy is reflected to the receiver after reaching the object area. The LiDAR scanning unit can collect millions of data points assigning a 3 D coordinate value to each scan point.
Figure 22. Operating principle of LiDAR scanner.
The advantages of LiDAR are that it is a non-contact remote sensing technique that allows data collection of a large area (full-field monitoring), unaffected by light conditions, and it provides permanent documentation. However, it is limited to surface point positional data and the direct output of the scanner requires additional data processing methods to account for the sources of error and extract the information needed for bridge monitoring.
LiDAR system can be effective to assess deformations, deflections, vibration levels, and cracking of concrete structures (ACI Committee 444, 444 Citation2021). Examples of the use of LiDAR systems in load tests on reinforced concrete bridges can be found in the literature since it is useful to extract general geometrical information as in Schmidt et al. (Citation2018), and Trias, Yu, Gong, and Moon (Citation2021) or to assess deformations as in Chen (Citation2012). In Lõhmus, Ellmann, Märdla, and Idnurm (Citation2018), LiDAR was used to capture vertical deformations during load tests. The vertical deformations were compared to precise leveling, reflectorless tachometer, and dial gauges measurements obtaining differences between 3.4 and 0.8 mm. In Watson (Citation2019) diagnostic load tests were carried out to calibrate FEM models. LiDAR was able to measure the bridge response in terms of deflections and rotation, and it was useful to capture the unexpected response due to asymmetric geometry. The measurement resolution is in millimeters (Chen, Citation2012).
3.3. Emerging technology
3.3.1. Smart aggregates
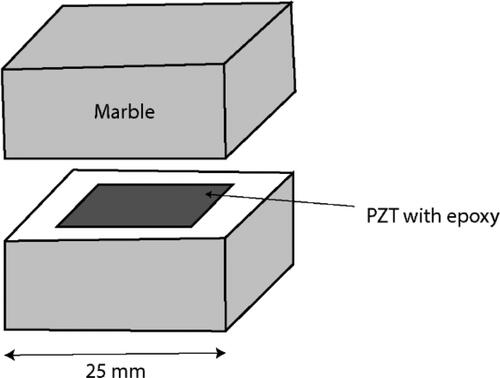
The smart aggregate (SA) is an embedded sensor (Song, Gu, & Mo, Citation2008) that consists of a PZT patch placed in between two marble elements. The PZT is covered by epoxy for waterproofing (see ). The piezoelectric property of the PZT patch allows the sensor to act as both an actuator (source) of ultrasonic elastic waves and a receiver (sensor). Since their mechanical properties are comparable to the aggregates in normal concrete, SAs can be embedded inside the concrete. Concrete protects them from environmental influences. Therefore, SA sensors can perform stably over time. In the laboratory, SAs has provided information about crack distribution (Du, Yang, & Hordijk, Citation2018), and strain and stress changes (Kevinly, Zhang, Yang, Draganov, & Weemstra, Citation2021) inside the concrete.
Figure 23. Structure of a smart aggregate.
For the assessment of existing structures, a grid of SAs can be installed by casting them inside drilled holes as described in Du et al. (Citation2018). Between each pair of SAs, ultrasonic waves are generated and received obtaining the basic properties such as travel time and attenuation. The damage distribution can be estimated by comparing the updated measurements with the reference. The concept was evaluated in the lab on a scaled concrete beam with promising results. The advantages of SA sensors are that installation is not limited to the surface, they can be placed in the zone of interest by drilling holes or embedded (see ), they are less influenced by the environmental conditions, can serve for long-term monitoring, and their cost is low. However, they are not commercialized and further investigation is needed for the application on field tests.
Figure 24. Installation of SA sensors. Left: before casting, and right: inside a drilled hole in an existing structure.
3.3.2. Radiofrequency identification sensors
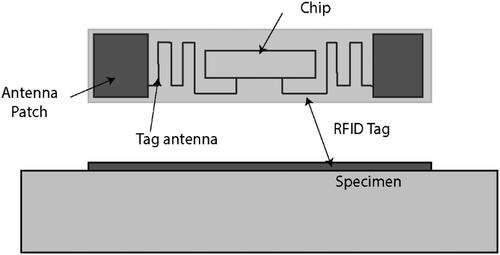
Radiofrequency identification (RFID) uses electromagnetic fields (EM) to automatically identify and track tags. Passive RFID is an emerging technology where the RFID reader first transmits continuous waves (CW) to the tag to wirelessly power the chip, and then receives the modulated RF commands from the tag. A scheme of an RFID tag is shown in . This type of sensor can measure displacement, strains and can monitor environmental conditions such as moisture, humidity, and temperature.
Figure 25. Scheme of RFID tag.
The main advantages of RFID sensors are that it is a remote sensing technique, which does not require a power supply, can monitor environmental conditions, can be embedded, and that several tags could provide monitoring of a large area. However, they need insulation and cannot be embedded very deep. Further investigation is needed to determine the long-term behaviour. In laboratory environments, the method has been used to measure displacements with an accuracy of the order of millimeters and strains in the order of microstrains (Cazeca, Mead, Chen, & Nagarajan, Citation2013, Ozbey, Erturk, Demir, Altintas, & Kurc, Citation2016). Concerning crack detection, an RFID antenna for the detection of surface cracks was introduced by Kalansuriya, Bhattacharyya, and Sarma (Citation2013), which also proposed a 2-D grid of tags to improve spatial coverage. For long-term structural monitoring, an example of RFID-based embedded sensors can be found in the duraBAst test bridge in Germany (Strangfeld, Hindersmann, & Niederleithinger, Citation2021). The sensors were designed to withstand the alkaline environment of the concrete and to measure moisture and corrosion.
3.4. Environmental sensors
Environmental factors such as temperature, humidity, and wind can affect structural response and should be properly accounted for during the load test preparation, the testing, and also the post-test analysis (Alampalli et al., Citation2019). Temperature changes can affect the results of a load test by a) causing an unexpected response of the sensor or measuring technique, and b) inducing thermal stresses and strains to the structure.
Some strategies used to reduce the effect of temperature on the sensors used for load tests are:
To select sensors with small temperature sensitivity and to follow the manufacturers' instructions to apply the temperature correction factors.
To protect the sensors during the load test.
Some strategies use to quantify the effect of temperature on the structure during load tests are:
To deploy a reference sensor outside the loaded area to measure the influence of the temperature changes and calculate the net effect of the applied load.
To measure the response of the sensors over a certain period when the bridge is not loaded and then use these results as a reference to adjust the data obtained during the load test.
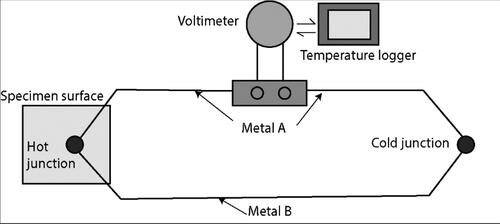
Several types of sensors can be used to directly measure the temperature, such as thermocouples, thermistors, vibrating wire strain gauges, and fiber optic sensors. For example, thermocouples are made of two dissimilar metals joined together to form two junctions. When used for load test, one junction is placed on the surface of the specimen while the other junction remains at a known constant temperature (see ). When there is a temperature change, an electric current flows through the circuit, which is measured in millivolt and then converted to temperature readings.
Figure 26. Working principle of thermocouple.
4. Comparison of measuring techniques
provides a general comparison of the measuring techniques that are reviewed in this paper. The table includes the parameter it measures, the mechanism of the measuring technique, the suitability to perform dynamic measurements, the measuring range, the estimated range of accuracy, the overall advantages and disadvantages, and the distance for remote measurements. The actual accuracy must be consulted in the datasheet provided by the manufacturers. Additionally, sources of error from the installation, the data acquisition system, and the translation from voltage to signal should be considered.
Table 3. Summary of techniques and sensors.
Displacement measurements of a structural member can be performed with a variety of techniques. While contact sensors provide high accuracy measurements, the drawback is the necessity to be fixed and wired. Non-contact techniques provide the advantage that the measurements can be obtained from a remote location, however, some need a speckle pattern or a target attached to the surface which can increase the set-up time. Strains are usually measured with electrical strain gauges or strain transducers which can only be used as discrete or punctual sensors, need to be attached to the structure, and require connecting cables. On the other hand, fiber optic sensors present the advantage that large lengths of a structure can be monitored with both strain and temperature measurements in a distributed way using one cable. Additionally, these sensors are immune to electromagnetic interference and provide high sensitivity and accuracy (Casas et al., Citation2019).
Acoustic emission and Digital Image Correlation can be used to monitor and detect the location of the cracks during a load test. Some commercial DIC systems can display real-time results. AE sensors can monitor detect the internal micro-cracking in real-time, which provides insight into the initiation and propagation of cracks. But the results cannot be directly linked to physical parameters like crack width or strain without further interpretation. Dynamic response parameters such as natural frequencies, mode shapes, and vibration amplitudes are usually recorded with accelerometers. An option to measure these parameters from a remote location is VVS, which also has the advantage of monitoring several targets.
5. Sensor selection
5.1. Required measurements during diagnostic load tests
In a diagnostic load test, the main goal is to measure the structural responses of the bridge to validate an analytical model. Thus, the sensors must be installed so that the data gathered from the field can capture the information needed for the analytical models. Based on the literature study in 2.1, provides a general description of the measurement requirements of a diagnostic load test. Additionally, as discussed in the previous section, the effects of environmental factors, such as temperature and humidity should be considered.
Table 4. Goal of the diagnostic load test of a reinforced concrete bridge and measurements.
5.2. Required measurements during proof load tests
For proof load tests, the monitoring of the structural responses is critical since it provides a warning to avoid the damage of the bridge during the test. In a proof load test, the sensors are installed at the critical locations so that the measurements of the structural responses of the governing failure mode can be compared to the stop criteria. The current codes and guidelines (Stahlbeton & Deutscher Ausschuss Für Stahlbeton, Citation2000, ACI Committee 437, 437 Citation2013) as well as the recommendations formulated in the Netherlands (Lantsoght, Van Der Veen, & Hordijk, Citation2016, Lantsoght, Yang, Van Der Veen, Hordijk, & De Boer, Citation2019) define the stop criteria on the measurements of deflections, applied load, strains, crack widths, displacements and identification of cracks. In addition, the Manual for Bridge Evaluation (AASHTO, 2011) recommends monitoring the local inclination of the bridge during load testing. A summary of the recommended measurements during a proof load test is shown in . As in a diagnostic load test, the effects of the temperature and humidity should be considered to correct the readings and to check the operating range of the sensors.
Table 5. Stop criteria and measurements during a proof load test of a reinforced concrete bridge.
5.3. Guidance for sensor selection
An important aspect of the planning and preparation of a load test is the design of an instrumentation plan. This plan should include details such as the position, type, expected measurement range, sampling rate, data acquisition system (DAQ), data visualization software, installation plan as well as a justification of the selection of the sensors. Prior to the load test, the DAQ and the data visualization software must be properly selected and verified. The choice must be based on the type of test and its goals. Sampling rates should correspond to the loading speed and expected speed of change in responses. For example, a dynamic load test requires a higher sampling rate. For proof load tests, real-time data visualization is of the utmost importance for the verification of stop criteria.
It is also important to examine all the available information and determine the uncertainties (e.g. material properties, structural plans, boundary conditions) before the definition of the sensor plan, as well as to align the choices with the specific objective of the load test. Regarding the personnel requirements, a qualified engineer should be responsible for the planning and execution of the load test (Alampalli et al., Citation2019). The engineer should have experience with field testing, sensors, instrumentation, and knowledge of structural bridge behaviour. For example, in the USA, load testing requires a licensed professional engineer (PE) (ACI Committee 437, 437 Citation2013).
The selection of the sensors or measuring techniques for the development of a sensor plan should be based on several important criteria:
The parameters or structural response that will be measured. It is important to understand the relationship between the measured variable, the structural components, and the loading case.
Carry out preliminary calculations to provide an insight into the expected range. These calculations will help select the range, sensitivity, and accuracy of the sensors. In the case of a proof load test, this step also includes the definition of the stop criteria. Additionally, the loading speed of the proof load test will determine the sampling rate of the sensors and DAQ.
Site conditions and the accessibility to the bridge and the locations where the sensors should be applied.
The environmental conditions in which the measurements will be made. The effect of the ambient conditions should be considered. The changes in temperature and humidity affect the measured structural response and the performance of the sensor, therefore, a compensation plan should be included.
Include redundancy of the critical measurements to account for unexpected events.
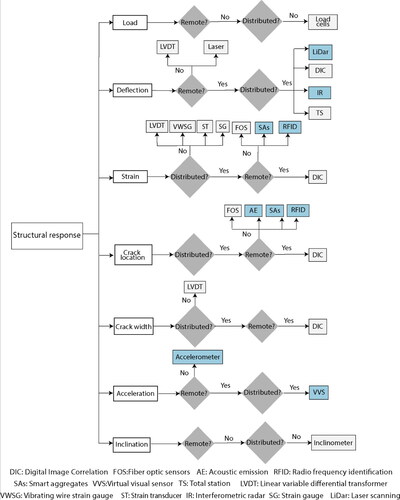
The steps in the process of selecting a sensor or measuring technique are summarized in . The first step is to identify the variables or structural responses that need to be monitored. Secondly, the accessibility to the site must be considered. This can determine the need for using a remote technique to collect the data from a certain distance. In this paper, the sensor is considered remote if it can measure at a distance of larger than 1 m. Finally, a choice can be made between monitoring at a given position or in a distributed way. In , the sensors highlighted in blue are the ones that require additional processing methods to extract the structural response or that the interpretation of results is complex.
Figure 27. Measuring technique or sensor selection flow chart.
6. Discussion
From our literature study, most measuring techniques for load testing are based on traditional sensors (see and 2). That is the reason why instrumenting a bridge is a time-consuming and labor-intensive activity. To speed up the instrumentation of a bridge, lower the cost, and obtain a more comprehensive understanding, the sensor plan should include recently developed measuring techniques. The ideal scenario would be to keep the sensor plan as simple as possible using a limited number of sensors but collecting all the important data. This could be achieved by relying on the measurement techniques that provide distributed measurements.
The most promising techniques for load testing, especially for proof load tests, are DIC, AE, and FOS. This paper has presented examples where DIC has been successfully used to monitor the crack development and obtain deflection measurements of concrete bridges. AES could be used to monitor the micro-cracks and the onset of the opening critical of cracks. This could be used as a stop criterion or a warning during the proof load test. Additionally, this technique could be combined with smart aggregates. Finally, FOS have the advantage of measuring strains over larger distances in a (semi) distributed way using only one cable.
A more comprehensive assessment of a bridge could be achieved by integrating multiple techniques. For example, a sensor plan for proof loading can include AE sensors, FOS, and DIC. In particular, DIC has the potential to be used in combination with other techniques. For example, to predict the exact initiation of a critical crack, AES can monitor the internal cracking and they can be complemented with the DIC analysis of the concrete surface to obtain a better understanding of the crack development.
Regarding the cost of the instrumentation, it is only a part of the entire cost of the load test and includes the design, installation, preparation, management, and maintenance. For instance, while the initial cost of FOs equipment is higher than those of traditional strain sensors, the capability of monitoring larger area of the structure, the stability and lower cost of FOs (when compared to the cost of installing and wiring, cable extensions, and protection of sensors) make them competitive. Thus a cost-benefit analysis is always important to determine if the monitoring system is cost-effective or not.
7. Conclusions
Two types of field tests are typically used to evaluate concrete bridges: diagnostic load tests and proof load tests. The goal of a diagnostic load test is to gather measurements to validate a model. In a proof load test, large loads are applied to the bridge to directly demonstrate it can safely resist such loads. The instrumentation of a proof load test is fundamental to stop the loading and avoid irreversible damage or the collapse of the structure. It requires real-time measurements.
In the last decades, technology has advanced and techniques such as DIC, interferometer radar, LiDAR systems, total stations, FOs, and AE have been successfully incorporated into the sensor plans. This paper has reviewed various sensors and measuring techniques that are applicable to load testing of concrete bridges. The applications, methodology, advantages, and disadvantages have been presented. A flowchart for the selection of sensors or measuring techniques for load testing has been developed as a tool to guide engineers. Based on this review, the following recommendations can be made:
The measurement requirements of a diagnostic load test are: (a) strains for transverse load distribution and identification of neutral axis, (b) rotation for the degree of fixity, (c) deflections and (d) acceleration.
The recommended measurements during a load test are: (a) deflections to identify the nonlinear behaviour and the stiffness reduction, (b) concrete strain at critical positions, (c) crack width measurements, (d) development of cracks and (e) joint and substructure displacements.
Some considerations to account for when selecting a sensor are: (a) carrying out the preliminary calculations to select range, sensitivity, and accuracy of the sensors, (b) recognition of the site conditions and accessibility to the bridge, (c) consideration of environmental conditions and d) redundancy.
Non-contact techniques are the better choice for bridges that are difficult to access.
SAs and RFID are emerging technology with promising results in laboratory conditions.
Deflections can be measured with a total station, interferometric radar, LiDAR system, or DIC from a remote location.
Strains can be monitored in a distributed way covering larger lengths and areas by using techniques such as FOs, or DIC.
SA and AE can monitor the internal cracking and provide insight into the initiation and propagation of the cracks earlier than other techniques. While DIC can monitor from a remote location.
Acceleration measurements can be obtained from a remote location using VVS.
Disclosure statement
No potential conflict of interest was reported by the authors.
References
- A bedin, M., De Caso Y Basalo, F. J., Kiani, N., Mehrabi, A. B., & Nanni, A. (2022). Bridge load testing and damage evaluation using model updating method. Engineering Structures, 252, 113648. doi:10.1016/j.engstruct.2021.113648
- ACI Committee 342. (2016). Report on flexural live load distribution methods for evaluating existing bridges. Farmington Hills, MI: American Concrete Institute.
- ACI Committee 437. (2013). Code requirements for load testing of existing concrete structures (ACI437.2M-13) and commentary. Farmington Hills, MI: American Concrete Institute.
- ACI Committee 444. (2021). Structural health monitoring technologies for concrete structures – report (PRC-444.2-21). Farmington Hills, MI.: American Concrete Institute.
- Aguilar, C. V., Jáuregui, D. V., Newtson, C. M., Weldon, B. D., & Cortez, T. M. (2015). Load rating a prestressed concrete double t-beam bridge without plans by field testing. Transportation Research Record: Journal of the Transportation Research Board, 2522(1), 90–99. doi:10.3141/2522-09
- Aktan, A. E., Catbas, F. N., Grimmelsman, K. A., & Pervizpour, M. (2003). Development of a model health monitoring guide for major bridges. Federal Highway Administration Research and Development (FHWA).
- Aktan, A. E., Zwick, M., Miller, R. A., & Shahrooz, B. M. (1992). Nondestructive and destructive testing of decommissioned reinforced concrete slab highway bridge and associated analytical studiesed. ^eds.
- Alampalli, S., Frangopol, D. M., Grimson, J., Kosnik, D., Halling, M., Lantsoght, E. O., … Zhou, Y. E. (2019). Primer on bridge load testing. Transportation Research Board (TRB) Washington, DC, USA.
- Alipour, M., Shariati, A., Schumacher, T., Harris, D. K., & Riley, C. J. (2019a). Digital image and video-based measurements. In Lantsoght, E. (Ed.), Load testing of bridges: Proof load testing and the future of load testing (pp. 143–262). London, UK: CRC Press.
- Alipour, M., Washlesky, S. J., & Harris, D. K. (2019b). Field deployment and laboratory evaluation of 2d digital image correlation for deflection sensing in complex environments. Journal of Bridge Engineering, 24(4), 04019010. doi:10.1061/(ASCE)BE.1943-5592.0001363
- Al-Mahaidi, R., Taplin, G., & Giufre, A. (2000). Load distribution and shear strength evaluation of an old concrete t-beam bridge. Transportation Research Record: Journal of the Transportation Research Board, 1696(1), 52–62. doi:10.3141/1696-08
- AASHTO. (2011). The manual for bridge evaluation. Washington, D.C: AASHTO.
- Anay, R., Cortez, T. M., Jáuregui, D. V., Elbatanouny, M. K., & Ziehl, P. (2016b). On-site acoustic-emission monitoring for assessment of a prestressed concrete double-tee-beam bridge without plans. Journal of Performance of Constructed Facilities, 30(4), 04015062. doi:10.1061/(ASCE)CF.1943-5509.0000810
- Arockiasamy, M., & Amer, A. (1998). Load distribution on highway bridges based on field test data: Phase iii. Report for Florida Department of Transportation.
- Barrias, A., Rodriguez, G., Casas, J. R., & Villalba, S. (2018). Application of distributed optical fiber sensors for the health monitoring of two real structures in Barcelona. Structure and Infrastructure Engineering, 14(7), 967–985. doi:10.1080/15732479.2018.1438479
- Bridge Diagnostics. (2018). Operations manual ST350-strain transducer.
- Brooks, J. (2014). Concrete and masonry movements. Oxford, UK: Butterworth-Heinemann.
- Caglayan, B., Ozakgul, K., & Tezer, O. (2012). Assessment of a concrete arch bridge using static and dynamic load tests. Structural Engineering and Mechanics, 41(1), 83–94. doi:10.12989/sem.2012.41.1.083
- Campana, S., Fernández Ruiz, M., Anastasi, A., & Muttoni, A. (2013). Analysis of shear-transfer actions on one-way RC members based on measured cracking pattern and failure kinematics. Magazine of Concrete Research, 65(6), 386–404. doi:10.1680/macr.12.00142
- Campbell Scientific Inc. (2020). Granite VWire 305 8-channel dynamic-wire analyzer.
- Casas, J. R., Barrias, A., Rodriguez, G. G., & Villalba, S. (2019). Fiber optics for load testing. In Lantsoght, E. (Ed.), Load testing of bridges: Proof load testing and the future of load testing (pp. 143–262). London, UK: CRC Press.
- Catbas, N., Ciloglu, S. K., & Aktan, A. (2005). Strategies for load rating of infrastructure populations: A case study on t-beam bridges. Structure and Infrastructure Engineering, 1(3), 221–238. doi:10.1080/15732470500031008
- Cavagnis, F., Fernández Ruiz, M., & Muttoni, A. (2018). An analysis of the shear-transfer actions in reinforced concrete members without transverse reinforcement based on refined experimental measurements. Structural Concrete, 19(1), 49–64. doi:10.1002/suco.201700145
- Cazeca, M. J., Mead, J., Chen, J., & Nagarajan, R. (2013). Passive wireless displacement sensor based on RFID technology. Sensors and Actuators A: Physical, 190, 197–202. doi:10.1016/j.sna.2012.11.007
- Chen, S.-E. (2012). Laser scanning technology for bridge monitoring. In Rodriguez, J.A.M (Ed.), Laser scanner technology (pp. 71–92). Rijeka: InTech.
- Choi, H., Palacios, G., Popovics, J. S., & Chao, S.-H. (2018). Monitoring damage in concrete columns using ultrasonic tomography. ACI Structural Journal, 115(2), 545–558. doi:10.14359/51701117
- Christensen, C. O., Schmidt, J. W., Halding, P. S., Kapoor, M., & Goltermann, P. (2021). Digital image correlation for evaluation of cracks in reinforced concrete bridge slabs. Infrastructures, 6(7), 99. doi:10.3390/infrastructures6070099
- Colombani, I. A., & Andrawes, B. (2022). Comparison of load rating of reinforced concrete slab bridge using analytical and field testing approaches. Innovative Infrastructure Solutions, 7(1), 1–12. doi:10.1007/s41062-021-00677-9
- Deutscher Ausschuss Für Stahlbeton. (2000). Datstb-guideline: Load tests on concrete structures (in german) (DAfStb-richtlinie: Belastungsversuche an betonbauwerken). Berlin: Deutscher Ausschuss fur Stahlbeton.
- Diaz Arancibia, M., & Okumus, P. (2018). Load testing of highly skewed concrete bridges. ACI Symposium Publication, 323.
- Du, C., Yang, Y., & Hordijk, D. (2018). Experimental investigation on crack detection using embedded smart aggregate. IALCCE 2018. Ghent.
- Ettouney, M., & Alampalli, S. (2012). Infrastructure health in civil engineering. Theory and components. Boca Raton, FL: CRC Press.
- Faassen, L. (2021). FBG optical fibers in proof loading of concrete slab bridges (Master Thesis). Delft University of Technology.
- Feng, M. Q., Fukuda, Y., Feng, D., & Mizuta, M. (2015). Nontarget vision sensor for remote measurement of bridge dynamic response. Journal of Bridge Engineering, 20(12), 04015023. doi:10.1061/(ASCE)BE.1943-5592.0000747
- Fennis, S., & Hordijk, D. A. (2014). Proof load halvemaans bridge in alkamar (in dutch) proefbelasting halvemaansbrug alkmaar Stevin Report (25.5-14-05), 72.
- Fennis, S., Hordijk, D. A., Yuguang, Y., & Koekkoek, R. T. (2015). Assessment of viaduct vlijmen oost by proof loading. Stevin Report (25.5-15-10), 126.
- Ferdinand, P. (2014). The evolution of optical fiber sensors technologies during the 35 last years and their applications in structural health monitoring. EWSHM – 7th European Workshop on Structural Health Monitoring, Nantes, France.
- Gehrlein, S., & Fischer, O. (2018). Results of the full-scale shear capacity tests at the Hammelburg bridge with special attention on the fibre-optical measurement and a comparison with current engineering models.
- Gentile, C. (2011). Vibration measurement by radar techniques.
- Gentile, C., & Bernardini, G. (2008). Output-only modal identification of a reinforced concrete bridge from radar-based measurements. NDT & E International, 41(7), 544–553. doi:10.1016/j.ndteint.2008.04.005
- GeokonInc. (2014). Instruction manual model 4000 (and 4050) vibrating wire strain gauge.
- Grosse, C., & Ohtsu, M. (2008). Acoustic emission testing: Basics for research applications in civil engineering. Berlin: Springer.
- Gupta, B. D. (2006). Fiber optic sensors: Principles and applications: Pitam Pura, New Delhi: New India Publishing Agency.
- Hag-Elsafi, O., & Kunnin, J. (2006). Load testing for bridge rating: Dean’s mill road over Hannacrois creek. Albany, NY: Transportation Research and Development Bureau, New York State Department of Transportation.
- Haitjema, H. (2020). The calibration of displacement sensors. Sensors (Basel, Switzerland), 20(3), 584. doi:10.3390/s20030584
- Halding, P. S., Schmidt, J. W., Jensen, T. W., & Henriksen, A. H. (2017). Structural response of full-scale concrete bridges subjected to high load magnitudes. Fourth Conference on smart monitoring, assessment and rehabilitation of civil structures. Zürich, Switzerland.
- Hernandez, E., & Myers, J. (2015). In-situ field test and service response of Missouri bridge A7957.
- Hernandez, E., & Myers, J. (2018). Strength evaluation of prestressed concrete bridges by dynamic load testing.
- Huber, P., Huber, T., & Kollegger, J. (2016). Investigation of the shear behavior of RC beams on the basis of measured crack kinematics. Engineering Structures, 113, 41–58. doi:10.1016/j.engstruct.2016.01.025
- IDS Ingegneria Dei Sistemi. (2014). Ibis-fs. An innovative sensor for remote monitoring of structural movements and deformations.
- Jáuregui, D. V., White, K. R., Woodward, C. B., & Leitch, K. R. (2003). Noncontact photogrammetric measurement of vertical bridge deflection. Journal of Bridge Engineering, 8(4), 212–222. doi:10.1061/(ASCE)1084-0702(2003)8:4(212)
- Jeffrey, A., Breña, S. F., & Civjan, S. A. (2009). Evaluation of bridge performance and rating through nondestructive load testing. Report for Vermont Agency of Transportation One National Life Drive.
- Jones, B. P. (2011). Reevaluation of the AASHTO effective width equation in concrete slab bridges in Delaware (Master degree). University of Delaware.
- Juntunen, D. A., & Isola, M. C. (1995). Proof load test of R01 of 61131M-37 over CSX railroad, South of Bailey, Michigan. Michigan Department of Transportation 58.
- Kalansuriya, P., Bhattacharyya, R., & Sarma, S. (2013). Rfid tag antenna-based sensing for pervasive surface crack detection. IEEE Sensors Journal, 13(5), 1564–1570. doi:10.1109/JSEN.2013.2240155
- Kevinly, C., Zhang, F., Yang, Y., Draganov, D., & Weemstra, C. (2021). A study on monitoring multi-scale concrete members with coda-wave interferometry using embedded transducers.
- Khuc, T., & Catbas, F. N. (2017). Computer vision-based displacement and vibration monitoring without using physical target on structures. Structure and Infrastructure Engineering, 13(4), 505–516. doi:10.1080/15732479.2016.1164729
- Koekkoek, R. T., Lantsoght, E., & Hordijk, D. A. (2015). Proof loading of the asr-affected viaduct zijlweg in highway a59. Stevin report (25.5-15-08), 189.
- Koekkoek, R. T., Lantsoght, E., Yuguang, Y., & Hordijk, D. A. (2016). Assessment of viaduct de beek by proof loading. Stevin Report (25.5-16-01), 125.
- Kundu, T., Nonis, C., Niezrecki, C., Yu, T.-Y., Ahmed, S., Su, C.-F., & Schmidt, T. (2013). Structural health monitoring of bridges using digital image correlation. Health Monitoring of Structural and Biological Systems 2013. Oakland, CA: SIE.
- Küntz, M., Jolin, M., Bastien, J., Perez, F., & Hild, F. (2006). Digital image correlation analysis of crack behavior in a reinforced concrete beam during a load test. Canadian Journal of Civil Engineering, 33(11), 1418–1425. doi:10.1139/l06-106
- Lachat, E., Landes, T., & Grussenmeyer, P. (2017). Investigation of a combined surveying and scanning device: The trimble sx10 scanning total station. Sensors (Basel), 17(4), 730. doi:10.3390/s17040730
- Lantsoght, E. (2019). Load testing of bridges: Proof load testing and the future of load testing. In Frangopol, D.M. (Ed.), Structures and infrastructures. London, UK: CRC Press.
- Lantsoght, E., Van Der Veen, C., & Hordijk, D. A. (2016). Proposed stop criteria for proof load testing of concrete bridges and verification. IALCCE. Ghent, Belgium.
- Lantsoght, E., Van Der Veen, C., De Boer, A., & Hordijk, D. A. (2017a). Proof load testing of reinforced concrete slab bridges in the Netherlands. Structural Concrete, 18(4), 597–606. doi:10.1002/suco.201600171
- Lantsoght, E., Van Der Veen, C., De Boer, A., & Hordijk, D. A. (2017b). State-of-the-art on load testing of concrete bridges. Engineering Structures, 150, 231–241. doi:10.1016/j.engstruct.2017.07.050
- Lantsoght, E., Yang, Y., Van Der Veen, C., Hordijk, D. A., & De Boer, A. (2019). Stop criteria for flexure for proof load testing of reinforced concrete structures. Frontiers in Built Environment, 5, 47. doi:10.3389/fbuil.2019.00047
- Liu, W. (2010). Terrestrial lidar-based bridge evaluation (PhD). Universtity of North Carolina.
- Lõhmus, H., Ellmann, A., Märdla, S., & Idnurm, S. (2018). Terrestrial laser scanning for the monitoring of bridge load tests – Two case studies. Survey Review, 50(360), 270–284. doi:10.1080/00396265.2016.1266117
- Lydon, D., Lydon, M., Taylor, S., Del Rincon, J. M., Hester, D., & Brownjohn, J. (2019). Development and field testing of a vision-based displacement system using a low cost wireless action camera. Mechanical Systems and Signal Processing, 121, 343–358. doi:10.1016/j.ymssp.2018.11.015
- Mayer, L., Yanev, B. S., Olson, L. D., & Smyth, A. W. (2010). Monitoring of Manhattan bridge for vertical and torsional performance with gps and interferometric radar systemsed. ^eds. Transportation Research Board 89th Annual Meeting.
- Mccormick, N., Waterfall, P., & Owens, A. (2014). Optical imaging for low-cost structural measurements. Proceedings of the Institution of Civil Engineers - Bridge Engineering, 167(1), 33–42. doi:10.1680/bren.11.00055
- Merkle, W. J., & Myers, J. (2006). Load testing and load distribution response of Missouri bridges retrofitted with various frp systems using a non-contact optical measurement system. Transportation Research Board, 85th Annual Meeting January 22nd–26th Citeseer.
- Merkle, W., & Myers, J. J. (2004). Use of the total station for serviciability monitoring of bridges with limited access in Missouri, USA. USA: Center of Infrastructure Engineering Studies (CIES).
- Miccinesi, L., Beni, A., & Pieraccini, M. (2021). Multi-monostatic interferometric radar for bridge monitoring. Electronics, 10(3), 247. doi:10.3390/electronics10030247
- Michel, C., & Keller, S. (2021). Advancing ground-based radar processing for bridge infrastructure monitoring. Sensors, 21(6), 2172. doi:10.3390/s21062172
- Modares, M., & Waksmanski, N. (2013). Overview of structural health monitoring for steel bridges. Practice Periodical on Structural Design and Construction, 18(3), 187–191. doi:10.1061/(ASCE)SC.1943-5576.0000154
- MTI Instruments Inc. (2014). An introduction to laser triangulation sensors [online]. https://www.azosensors.com/article.aspx?ArticleID=523.
- Murienne, B. J., & Nguyen, T. D. (2016). A comparison of 2d and 3d digital image correlation for a membrane under inflation. Optics and Lasers in Engineering, 77, 92–99. doi:10.1016/j.optlaseng.2015.07.013
- Murray, C., Hoag, A., Hoult, N. A., & Take, W. A. (2015). Field monitoring of a bridge using digital image correlation. Proceedings of the Institution of Civil Engineers - Bridge Engineering, 168(1), 3–12. doi:10.1680/bren.13.00024
- National Instruments. (1998). Strain gauge measurement – A tutorial, Application Note 078 National Instruments.
- Olaszek, P., Chen, A., Frangopol, D., & Ruan, X. (2014). Deflection monitoring system making use of inclinometers and cubic spline curves. Bridge Maintenance, Safety, Management and Life Extension; CRC Press: London, UK, 2305–2312
- Olaszek, P., Łagoda, M., & Casas, J. R. (2014). Diagnostic load testing and assessment of existing bridges: Examples of application. Structure and Infrastructure Engineering, 10(6), 834–842. doi:10.1080/15732479.2013.772212
- Olaszek, P., Świercz, A., & Boscagli, F. (2021). The integration of two interferometric radars for measuring dynamic displacement of bridges. Remote Sensing, 13(18), 3668. doi:10.3390/rs13183668
- Olaszek, P., Swit, G., & Casas, J. (2010). Proof load testing supported by acoustic emission: An example of applicationed. ^eds. International Conference on Bridge Maintenance, Safety and Management CRC Press, 472–479.
- Omega Engineering Inc. (2020). Load cells & force sensors.
- Ozbey, B., Erturk, V. B., Demir, H. V., Altintas, A., & Kurc, O. (2016). A wireless passive sensing system for displacement/strain measurement in reinforced concrete members. Sensors, 16(4), 496. doi:10.3390/s16040496
- Pan, B., Qian, K., Xie, H., & Asundi, A. (2009). Two-dimensional digital image correlation for in-plane displacement and strain measurement: A review. Measurement Science and Technology, 20(6), 062001. doi:10.1088/0957-0233/20/6/062001
- Pan, B., Xie, H., Guo, Z., & Hua, T. (2007). Full-field strain measurement using a two-dimensional digital differentiator in digital image correlation. Optical Engineering, 46(3), 033601. doi:10.1117/1.2714926
- PCB. (2011). Piezotronics tech support documents [online]. http://www.pcb.com/techsupport/tech_indaccel.
- Pieraccini, M. (2013). Monitoring of civil infrastructures by interferometric radar: A review. TheScientificWorldJournal, 2013, 786961. doi:10.1155/2013/786961
- Pieraccini, M., Fratini, M., Parrini, F., Atzeni, C., & Bartoli, G. (2008). Interferometric radar vs. Accelerometer for dynamic monitoring of large structures: An experimental comparison. NDT & E International, 41(4), 258–264. doi:10.1016/j.ndteint.2007.11.002
- Rion (2014)., Specifications single- axis inclinometer.
- Sanayei, M., Reiff, A. J., Brenner, B. R., & Imbaro, G. R. (2016). Load rating of a fully instrumented bridge: Comparison of LRFR approaches. Journal of Performance of Constructed Facilities, 30(2), 04015019. doi:10.1061/(ASCE)CF.1943-5509.0000752
- Saraf, V. K. (1998). Evaluation of existing rc slab bridges. Journal of Performance of Constructed Facilities, 12(1), 20–24. doi:10.1061/(ASCE)0887-3828(1998)12:1(20)
- Sas, G., Blanksvärd, T., Enochsson, O., Täljsten, B., & Elfgren, L. (2012). Photographic strain monitoring during full-scale failure testing of örnsköldsvik bridge. Structural Health Monitoring, 11(4), 489–498. doi:10.1177/1475921712438568
- Schacht, G., Bolle, G., & Marx, S. (2015). Experimental in-situ investigation of the shear bearing capacity of pre-stressed hollow core slabs. Concrete Repair, Rehabilitation and Retrofitting IV (pp. 851–859). London, UK: CRC Press.
- Schechinger, B., & Vogel, T. (2007). Acoustic emission for monitoring a reinforced concrete beam subject to four-point-bending. Construction and Building Materials, 21(3), 483–490. doi:10.1016/j.conbuildmat.2006.04.003
- Schmidt, J. W., Halding, P. S., Jensenm, T. W., & Engelund, S. (2018). High magnitude loading of concrete bridges. ACI Symposium Publication, 323.
- Schmidt, J. W., Hansen, S. G., Barbosa, R. A., & Henriksen, A. (2014). Novel shear capacity testing of asr damaged full scale concrete bridge. Engineering Structures, 79, 365–374. doi:10.1016/j.engstruct.2014.08.027
- Schumacher, T., & Shariati, A. (2013). Monitoring of structures and mechanical systems using virtual visual sensors for video analysis: Fundamental concept and proof of feasibility. Sensors, 13(12), 16551–16564. doi:10.3390/s131216551
- Shahawy, M. A. (1995). Nondestructive strength evaluation of Florida bridges: Oakland, CA: SPIE.
- Shariati, A., Schumacher, T., & Ramanna, N. (2015). Eulerian-based virtual visual sensors to detect natural frequencies of structures. Journal of Civil Structural Health Monitoring, 5(4), 457–468. doi:10.1007/s13349-015-0128-5
- Shiotani, T., Aggelis Dimitrios, G., & Makishima, O. (2009). Global monitoring of large concrete structures using acoustic emission and ultrasonic techniques: Case study. Journal of Bridge Engineering, 14(3), 188–192. doi:10.1061/(ASCE)1084-0702(2009)14:3(188)
- Sofi, M., Lumantarna, E., Mendis, P. A., Duffield, C., & Rajabifard, A. (2017). Assessment of a pedestrian bridge dynamics using interferometric radar system ibis-fs. Procedia Engineering, 188, 33–40. doi:10.1016/j.proeng.2017.04.454
- Song, G., Gu, H., & Mo, Y.-L. (2008). Smart aggregates: Multi-functional sensors for concrete structures—A tutorial and a review. Smart Materials and Structures, 17(3), 033001. doi:10.1088/0964-1726/17/3/033001
- Song, Y.-Z., Bowen, C. R., Kim, A. H., Nassehi, A., Padget, J., & Gathercole, N. (2014). Virtual visual sensors and their application in structural health monitoring. Structural Health Monitoring, 13(3), 251–264. doi:10.1177/1475921714522841
- Strangfeld, C., Hindersmann, I., & Niederleithinger, E. (2021). Smart bridge: The durabast test bridge equipped with rfid-based sensors. Bridge maintenance, safety, management, life-cycle sustainability and innovations (pp. 2353–2358). Sapporo, Japan: CRC Press.
- Taylor, E. S., Barry, R., Cleland, J. D., & Kirkpatrick, J. (2007). Serviceability of bridge deck slabs with arching action. ACI Structural Journal, 104(1), 39.
- Tian, L., Zhao, J., Pan, B., & Wang, Z. (2021). Full-field bridge deflection monitoring with off-axis digital image correlation. Sensors, 21(15), 5058. doi:10.3390/s21155058
- Trias, A., Yu, Y., Gong, J., & Moon, F. L. (2021). Supporting quantitative structural assessment of highway bridges through the use of lidar scanning. Structure and Infrastructure Engineering, 1–12. doi:10.1080/15732479.2021.1880446
- Van Steen, C., Verstrynge, E., Wevers, M., & Vandewalle, L. (2019). Assessing the bond behaviour of corroded smooth and ribbed rebars with acoustic emission monitoring. Cement and Concrete Research, 120, 176–186. doi:10.1016/j.cemconres.2019.03.023
- Velázquez, B. M., Yura, J. A., Frank, K. H., Kreger, M. E., & Wood, S. L. (2000). Diagnostic load tests of a reinforced concrete pan-girder bridge (p. 121). Austin, TX, USA: The University of Texas at Austin.
- Wang, X., Taylor, P., Hosteng, T., & Phares, B. (2016). Evaluation and testing of a lightweight fine aggregate concrete bridge deck in Buchanan county, Iowa.
- Watson, D. (2019). Lidar assessment to monitor bridge response under live and dead loads (Master). University of Nebraska.
- Wilson, J. S. (2004). Sensor technology handbook. Oxford: Elsevier.
- Yang, Y., Hordijk, D., & De Boer, A. (2016). Acoustic emission measurement in the proof loading of an existing bridge affected by asred. ^eds. 5th International Symposium for Life-Cycle Civil Engineering.
- Yarnold, M., Golecki, T., & Weidner, J. (2018). Identification of composite action through truck load testing. Frontiers in Built Environment, 4, 74. doi:10.3389/fbuil.2018.00074
- Yoneyama, S., & Ueda, H. (2012). Bridge deflection measurement using digital image correlation with camera movement correction. Materials Transactions, 53(2), 285–290. doi:10.2320/matertrans.I-M2011843
- Zeiske, K. (2004). Surveying made easy. Heerbrugg, Switzerland: Leica Geosystems.
- Zhang, F., Zarate Garnica, G. I., Yang, Y., Lantsoght, E., & Sliedrecht, H. (2020). Monitoring shear behavior of prestressed concrete bridge girders using acoustic emission and digital image correlation. Sensors (Basel, Switzerland), 20(19), 5622. doi:10.3390/s20195622
- Zheng, J., Li, Q., Mao, R., Wang, Y., & Zhou, Z. (2020). Bridge vibration virtual sensor based on eulerian video magnification and gray mean difference. IOP Conference Series: Materials Science and Engineering, 964(1), 012026. doi:10.1088/1757-899X/964/1/012026