
 ?Mathematical formulae have been encoded as MathML and are displayed in this HTML version using MathJax in order to improve their display. Uncheck the box to turn MathJax off. This feature requires Javascript. Click on a formula to zoom.
Abstract
Taiga–tundra boundary ecosystems are affected by climate change. Methane (CH4) emissions in taiga–tundra boundary ecosystems have sparsely been evaluated from local to regional scales. We linked in situ CH4 fluxes (2009–2016) with vegetation cover, and scaled these findings to estimate CH4 emissions at a local scale (10 × 10 km) using high-resolution satellite images in an ecosystem on permafrost (Indigirka lowland, north-eastern Siberia). We defined nine vegetation classes, containing 71 species, of which 16 were dominant. Distribution patterns were affected by microtopographic height, thaw depth and soil moisture. The Indigirka lowland was covered by willow-dominated dense shrubland and cotton-sedge-dominated wetlands with sparse larch forests. In situ CH4 emissions were high in wetlands. Lakes and rivers were CH4 sources, while forest floors were mostly neutral in terms of CH4 emission. Estimated local CH4 emissions (37 mg m−2 d−1) were higher than those reported in similar studies. Our results indicate that: (i) sedge and emergent wetland ecosystems act as hot spots for CH4 emissions, and (ii) sparse tree coverage does not regulate local CH4 emissions and balance. Thus, larch growth and distribution, which are expected to change with climate, do not contribute to decreasing local CH4 emissions.
1. Introduction
The boundary ecosystem between taiga and tundra (i.e. forest-tundra ecotone) covers an area larger than 1.9 million km2 in the circumarctic region (Ranson et al., Citation2011). In this ecosystem, tree cover has expanded since the late 1800 s in north-western Alaska (for a distance of approximately >10 km) (Lloyd et al., Citation2002), and over recent decades in Siberia (Kravtsova and Loshkareva, Citation2013; Frost and Epstein, Citation2014), where further tree line shifts are predicted to occur according to climate response model studies (Skre et al., Citation2002; Soja et al., Citation2007; Tchebakova et al., Citation2009). Methane (CH4) is a potent greenhouse gas that contributes to approximately 20% of the radiative forcing attributed to anthropogenic-derived increase of greenhouse gas concentrations (Ciais et al., Citation2013; Myhre et al., Citation2013). The competition for landscape between wetland (source) and upland (sink) ecosystems would affect regional CH4 emissions regarding vegetation shifts (Callaghan et al., Citation2002; Harding et al., Citation2002). However, scenarios of vegetation shifts depend on whether the climate changes to dry or humid (e.g. Holtmeier and Broll, Citation2005). The change of forests to wetlands might occur with paludification or permafrost thawing in lowlands by changing the humidity and the frozen layer of the permafrost (Skre et al., Citation2002).
Montesano et al. (Citation2009) reported that the structure of the taiga–tundra boundary ecosystem is scale dependent in the studies using remote sensing, as a patchy forest or wetland can be observed with high-resolution data but cannot be seen with low-resolution data. Epstein et al. (Citation2004) reported two types of tree lines in Alaska: forest-shrub tundra transitions along mountain slopes, and abrupt forest-tussock tundra transitions associated with river floodplains. Such transitions between forest and tussock tundra or thermokarst wetlands generally correspond to drastic shifts from CH4 sinks to CH4 sources, which is largely regulated by environmental factors such as soil moisture (Sjogersten and Wookey, Citation2002; Morishita et al., Citation2003; Sjogersten and Wookey, Citation2009). However, previous studies on CH4 flux performed at local-regional scales have focussed on typical tundra or boreal forest ecosystems (e.g. Nilsson et al., Citation2001). Only a few studies have assessed the taiga–tundra boundary in Scandinavia (Sjogersten and Wookey, Citation2002, Citation2009), Hudson Bay Lowland (Roulet et al., Citation1994) and West Siberia (Flessa et al., Citation2008; Glagolev et al., Citation2011).
Land cover classification is often used to estimate the CH4 flux in arctic-subarctic regions, as the spatial patterns of both vegetation type and CH4 flux are controlled by soil moisture. In addition, CH4 flux is regulated by the functioning of plants via the production of substrates and transport from the soil to the atmosphere (Olefeldt et al., Citation2013; Strom et al., Citation2015; Davidson et al., Citation2016). Therefore, vegetation maps are useful tools for understanding the spatial patterns of CH4 emissions. Such maps are generated by land cover classifications for wetland vegetation and other plant categories, and they show spatial patterns in vegetation types at targeted spatial scales. Previous studies have usually applied vegetation mapping with in situ CH4 flux to estimate CH4 emissions in the typical tundra and taiga ecosystems of Siberia (e.g., Takeuchi et al., Citation2003; Schneider et al., Citation2009). Recent satellite images with high spatial resolution (i.e. WorldView-2 and Geoeye-1 with a resolution <2 m) provide a preferable mapping scale for the vegetation patch size (<30 m) (Virtanen and Ek, Citation2014) and water bodies (<4 m) (Muster et al., Citation2012) in the tundra ecosystem. Indeed, CH4 emissions on plot-scale were revealed using high-resolution vegetation mapping combined with observational CH4 fluxes and/or footprint models in the tundra ecosystem (Sachs et al., Citation2010; Parmentier et al., Citation2011a; Budishchev et al., Citation2014). Using high-resolution mapping for wetlands vegetation and water bodies, accompanied by in situ measurements of CH4 flux, emissions on regional and local scales can be estimated in the taiga–tundra boundary ecosystems.
The Indigirka lowland is an arctic floodplain in eastern Siberia, Russia. This lowland is characterised by very specific environmental conditions that include continuous permafrost, a tree distribution limit, and river lowlands. Ice-wedge polygons are one of the most common ground patterns of this ecoregion, representing the typical land surface structure in Indigirka lowland. These polygons were formed from a drained lake basin during a geologically recent event (ca. AD 1250–1325) (de Klerk et al., Citation2011). In this ecosystem, similar environmental conditions are widespread over a vast area of the Yana-Indigirka-Kolyma lowland in north-eastern Siberia (Troeva et al., Citation2010). The Indigirka lowland, particularly the nature reserve in the Kytalyk area (located on the left bank of the lowland), has been extensively studied to elucidate the response of a tundra ecosystem to climate change. For example, the impact of permafrost degradation on the growth of tundra shrubs (e.g. Betula nana) has been reported in this tundra ecosystem (Blok et al., Citation2010; Nauta et al., Citation2015). The study area used in this research (i.e. the middle of the Indigirka lowland) is sparsely covered by larch trees (a taiga–tundra boundary ecosystem), which grow on elevated mounds because of low soil moisture and nitrogen uptake (Liang et al., Citation2014). In recent years, an increasing number of invasive (expanded) species from more southern areas have been reported (Khitun et al., Citation2016), likely owing to the rising temperatures. Thus, the very specific nature of this environment, combined with continuous permafrost, the tree distribution limit and river lowlands, renders the ecosystems of this region potentially vulnerable to climate change.
In this study, we report (i) the relationship between the distribution of plant species and environmental factors along a microtopographic gradient, (ii) vegetation mapping using high-resolution satellite images on a 10 × 10 km local scale and (iii) in situ CH4 fluxes for various vegetation types associated with the dry-wet gradient during the summer growing season from 2009 to 2016 in a taiga–tundra boundary ecosystem (Indigirka River lowland, eastern Siberia, Russia). From these results, we aimed to determine (i) the effects of environmental factors such as distance from the rivers and permafrost conditions on vegetation, (ii) the CH4 emission on local and regional scales using a vegetation map with high-resolution satellite images in the taiga–tundra boundary ecosystem and (iii) its controlling factors on CH4 emissions. The distribution of the current vegetation under a scenario of global warming, which may lead to vegetation shifts in the future, was also noted.
2. Materials and methods
2.1. Study area
The study sites were located in the Indigirka lowland near Chokurdakh (70.6° N, 147.9° E), Republic of Sakha (Yakutia), Russia. The study area is located on continuous permafrost, with an active layer depth ranging from 20 to 50 cm. The landform is a generally flat floodplain surrounded by an upper terrace over 50 m above sea level (a.s.l.).
Our investigation focussed on the taiga–tundra boundary ecosystem – Kodac site (K) (70.56° N, 148.26° E) – over the Indigirka lowland (). In this ecosystem, vegetation consists of mosaic patterns of sparse larch (Larix cajanderi, syn. L. gmelinii) stands, with a maximum height of 10 m (the density of the trees above 2 m in height is 341 trees ha−1 at site K [Liang et al., Citation2014]), shrubs (Betula nana) and wetlands. The soil is characterised by high organic content in the surface layer and abundant ice lenses (Iwahana et al., Citation2014). Regularly structured ice-wedge polygons and lakes are often observed in this ecosystem.
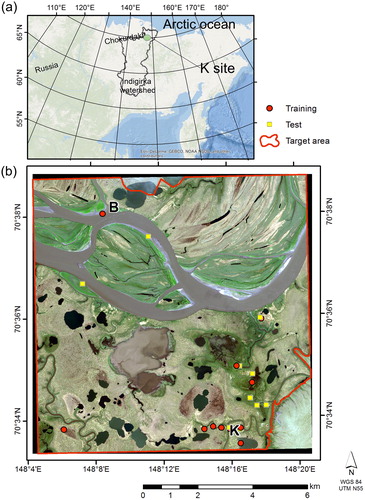
Fig. 1. (a) Regional and (b) Local position of the study site. The Indigirka lowland is located in the north area of the watershed (Google Maps). WorldView-2 satellite image covered an area of 10 × 10 km (true colour). The main branch of the Indigirka River lies in the upper part of the image. The locations of the Kodac site (K), B site (B), local surveyed plot for training (circle) and test pixels (rectangular) are plotted on the map. Each survey point contains 3–4 quadrats for vegetation surveys. Vegetation was mapped within a target area (red line) without hills and cloudy areas.
2.2. Relative elevation, thaw depth, and soil moisture
We defined a 50-m monitoring transect, which was composed of a 100 × 50 m survey plot at site K () with local survey points distributed throughout a 10 × 10 km area of the Indigirka lowland (). At site K, the relative elevation from the lowest base level was measured using a surveying telescope (AT-B4, TOPCON, Tokyo, Japan) at every 2.5 m point along a 50 m transect on 31 July 2012, and in 5 m grids at 231 points over the 100 × 50 m survey plot on 14 July 2013. In addition, we measured seasonal thaw depth (i.e. active layer depth) using a metal rod, and estimated frost table height by subtracting the thaw depth from the relative elevation over the same survey plot. Volumetric soil moisture was also measured using a portable moisture sensor (Trime-Como, IMKO, Ettlingen, Germany) between the surface and a depth of 8 cm, by performing four observations at every 5 m points along the monitoring transect at site K in mid July 2012, 2014 and 2015, as well as at 70 local survey points distributed throughout the 10 × 10 km area in the Indigirka lowland in mid July 2014.
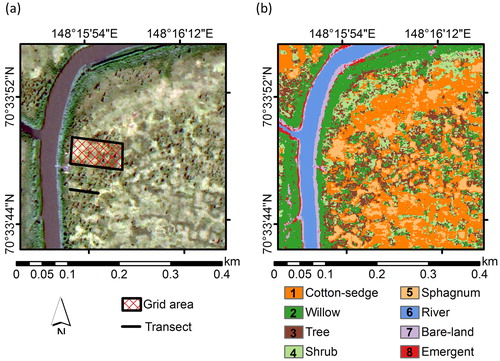
Fig. 2. (a) True colour image and (b) vegetation map showing nine vegetation classes on the site scale (400 × 400 m) at site K (Kodac). The lake class does not appear at this scale, and therefore the map was covered by eight classes only, as shown in (b).
2.3. Plant species composition
The spatial distribution of plant species was investigated at the 231 points sampled for relative elevation at site K on 14 July 2013. During sampling, a quadrat (0.5 × 0.5 m) was placed on fairly homogeneous and wide patches of vegetation, and dominant and rare plant species – including trees, shrubs, grasses, forbs and mosses – were recorded. Moss species were categorised into five groups (green-moss, green-moss/Sphagnum-dry mixed, Sphagnum-dry, Sphagnum-wet and moss-wet) according to the soil moisture condition, and contained several typical species and/or genera (Table S1). Close-range aerial photographs were taken by a commercially available radio-controlled unmanned aerial vehicle to confirm the extent of vegetation patches and to aid in training pixel selection (AR Drone 2.0, Parrot, Paris, France).
We also investigated the composition of plant species in the 70 quadrats used to measure soil moisture throughout the 10 × 10 km area in the Indigirka lowland in mid July 2014 (). We listed all plant species observed at site K, and over the Indigirka lowland, during the vegetation survey from 2013 to 2014. The names and taxonomic classifications of plant species were determined by referring to the circumpolar dataset of the Arctic Biodiversity Assessment (CAFF, Citation2013) and to a local dataset for Kytalyk (Egorova, Citation2013), 30 km north of Chokurdakh.
2.4. Site- and local-scale CH4 emissions
Methane flux was observed at 37 locations (212 flux measurements in total), using the chamber method during the growing seasons (July) of 2009 to 2016. The flux measurements were conducted in each vegetation type (see Section 2.6): (i) around site K (70.56°N, 148.26°E), (ii) around site B, which was located near the main flow of the Indigirka River (70.64°N, 148.15°E) and (iii) at additional points in the Indigirka lowland (including the lake, river and bare-land). The total numbers of replicates and the total days of observation in each vegetation type are presented in . For each sampling point, transparent chambers (diameter 25 cm, height 25 cm) were installed on the ground or on a floating panel, and headspace gas, which was sampled at 15-min intervals for 30 min (0, 15 and 30 min), was collected into 20-mL vacuumed vials. Linear correlation of headspace CH4 with time was conducted for each measurement of CH4 emissions, and R2 values of more than 0.95 occurred in most cases. These were used for the flux measurements, although closer and lower CH4 concentrations than the detection limit showed lower linear correlations.
Table 3. Methane emissions at the local scale were calculated using the observed CH4 flux, and the area of each vegetation class obtained from the vegetation map. In situ CH4 flux (230 observation in total) was observed from 3 July to 9 August 2009–2016. The sedge-dominated wetland contributes 70% of total emissions.
River CH4 flux (n = 18) was estimated using the ideal assumption of the transfer velocity method from the concentration of dissolved CH4 in river water. The transfer velocity method was used instead of the chamber method to overcome the limitations of CH4 flux data by using a floating chamber on the river water. The assumptions were checked to determine if both results fell within the same range.
River gas flux (Jg) is produced by the differences between gas concentrations in the river water (Cw) and the atmosphere (Ca), and CH4 transfer velocity (kCH4) was calculated based on the calculation in Striegl et al. (Citation2012), considering a median gas transfer velocity in the boreal Arctic zone (Aufdenkampe et al., Citation2011) and a temperature dependence function (Wanninkhof, Citation1992):
The dissolved CH4 concentration in the river water (Cw) was analysed using the headspace equilibration method. Details on our observations of river CH4 flux are provided in the Supplementary Material.
After sampling headspace gas extracted from the chamber and river water, samples were transported to the laboratory in Hokkaido University, Sapporo, Japan, and CH4 concentration was measured from the samples with a HP6890 gas chromatograph (GC) system (Hewlett Packard, Palo Alto, CA, USA) with a flame ionisation detector (FID) at a precision (i.e. standard deviation [SD]) of 0.3 ppm for 20-ppm standards. Therefore, the detection limit of flux was 4.6 mg m−2 d−1. The first phase of these measurements was mainly conducted on sedge and sphagnum wetland vegetation in 2009–13 (Shingubara et al., Citation2016). Newly obtained land-surface and river flux data collected in 2014–16 were then added to the data. Estimations of site- and local-scale CH4 emissions were performed according to the vegetation classification maps created from satellite imagery (see Section 2.7) obtained from 400 × 400 m (site scale) and 10 × 10 km (local scale) areas.
2.5. Vegetation classification based on plant species
We classified vegetation in the Indigirka lowland into nine categories for upscaling of CH4 emission over the region in the following three steps. In the first step, microtopographic vegetation classification was conducted. This classification was made based on the zonal distribution of vegetation (therefore plant species) in relation to micro-relief (which results in differences in soil moisture) and tree distribution (Liang et al., Citation2014). It is well known that soil moisture gradients cause differences in CH4 flux (Olefeldt et al., Citation2013). Therefore, this first step in the classification – on the microtopography – is considered to reflect gradients in CH4 emission. In the second step, plant species-based vegetation classes were delineated. This classification was made via plant species composition.
In the first step of vegetation survey at the site scale conducted along the 50-m transect at site K (), the vegetation was visually classified into four categories – tree, shrub, Sphagnum spp. and cotton-sedge – based on the dominant species at each measurement point. Trees and shrubs were generally observed on well-drained elevated mounds and slopes, and Sphagnum spp. and cotton-sedges were found in wet areas. Next, the four categories were classified via a clustering analysis, based on the similarities among plant species compositions. The Ward’s method (Maechler et al., Citation2017) – a bottom-up approach that produces the closest pair of data and aggregates data into larger groups – was applied for hierarchical agglomerative clustering using R software (R Core Team, Citation2017). At the site scale, we applied clustering analysis to 16 dominant vascular plant spices, and five groups of green-moss and Sphagnum spp., observed at site K (Table S1). We only used the dominant species of vascular plants and groups of moss species, as minor (rare) species were not accurately identified to the species level during the site vegetation survey in 2013. Based on the 16 vascular plant species and five groups of non-vascular plants, eight clusters (i–viii) were identified (Fig. S1) and compared with the microtopography classes ( and ). Significant differences in the relative elevation (see Section 2.3) of the eight clusters were statistically assessed by single factor analysis of variance (ANOVA) among clusters and t-tests between pairs of clusters, using MS Excel 2016 (Microsoft Corporation, Redmond, WA, USA).
Fig. 3. Vegetation, relative elevation (a) and soil moisture (b) along a 50-m transect. Soil moisture was measured as the averaged volumetric water content at the surface (0–8 cm) by time domain reflectance on 12 July 2012, 15 July 2014 and 12 July 2015. Sphagnum spp. and cotton-sedge areas are hatched to illustrate potential CH4 sources.
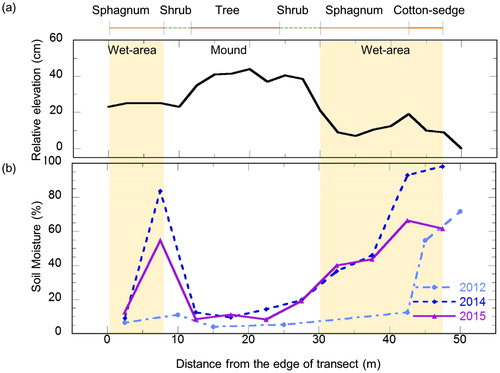
Table 1. Classes assigned by visual observation and final classes based on satellite image mapping. Plant species composition classes corresponding to microtopographies were categorised into six classes. Because of the similarity of species compositions, structures and spectral features of satellite images among the shrub-dry, shrub-wet and dry-tussock classes, and between the willow and alder classes, these classes were combined into the shrub class and the willow class, respectively. Bare-land, river and lake classes were added, whereupon the landscape was finally grouped into nine classes.
The larch tree (Larix cajanderi) is the only tall woody-type species found in the taiga–tundra boundary ecosystem and it was considered an independent category for the spatial variation in potential CH4 sinks. Therefore, the presence of L. cajanderi was emphasised to distinguish it from other plant species (see Fig. S1). For the other clustering processes, an equal distance of clustering similarity was applied.
To analyse the variation in plant community composition at a local scale, we used the 71 plant species observed in the local vegetation survey (Table S2) for the clustering analysis and identified 12 clusters (i–xii) (Fig. S2). Then, we further classified the 12 clusters into seven classes in the same manner used for the site-scale classification. Clusters were cross-validated with visual interpretation of each vegetation type and evaluated using purity and entropy. In an ideal cluster of a single category, purity is 1, and entropy is 0. Higher purity and lower entropy indicates better clustering results.
2.6. Vegetation classification based on satellite imagery
Land-cover classification surveys were conducted for 400 × 400 m (site scale) and 10 × 10 km (local scale) areas using WorldView-2 data (Digital Globe Co., Ltd., Westminster, CO, USA) collected on 9 July 2013, with eight spectral bands (2 m spatial resolution) and one panchromatic band (0.5 m resolution).
Satellite image calibration, correction and classification were performed using ENVI v5.1 (Exilis Visual Information Solutions, Broomfield, CO, USA) and were mapped with ArcGIS v10.2 (Environmental Systems Research Institute, Redlands, CA, USA).
Image classifications were performed using a combined method of maximum-likelihood classification (MLC) and decision-tree classification (DTC). The MLC-DTC method was supervised by the data for plant species-based vegetation classification described in the previous section. In situ observation points () for plant species composition were transferred from pan sharpening 0.5 m resolution images into 27,896 pixels, which were carefully selected homogeneous and uniform areas for optimal targeting. Among those, 17,113 training pixels were used for supervision and 10,783 test pixels were used for evaluation, and then reflectance features of training pixels were confirmed to distinguish vegetation classes (Fig. S4). Details of the MLC-DTC method is presented in the Supplementary Material (see Text S1.2, Figure S3). In addition, we compared the classification of the MLC-DTC method to three different methods, namely spectral information divergence (SID), simple MLC, and simple DTC, to decide the optimal classification method (Text S1, Table S5) and to select the most appropriate method for accurate classification. We compared the results with satellite-based data and used it for the classifications (see Supplementary Materials Text S1).
To validate classification methods, classification results of test pixels (10,783 pixels) in each method () were compared, and the overall accuracy and kappa statistics (Congalton, Citation1991) were calculated. The MLC-DTC method showed the highest accuracy and was, therefore, the optimal method for classifying vegetation distribution at our site (Table S5). Therefore, the precision of MLC-DTC classification for each class (Table S6) was based on test pixels using a confusion matrix, which is a list showing the number of pixels classified into each class. The confusion matrix shows the producer accuracy (PA) of test pixels of a given class (the percentage of the number of pixels that were correctly classified into the class) and the user accuracy (UA) of test pixels classified into a class (the percentage of the number of pixels that were correctly classified into the class).
3. Results
3.1. Relative elevation, thaw depth, and soil moisture
Micro-relief elevation was approximately 40 cm in the 50-m transect, where each topographic position was covered by characteristic vegetation (). Soil moisture was high (12–98%) at low elevations (0–25 cm), where Sphagnum sp. mosses and sedges were found. Cotton-sedge was present in the lowest and wettest areas. In contrast, soil moisture was low (3.8–40%) at higher elevations (35–44 cm), where larch trees and shrubs were found. Based on these results, we defined the following four classes of plants: tree, shrub, Sphagnum spp. and cotton-sedge (). Trees and shrubs included Larix cajanderi, B. nana and Vaccinium uliginosum, which were found on microtopographic mounds. In comparison, Sphagnum spp. and cotton-sedges (including Carex aquatilis and Eriophorum angustifolium) were located in wet microtopographic depressions.
3.2. Plant species-based vegetation classification
In this study, we found 71 plant species at K, including 60 vascular plants and 11 species of mosses (Table S2). Most species observed were from the families Poaceae (nine species) and Ericaceae (eight species), but species from the families Cyperaceae (seven species) and Salicaceae (seven species) were also abundant. Many of the species observed are boreal-hypoarctic species that occur in the taiga and southern part of the tundra within the arctic Siberian region (e.g. Egorova, Citation2013), such as the shrubs B. nana and Salix pulchra; the heaths V. uliginosum, Vaccinium vitis-idaea and Ledum decumbens; and the sedges C. aquatilis subsp. stans and Eriophorum vaginatum. Among the observed species at site K, dominant vascular plants and mosses were used for clustering at the site scale analysis, while all plant species were used for clustering at the local scale analysis.
For the site scale analysis, eight clusters (i–viii) were identified (Fig. S1 and Table S1). Based on the clustering results, the vegetation was subsequently classified into four classes. Cluster (i) was classified as tree class; clusters (ii) and (iii) were classified as cotton-sedge and Sphagnum spp. classes, respectively; and clusters (iv)–(vii) were classified as shrub class, with clusters (iv) and (v) being shrub-dry and clusters (vi) and (vii) being shrub-moist vegetation. Cluster (viii) was also classified as shrub class and was placed in the dry-tussock vegetation.
At the local scale, we identified 12 clusters (i–xii) (Fig. S2 and Table S2). We further classified these 12 clusters of vegetation into seven vegetation classes, similar to that performed at the site scale analysis. Clusters (i), (ii) and (iii), which include trees (Larix cajanderi) with different understories, were classified into the tree class. Clusters (iv) and (v) were characterised by evergreen shrubs (e.g. Dryas octopetala) and grass-type plants (e.g. Poa sp. and Luzula confusa), respectively, and were classified into the lichen-heath class. Clusters (vi) and (vii) were characterised by deciduous shrubs (e.g. B. nana) and therefore were classified into the shrub class. Clusters (viii) and (ix) were classified as willow vegetation. These clusters were dominated by alders (Alnus viridis ssp. fruticosa syn. A. fruticosa) and upright-type willows (e.g. Salix boganidensis, Salix richardsonii and Salix alaxensis), and their canopies were higher than that of plants in the shrub class; moss species were also included. Soil moisture conditions for this vegetation were similar to those of the shrub class (Table S2). Cluster (x) was classified into the emergent class, which was characterised by emergent aquatic species (e.g. Arctophila fulva and Carex chordorrhiza) and by wet soil conditions with a water table sometimes higher than ground level. Clusters (xi) and (xii) were characterised by sedges (e.g. Carex spp. and Eriophorum spp.) and Sphagnum spp. (e.g. Sphagnum squarrosum), and were classified into the cotton-sedge and Sphagnum spp. classes, respectively. Cross-validated purity (0.76) was high and entropy (0.24) was low in the hierarchical clustering.
Although clusters grouped by plant species were classified into four classes at the site scale and seven classes at the local scale, the corresponding classes exhibited similar species compositions, with common dominant species between both site and local classifications (Tables S1 and S2). Therefore, similar vegetation classes within the site and local classifications were combined into one class, and a total of six classes was obtained (). According to these results, classes based on plant species composition were assigned to a mapping definition, although the lichen-heath class (which was observed on hilly slopes 50 m a.s.l. at a local scale) was excluded from further analyses, as the focus of the present study was on CH4 emissions in lowland ecosystems.
3.3. Vegetation mapping and accuracy assessment with satellite data-derived classification
We finally created a vegetation map with reflectance features for the Indigirka lowland based on nine plant species-based vegetation classification classes following the MLC-DTC method, which had the highest overall accuracy (85%) and kappa statistics (0.83) (Table S5). The accuracy was similar to the recently reported range for land cover classifications on similar permafrost landscapes in Canada, also created using WorldView-2 satellite images (Chasmer et al., Citation2014). In our study, producer accuracy (PA) and user accuracy (UA) for the tree, shrub, and willow classes indicated that the classification was not successful (Table S6); however, these misclassifications – tree or shrub confused with willow – did not affect the estimation of local CH4 emissions in practice, as these classes exhibited no CH4 emissions (see Section 3.5). In contrast, the high PAs of the Sphagnum spp., cotton-sedge and emergent classes – from which CH4 fluxes were substantially high – provided confidence in the estimation of local CH4 emissions, although a small degree of error is expected due to possible misclassifications. Although the misclassification between the cotton-sedge and Sphagnum spp. classes was only approximately 10%, a larger error is expected in local estimations because of the differences in CH4 flux (2.9 times higher in the cotton-sedge class than in the Sphagnum spp. class) and relatively large coverage area of the cotton-sedge class. Such error is also expected from the misclassification of the emergent class to the willow class (Table S6) due to differences in CH4 flux; however, the error should be small due to the small coverage area of the emergent class in our study area. The accuracy of the classification system is discussed in Supplementary Material (Text S1).
On the site-scale vegetation map of the Kodac site (K) at the 400 × 400 m area (), only eight vegetation classes could be discerned, as no lake class exists at the site scale. The cotton-sedge and willow classes were dominant, with 28% and 22% coverage, respectively, while the Sphagnum spp. class exhibited low coverage (9.1%), and the tree class displayed intermediate coverage (14.2%) (). This site-scale vegetation map showed that each vegetation class was distributed close to the others (). Similar patterns were also observed along the transect (), where vegetation zoning was observed ().
Table 2. Area and coverage of classification at the site scale (400 × 400 m).
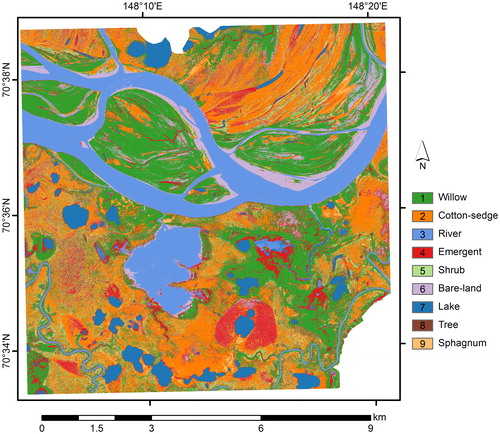
The local-scale map covers the main flow of the Indigirka River, its floodplain and the Kodac site (K) (). The largest area (27%) was covered by the willow class, followed by the cotton-sedge class (23%) (). The river and emergent classes on the local-scale map exhibited higher coverage (15% and 9.5%, respectively) than on the site-scale map (7.9% and 2.2%, respectively). In comparison, the tree and shrub classes, which are typically found at elevation, exhibited lower coverage on the local-scale map (4.1% and 1.9%, respectively) than on the site-scale map (14% and 13%, respectively). The Sphagnum spp. class also exhibited low coverage on the local-scale map (1.9%).
Fig. 4. Vegetation map showing the nine classes at the local scale (10 × 10 km) obtained by the MLC-DTC (maximum-likelihood classification and decision tree classification combined) method.
3.4. CH4 emissions from vegetation classes and at the local-scale in the taiga–tundra boundary
The cotton-sedge and emergent classes exhibited the most substantial CH4 emissions, with an average and SE of 114 ± 11 mg m−2 d−1 and 96 ± 29 mg m−2 d−1, respectively (, ). The Sphagnum spp. class exhibited lower emissions (38 ± 9 mg m−2 d−1) than the other wetland classes (i.e. cotton-sedge and emergent). In contrast, we detected a slight CH4 sink with average fluxes in the tree class (forest floor) and bare-land class (−0.1 ± 0.2 mg m−2 d−1 and −3.4 ± 2.2 mg m−2 d−1, respectively), and slight emissions in the shrub and willow classes (0.8 ± 0.7 mg m−2 d−1 and 0.3 ± 0.3 mg m−2 d−1, respectively), although these values were below the detection limit of our chamber method (<4.6 mg m−2 d−1).
Fig. 5. In situ CH4 flux measured by the chamber method in 2009–2016 during the summer growing season (3 July–9 August 2009–16, n (total) = 230). Only river CH4 flux was derived from dissolved CH4 concentration using the diffusive fraction with the transfer velocity method. Details are shown in Text S1 and Fig. S7.
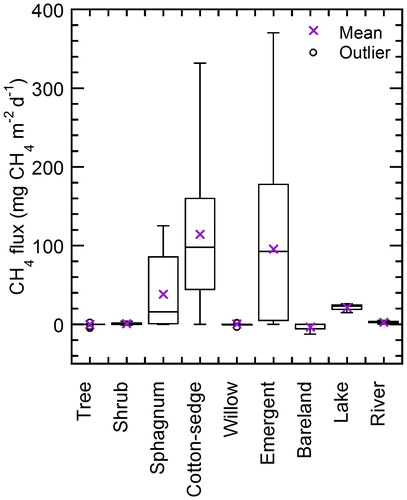
The lake class also emitted substantial quantities of CH4 (21 ± 3.4 mg m−2 d−1), using direct measurement by a floating chamber, whereas the river class emitted 2.6 ± 0.3 mg m−2 d−1 of CH4, which was estimated using dissolved CH4 concentrations (Fig. S7) oversaturated 20 to 51 times against the atmospheric equivalent, where the measured values were slightly higher than the detection limit (1.66 mg m−2 d−1).
Local CH4 emissions were estimated from the scaling of different flux rates in in situ chamber measurements (, ) to a local scale using a vegetation map (, ). The overall summary of monthly local emissions in the study area was 111 × 106 g CH4 month−1 during the growing season (July) from 2009 to 2016. The average ± SE CH4 flux was 37 ± 10 mg m−2 d−1 at the local scale, and 38 ± 9 mg CH4 m−2 d−1 at the site scale.
4. Discussion
4.1. Classification scheme of vegetation mapping for estimation of local CH4 emissions
In this study, we applied the MLC-DTC method based on plant species composition and reflectance features. In this way, shrublands and sedge wetlands – which are generally the dominant types of vegetation in arctic and subarctic regions (cf. Bartsch et al., Citation2016) – were classified into shrub, willow and cotton-sedge classes. We distinguished willow and shrub classes because of their differences in terms of species composition (, Table S1), vegetation heights (Table S2) and reflectance (Fig. S5). Upright-type willows (S. boganidensis, S. richardsonii and S. alaxensis) and alder (all approximately 2 m in height) composed tall and dense patches of willow class species, which were clearly different from that of the shorter shrub class. Previous studies frequently treated the Sphagnum spp. and emergent classes as a sub-category of another wetland category (Flessa et al., Citation2008; Schneider et al., Citation2009; Sjogersten and Wookey, Citation2009; Glagolev et al., Citation2011); however, in the present study, these classes were separated due to their very different CH4 emission rates. The emergent vegetation was characterised by emergent aquatic species in a shallow water body (e.g. A. fulva) ( and Table S1), which have been recognised for their important contribution to regional CH4 emissions in Alaska (Andresen et al., Citation2017).
The distribution of vegetation primarily corresponds to microtopography and soil moisture features (), relating to the seasonal thaw depth (i.e. active layer depth) and the frost table (Fig. S6, Table S3). Therefore, assuming that vegetation mapping could be used as an indicator of these environmental factors, this classification could be potentially applied to the upscaling of CH4 emissions and to other biogeochemical and hydrometeorological processes, such as biomass, net ecosystem exchange and snowpack distribution controlled by vegetation and microtopography. However, for this vegetation mapping to be widely applied, the accuracies of the classifications of the tree, shrub and willow classes need to be improved.
4.2. Vegetation coverage affected by microtopography regarding permafrost and hydrological conditions
Our mapping provided the spatial distributions of vegetation classes at a local scale (), showing that the willow, cotton-sedge and river classes covered large fractions of the landscape of the Indigirka River lowland (). The willow class, covering 26.8% of the landscape at the local scale, was typically documented along and/or surrounding the main stream of the Indigirka River. Willows generally form pure willow stands, with a height ranging from 0.5 m to 3 m (2 m on average, Table S2), are thought to reproduce vegetatively, and display dense green leaves, as revealed in the reflectance measurements (Fig. S5). Previous research has shown that willow growth is controlled by thaw depth, especially in regions of continuous permafrost (Pajunen, Citation2009; Fan et al., Citation2018). It has also been reported that the structure and productivity of willow communities differs between several successional stages, which are affected by erosion and deposition from flooding events (Schickhoff et al., Citation2002). Therefore, we assumed that the extensively distributed willow class could be maintained by river flooding and by the wide spread effects of disturbance. This hypothesis is supported by the relatively large fractions of the river class and flat topography of this area. At the regional scale, expanding tall shrubs (alder) and increasing willow growth, which might be affected by climate change, have been observed in the Siberian Arctic (Forbes et al., Citation2010; Frost and Epstein, Citation2014; Fan et al., Citation2018). These growing trends might lead to the replacement of other types of wetland vegetation by willows, and, because there is insignificant CH4 emission in willow stands, the extensive coverage of willow-dominated vegetation could exert a substantial impact on the local CH4 emissions of the taiga–tundra boundary.
In the present study, the second largest area was covered by the cotton-sedge (22.7%) class and the fifth largest area by the emergent (9.5%) class, which exhibited higher coverage at the local scale than at the site scale (). Both classes were often located substantially far away from the main branch of the river on the local vegetation map (). Although the cotton-sedge and emergent classes sometimes formed pure patches, they were mostly adjacent to the Sphagnum spp., shrub and willow classes, as described for vegetation mapping.
These mixed vegetation patches were also observed at site K and were explained by the effect of vegetation zoning on microtopography along the transect (). At site K, where relatively drained polygon mires were recorded without open water ponds, the cotton-sedge class was located in the lowest and wettest position ( and Fig. S5). The second lowest position was covered by Sphagnum spp. (), which covers only a relatively small percentage (1.9%) of the local-scale map, and includes Sphagnum balticum and S. squarrosum, thereby indicating the humid environment of a bog or poor fen (transitional mire) (Nicholson et al., Citation1996). Although Sphagnum spp. patches were often observed at site K (), this class covered a small portion of the local area vegetation map (). These characteristics of site K could be explained by the relatively later stage of polygon development, where higher positions of the polygon were uplifted by underground ice growth and provided well-drained habitats for Sphagnum spp. and other mosses (de Klerk et al., Citation2011).
The tree and shrub classes, which characterise the northern limit of the taiga, exhibited patchy distributions and were located far from the main branch of the river () and from sites along the tributaries in the lowland (). The well drained, and higher position of polygon mires, which were approximately at 20–40 cm higher ground than the surrounding wetland, provides a suitable habitat for larch trees, according to on site observations ( and Fig. S5). Another possible explanation for the topography of tree mounds () is that fluvial relief features, such as the natural levees of former river channels (Sidorchuk and Matveev, Citation1994; Sidorchuk et al., Citation2000), which contributed to the formation of mounds with geomorphologically narrow shapes, were located parallel to the present river channel (Fig. S8). At present, the conditions required for the survival of trees are regulated by the topography of the taiga–tundra boundary, and it is unknown whether the areas of tree mounds are changing or not.
The subsurface permafrost table is an important structural feature that helps maintaining a higher relative elevation with a shallower thaw depth on tree-mounds than on wetlands (Fig. S6, Table S3). The higher frost table and higher ridge/mound structures of tree mounds provide drainage conditions for larch roots, thus preventing water logging. Well-drained soil also suppresses CH4 production and emission, as almost no CH4 emissions were observed in the tree and shrub classes (). It is interesting that the shallower thaw depth suited to larch growth, as shown in the present study, starkly contrasts with the deeper thaw depth observed along river banks, which are suitable habitats for white spruce growth in the forest-tussock tree lines of the tundra in Alaska, as both correspond to the low moisture of hydrological processes (Epstein et al., Citation2004). The regional characteristics of tree distribution in the eastern Siberian lowland might contribute to an ecosystem that is seriously vulnerable to climate change, as the elevation of the subsurface permafrost table – which could be strongly affected by recent increases in global temperatures – is one of the most important factors affecting suitable larch habitats.
4.3. Factors controlling local CH4 emissions in the taiga–tundra boundary
Local CH4 emissions were estimated from the scaling of the average values of fluxes in in situ chamber measurements (, ) multiplied by each vegetation class coverage (, ). These values were higher than regional estimations for the tundra (10.3 mg m−2 d−1, Schneider et al., Citation2009; 20.6 mg m−2 d−1, Sachs et al., Citation2010) of eastern Siberia, and lower than the regional estimations for the arctic Swedish mires (89.8 mg m−2 d−1, Nilsson et al., Citation2001) and boreal wetlands (59.4 mg m−2 d−1) in western Siberia (Takeuchi et al., Citation2003). Regional differences in the up-scaling of CH4 emissions might reflect differences in vegetation types, as well as the coverage of land cover types.
This up-scaling showed that the monthly CH4 flux of the cotton-sedge class was 78 × 106 g CH4 month−1 and contributed 70% of the total local CH4 emissions. The areas of the other CH4 sources (i.e. the emergent, lake, Sphagnum spp. and river classes) were smaller, and they contributed less to local CH4 emissions (25%, 2.8%, 1.9% and 1.1%, respectively). In this study, wetland areas (including the cotton-sedge, emergent and Sphagnum spp. classes) covered 38% of the total target area, which is relatively intermediate in comparison to the wetlands (in general) of other studies in the Arctic river lowland (66.6% in the region of the Lena delta; 13.8% at an island site in the Lena delta; and 41.4% in West Siberia) (Takeuchi et al., Citation2003; Schneider et al., Citation2009; Sachs et al., Citation2010). Generally speaking, higher proportions of wetland area might lead to higher CH4 emissions in a given landscape. However, in a regional study of the Lena delta, the highest degree of wetland coverage did not cause larger CH4 emissions as a result of lower CH4 fluxes (58.4–16.8 mg m−2 d−1) in wet and moist vegetation classes (Schneider et al., Citation2009). Lower CH4 fluxes in the Lena delta were caused by the limitation of the distributions of sedge-dominant vegetation patches in the tundra region, which were too small to scale up with the 30 m resolution of Landsat Images (Schneider et al., Citation2009). Differences in the scale of mapped resolutions renders regional comparisons of estimated CH4 emissions difficult. Therefore, the definition of each vegetation class, which is usually limited by the spatial resolution of satellite imagery, is important for improving local to regional estimates of CH4 emissions. The Indigirka lowland is heavily covered by cotton-sedge wetlands, which are part of a heterogeneous landscape, and which emit a large amount of CH4, as described in Section 3.2. Thus, it is necessary to fill the gap between different scales and resolutions, as well as that between the different classification schemes that are applied to upscaling, to analyse regional differences in ecosystems and CH4 emissions.
The average fluxes in the cotton-sedge (114 ± 11 mg m−2 d−1) and emergent (96 ± 29 mg m−2 d−1) classes obtained here were nearly identical to the flux observed in the Lena delta tundra wetland in Eastern Siberia (94.1 mg m−2 d−1) (Sachs et al., Citation2010) and in the tall sedge in the arctic Swedish mire (104.8 ± 59.2 mg−2 d−1, Nilsson et al., Citation2001). The flux in Sphagnum spp. (38 ± 9 mg m−2 d−1) was approximately half of the average flux for cotton-sedge wetlands. Although the value reported here was lower than the flux values obtained for Sphagnum spp. cover in the Kytalyk tundra region (98 ± 74 mg CH4 m−2 d−1), similar differences in CH4 flux between Sphagnum spp. and sedge wetlands – possibly caused by methanotrophic bacterial oxidation – have been previously reported (Parmentier et al., Citation2011b). Thus, the spatial differences in flux related to vegetation were successfully captured by our field observations.
Our observations were conducted on the warmest month (July), usually 3–4 weeks after snowmelt, because we wanted to determine the mean flux during the peak growing season. Therefore, the CH4 flux recorded almost reflected the peak emission. There was a large inter-annual variation, which possibly depends on precipitation and soil moisture, as has been reported in the Arctic (Mastepanov et al., Citation2013). Therefore, monitoring of the temporal variations in CH4 emissions with simultaneous meteorological factors is necessary to obtain further reliable estimations in the region.
The discrepancies in the reported flux values suggest that the use of the manual chamber measurement method might cause potential biases. The accuracy and repeatability of in situ flux estimations may vary with chamber closure duration, sampling intervals, and chamber size and settings, and, therefore, the flux obtained by the manual chamber method may differ from that obtained by the continuous automatic chamber method that has more frequent intervals and shorter closure times (Mastepanov et al., Citation2013). The manual and automatic methods also differ in terms of practical applicability, particularly when used for simultaneous measurements in many locations. Thus, the method used for and the objective of flux measurements have to be take into account when comparing flux rates.
Furthermore, the CH4 flux attributed to the river class has been less frequently reported than that in wetland vegetation systems for the whole circumarctic region. The estimated river CH4 flux in the downstream region of the Indigirka was 2.5 ± 1.1 mg m−2 d−1 in the present study, which was two times lower than the CH4 flux observed in the Kuparuk River (6.24 mg CH4 m−2 d−1) (Kling et al., Citation1992) and the Middle Yukon River (5.76 mg CH4 m−2 d−1) (Striegl et al., Citation2012) in Alaska. In contrast, river CH4 emissions were considered to be zero in the Lena river delta (Schneider et al., Citation2009), as dissolved CH4 concentrations were below the detection limit (<0.015 μmol L−1) due to dilution by sea water (Semiletov et al., Citation2011). Regional differences in river CH4 between the Lena river delta and the Indigirka downstream region could be explained by differences in water sources and factors related to geomorphology (i.e. stream order), as observed by Campeau and del Giorgio (Citation2014) and Campeau et al. (Citation2014).
Our lake CH4 flux (23 mg m−2 d−1) was higher than that of rivers, but within the range of the diffusive and ebullition CH4 fluxes (10.7 and 46.9 mg CH4 m−2 d−1, respectively) from thermokarst lakes with organic rich Edoma-type sediment in the Kolyma lowland (Walter et al., Citation2006). However, we did not consider the ebullition fraction of CH4 emission, which could contribute from 10 to 90% of the total emissions from the surface of lakes in high latitudes, depending on the amount of organic matter in the sediment (Walter et al., Citation2006; Bastviken et al., Citation2011; Matveev et al., Citation2016). As the lakes observed in our study might be water-filled lakes (Marsh and Hey, Citation1989; Emmerton et al., Citation2007), the ebullition fraction could be lower than that previously documented by Walter et al. (Citation2006), due to a lack of organic rich Edoma-type sediments under alluvial deposits.
Contrary to expectation, there was no significant CH4 sink in the forest floor of the tree class (Fig. 6). In Siberia, forest CH4 sink via microbial oxidation is affected by the tree species (Menyailo et al., Citation2010) and soil conditions related to the presence or absence of permafrost (Flessa et al., Citation2008). Both conditions are expected to exist in a larch forest with continuous permafrost, resulting in a smaller degree of CH4 oxidation in comparison to other boreal forests. Indeed, the net CH4 flux data for an eastern Siberian larch forest floor was estimated at −1.55 to −34 μg C m−2 h−1 (Morishita et al., Citation2003; Takakai et al., Citation2008; van Huissteden et al., Citation2008; Desyatkin et al., Citation2009), which was smaller than the CH4 oxidation values reported for western Siberian birch-spruce-pine mixed forest (−60 to 0 μg C m−2 h−1) (Flessa et al., Citation2008) and birch forest (−280 to −92 μg C m−2 h−1) (Nakano et al., Citation2004). This effect also supports the regional CH4 balance in boreal forest, although the net CH4 uptake by the forest floor could only be 1–10% of the wetland flux (e.g. Morishita et al., Citation2003; Desyatkin et al., Citation2009). Although the CH4 sink in our study (−0.1 ± 0.2 mg CH4 m−2 d−1) was less than that in the referenced data, it is not significant because the differences in the average flux values in our study area ranged from 37.0 to 37.4 mg CH4 m−2 d−1 at the local scale and 37.8 to 38.2 mg CH4 m−2 d−1 at the site scale. From this perspective, the larch forest of the taiga–tundra boundary on a permafrost ecosystem might not currently have the potential for CH4 balance, as the present fraction of tree cover is small compared to that of sedge and emergent wetland vegetation.
Settele et al. (Citation2014) illustrated that the boreal-tundra biome has gradually shifted across temperature and moisture gradients, and this is facilitated by fire disturbance, permafrost thawing, insect disturbance and drought stress. Indeed, summer temperature is positively correlated with increasing normalised difference vegetation index (NDVI) and tree ring width from 1938 to 2007 in NE Siberia (Berner et al., Citation2013) and tree-ring width from 1951 to 2012 at the same site (Tei et al., Citation2017), whereas a multidecadal regime of decreasing summer precipitation might have been reducing tree ring growth in this region from 1990 to 2012 (Tei et al., Citation2017). However, under the current conditions in the Indigirka lowland, changes in forest disturbance and mortality related to permafrost thaw and other factors were not obvious and the abundance of trees seems to be more closely linked to soil moisture and permafrost conditions across different microtopographies and landscapes.
The present study demonstrates the relative importance of spatially heterogeneous wetland emissions, which could provide fundamental data based on current sampling. We captured the spatial distribution of vegetation in the taiga–tundra boundary where tree expansion or mortality is expected. Wetland expansion and permafrost thaw have been mentioned as triggers for landscape-level CH4 dynamics in the Arctic (Johansson et al., Citation2006; Lara et al., Citation2015). At the same time, an increasing trend of forest greenness in northern Siberia has been reported through remote sensing observations (Frost and Epstein, Citation2014; Loranty et al., Citation2016). However, the increasing trend was not necessarily correlated with accelerated trend of tree radial growth (Berner et al., Citation2013; Tei et al., Citation2017). The authors reported that trend in tree radial growth depended on not only temperature but also precipitation regimes even in Arctic region. In recent decades, young larch trees and species from adjacent bioclimatic regions have been reported in this area (Khitun et al., Citation2016), indicating that it might be possible to change the ecosystem structure at the species level, and also the ecosystem function at the landscape level. The larch tree and shrub classes had close to zero CH4 sink in this study, suggesting the weak ability of forests in the boundary ecosystem to oxidise CH4 compared to a mature boreal forest. In contrast, the cotton-sedge, emergent and Sphagnum spp. classes of wetlands were substantial CH4 sources, similar to those in typical arctic tundra systems. The dynamics of the spatial distribution and CH4 flux of the vegetation classes could be key for understanding local-regional responses to climate feedback. Therefore, CH4 emissions at the taiga–tundra boundary should be monitored.
5. Concluding remarks
High-resolution satellite imagery provided a microtopographic level vegetation map, based on field observations, for upscaling local CH4 emissions. The taiga–tundra boundary ecosystem of the Indigirka River lowland is covered by a high proportion of wetlands (cotton-sedge and emergent classes), resulting in larger local CH4 emissions than that in the tundra located in the same region in north-eastern Siberia. Results from site- and local-scale vegetation mapping, validated by detailed field observations, indicated that site-scale hydrological conditions and geomorphological structures with rivers and permafrost could explain vegetation distribution patterns. High-resolution satellite images are indispensable for assessing local CH4 emissions because of the highly heterogeneous vegetation and spatially varied CH4 flux. Our findings indicate that tree distribution was spatially limited to small microtopographic elevations, and that forest CH4 sink might not provide enough uptake to create a local balance in the taiga–tundra boundary lowland.
Acknowledgements
We would like to thank the Institute for Biological Problems of Cryolithozone, Siberian Branch of the Russian Academy of Sciences, the Allikhovsky Ulus Inspectorate of Nature Protection for fieldwork support, and Drs. A. Isaev, V. Zakharova, A. Egorova, E. Ignatova and A. Efimova for plant identification. The WorldView-2 data were commercially provided by Digital Globe (https://www.digitalglobe.com).
Disclosure statement
No potential conflict of interest was reported by the authors.
Additional information
Funding
References
- Andresen, C. G., Lara, M. J., Tweedie, C. E. and Lougheed, V. L. 2017. Rising plant-mediated methane emissions from arctic wetlands. Global Change Biol. 23, 1128–1139. doi:10.1111/gcb.13469
- Aufdenkampe, A. K., Mayorga, E., Raymond, P. A., Melack, J. M., Doney, S. C. and co-authors. 2011. Riverine coupling of biogeochemical cycles between land, oceans, and atmosphere. Front. Ecol. Environ. 9, 53–60. doi:10.1890/100014
- Bartsch, A., Hofler, A., Kroisleitner, C. and Trofaier, A. M. 2016. Land cover mapping in northern high latitude permafrost regions with satellite data: achievements and remaining challenges. Remote Sens. 8, 979. doi:10.3390/rs8120979
- Bastviken, D., Tranvik, L. J., Downing, J. A., Crill, P. M. and Enrich-Prast, A. 2011. Freshwater methane emissions offset the continental carbon sink. Science 331, 50. doi:10.1126/science.1196808
- Berner, L. T., Beck, P. S. A., Bunn, A. G. and Goetz, S. J. 2013. Plant response to climate change along the forest-tundra ecotone in northeastern Siberia. Global Change Biol. 19, 3449–3462.
- Blok, D., Heijmans, M., Schaepman-Strub, G., Kononov, A. V., Maximov, T. C. and co-authors. 2010. Shrub expansion may reduce summer permafrost thaw in Siberian tundra. Global Change Biol. 16, 1296–1305. doi:10.1111/j.1365-2486.2009.02110.x
- Budishchev, A., Mi, Y., van Huissteden, J., Belelli-Marchesini, L., Schaepman-Strub, G. and co-authors. 2014. Evaluation of a plot-scale methane emission model using eddy covariance observations and footprint modelling. Biogeosciences 11, 4651–4664. doi:10.5194/bg-11-4651-2014
- CAFF. 2013. ABA 2013 Appendix 9.1–List and Distribution of All Arctic Vascular Plants. eds. F. J. A. Daniels, L. Gillespie and P. Michel. Conservation of Arctic Flora, Iceland. Online at: http://abds.is/publications/doc_download/134-aba-2013-appendix-9-1
- Callaghan, T. V., Crawford, R. M. M., Eronen, M., Hofgaard, A., Payette, S. and co-authors. 2002. The dynamics of the tundra-taiga boundary: an overview and suggested coordinated and integrated approach to research. Ambio, 3–5, (Special Issue 12).
- Campeau, A. and del Giorgio, P. A. 2014. Patterns in CH4 and CO2 concentrations across boreal rivers: major drivers and implications for fluvial greenhouse emissions under climate change scenarios. Global Change Biol. 20, 1075–1088. doi:10.1111/gcb.12479
- Campeau, A., Lapierre, J. F., Vachon, D. and del Giorgio, P. A. 2014. Regional contribution of CO2 and CH4 fluxes from the fluvial network in a lowland boreal landscape of Quebec. Global Biogeochem. Cycles 28, 57–69. doi:10.1002/2013GB004685
- Chasmer, L., Hopkinson, C., Veness, T., Quinton, W. and Baltzer, J. 2014. A decision-tree classification for low-lying complex land cover types within the zone of discontinuous permafrost. Remote Sens. Environ. 143, 73–84. doi:10.1016/j.rse.2013.12.016
- Ciais, P., Sabine, C., Bala, G., Bopp, L., Brovkin, V. and co-authors. 2013. Carbon and other biogeochemical cycles. In: Climate Change 2013: The Physical Science Basis. Contribution of Working Group I to the Fifth Assessment Report of the Intergovernmental Panel on Climate Change. Cambridge University Press, Cambridge, UK, 465–570.
- Congalton, R. G. 1991. A review of assessing the accuracy of classifications of remotely sensed data. Remote Sens. Environ. 37, 35–46. doi:10.1016/0034-4257(91)90048-B
- Davidson, S. J., Sloan, V. L., Phoenix, G. K., Wagner, R., Fisher, J. P. and co-authors. 2016. Vegetation type dominates the spatial variability in CH4 emissions across multiple Arctic tundra landscapes. Ecosystems 19, 1116–1132. doi:10.1007/s10021-016-9991-0
- Desyatkin, A. R., Takakai, F., Fedorov, P. P., Nikolaeva, M. C., Desyatkin, R. V. and co-authors. 2009. CH4 emission from different stages of thermokarst formation in Central Yakutia, East Siberia. Soil Sci. Plant Nutr. 55, 558–570. doi:10.1111/j.1747-0765.2009.00389.x
- Egorova, A. A. 2013. Flora of vascular plants of the resource reserve “Kytalyk” (Northeastern Yakutia). In: Proceedings of the 2nd International Conference on “Global Warming and the Human-Nature Dimension in Siberia: Social Adaptation to the Changes of the Terrestrial Ecosystem, with an Emphasis on Water Environments” & 7th Annual International Workshop “C/H2O/Energy Balance and Climate over Boreal and Arctic Regions with Special Emphasis on Eastern Eurasia”, Yakutsk, Russia. RIHN, Kyoto, Japan. 160–163. Online at : http://www.chikyu.ac.jp/siberia/2nd_International_Conference.pdf
- Emmerton, C. A., Lesack, L. F. W. and Marsh, P. 2007. Lake abundance, potential water storage, and habitat distribution in the Mackenzie River Delta, western Canadian Arctic. Water Resour. Res. 43, W05419.
- Epstein, H. E., Beringer, J., Gould, W. A., Lloyd, A. H., Thompson, C. D. and co-authors. 2004. The nature of spatial transitions in the Arctic. J. Biogeogr. 31, 1917–1933. doi:10.1111/j.1365-2699.2004.01140.x
- Fan, R., Morozumi, T., Maximov, T. C. and Sugimoto, A. 2018. Effect of floods on the delta C-13 values in plant leaves: a study of willows in Northeastern Siberia. PeerJ 6, e5374. doi:10.7717/peerj.5374
- Flessa, H., Rodionov, A., Guggenberger, G., Fuchs, H., Magdon, P. and co-authors. 2008. Landscape controls of CH4 fluxes in a catchment of the forest tundra ecotone in northern Siberia. Global Change Biol. 14, 2040–2056. doi:10.1111/j.1365-2486.2008.01633.x
- Forbes, B. C., Fauria, M. M. and Zetterberg, P. 2010. Russian Arctic warming and ‘greening’ are closely tracked by tundra shrub willows. Global Change Biol. 16, 1542–1554. doi:10.1111/j.1365-2486.2009.02047.x
- Frost, G. V. and Epstein, H. E. 2014. Tall shrub and tree expansion in Siberian tundra ecotones since the 1960s. Global Change Biol. 20, 1264–1277. doi:10.1111/gcb.12406
- Glagolev, M., Kleptsova, I., Filippov, I., Maksyutov, S. and Machida, T. 2011. Regional methane emission from West Siberia mire landscapes. Environ. Res. Lett. 6, 045214. doi:10.1088/1748-9326/6/4/045214
- Harding, R., Kuhry, P., Christensen, T. R., Sykes, M. T., Dankers, R. and co-authors. 2002. Climate feedbacks at the tundra-taiga interface. Ambio, 47–55.
- Holtmeier, F. K. and Broll, G. 2005. Sensitivity and response of northern hemisphere altitudinal and polar treelines to environmental change at landscape and local scales. Global Ecol. Biogeogr. 14, 395–410. doi:10.1111/j.1466-822X.2005.00168.x
- Iwahana, G., Takano, S., Petrov, R. E., Tei, S., Shingubara, R. and co-authors. 2014. Geocryological characteristics of the upper permafrost in a tundra-forest transition of the Indigirka River Valley, Russia. Polar Sci. 8, 96–113. doi:10.1016/j.polar.2014.01.005
- Johansson, T., Malmer, N., Crill, P. M., Friborg, T., Akerman, J. H. and co-authors. 2006. Decadal vegetation changes in a northern peatland, greenhouse gas fluxes and net radiative forcing. Global Change Biol. 12, 2352–2369. doi:10.1111/j.1365-2486.2006.01267.x
- Khitun, O. V., Koroleva, T. M., Chinenko, S. V., Petrovsky, V. V., Pospelova, E. B. and co-authors. 2016. Applications of local floras for floristic subdivision and monitoring vascular plant diversity in the Russian Arctic. Arct. Sci. 2, 103–126. doi:10.1139/as-2015-0010
- Kling, G. W., Kipphut, G. W. and Miller, M. C. 1992. The flux of CO2 and CH4 from lakes and rivers in Arctic Alaska. Hydrobiologia 240, 23–36. doi:10.1007/BF00013449
- de Klerk, P., Donner, N., Karpov, N. S., Minke, M. and Joosten, H. 2011. Short-term dynamics of a low-centred ice-wedge polygon near Chokurdakh (NE Yakutia, NE Siberia) and climate change during the last ca 1250 years. Quat. Sci. Rev. 30, 3013–3031. doi:10.1016/j.quascirev.2011.06.016
- Kravtsova, V. I. and Loshkareva, A. R. 2013. Dynamics of vegetation in the tundra-taiga ecotone on the Kola Peninsula depending on climate fluctuations. Russ. J. Ecol. 44, 303–311. doi:10.1134/S1067413613040085
- Lara, M. J., McGuire, A. D., Euskirchen, E. S., Tweedie, C. E., Hinkel, K. M. and co-authors. 2015. Polygonal tundra geomorphological change in response to warming alters future CO2 and CH4 flux on the Barrow Peninsula. Global Change Biol. 21, 1634–1651. doi:10.1111/gcb.12757
- Liang, M. C., Sugimoto, A., Tei, S., Bragin, I. V., Takano, S. and co-authors. 2014. Importance of soil moisture and N availability to larch growth and distribution in the Arctic taiga-tundra boundary ecosystem, northeastern Siberia. Polar Sci. 8, 327–341. doi:10.1016/j.polar.2014.07.008
- Lloyd, A. H., Rupp, T. S., Fastie, C. L. and Starfield, A. M. 2002. Patterns and dynamics of treeline advance on the Seward Peninsula, Alaska. J. Geophys. Res. Atmos. 108, 8161. doi:10.1029/2001JD000852
- Loranty, M. M., Lieberman-Cribbin, W., Berner, L. T., Natali, S. M., Goetz, S. J. and co-authors. 2016. Spatial variation in vegetation productivity trends, fire disturbance, and soil carbon across arctic-boreal permafrost ecosystems. Environ. Res. Lett. 11, 105003.
- Maechler, M., Rousseeuw, P., Struyf, A., Hubert, M. and Hornik, K. 2017. Cluster: Cluster Analysis Basics and Extensions. R package version 2.0.6. R CRAN.
- Marsh, P. and Hey, M. 1989. The flooding hydrology of Mackenzie delta lakes near Inuvik, NWT, Canada. Arctic 42, 41–49.
- Mastepanov, M., Sigsgaard, C., Strom, L., Tamstorf, M. P., Lund, M. and co-authors. 2013. Revisiting factors controlling methane emissions from high-Arctic tundra. Biogeosciences 10, 5139–5158. doi:10.5194/bg-10-5139-2013
- Matveev, A., Laurion, I., Deshpande, B. N., Bhiry, N. and Vincent, W. F. 2016. High methane emissions from thermokarst lakes in subarctic peatlands. Limnol. Oceanogr. 61, S150–S164. doi:10.1002/lno.10311
- Menyailo, O. V., Abraham, W. R. and Conrad, R. 2010. Tree species affect atmospheric CH4 oxidation without altering community composition of soil methanotrophs. Soil Biol. Biochem. 42, 101–107. doi:10.1016/j.soilbio.2009.10.005
- Montesano, P. M., Nelson, R., Sun, G., Margolis, H., Kerber, A. and co-authors. 2009. MODIS tree cover validation for the circumpolar taiga-tundra transition zone. Remote Sens. Environ. 113, 2130–2141. doi:10.1016/j.rse.2009.05.021
- Morishita, T., Hatano, R. and Desyatkin, R. V. 2003. CH4 flux in an Alas ecosystem formed by forest disturbance near Yakutsk, eastern Siberia, Russia. Soil Sci. Plant Nutr. 49, 369–377. doi:10.1080/00380768.2003.10410022
- Muster, S., Langer, M., Heim, B., Westermann, S. and Boike, J. 2012. Subpixel heterogeneity of ice-wedge polygonal tundra: a multi-scale analysis of land cover and evapotranspiration in the Lena River Delta, Siberia. Tellus B 64, 17301. doi:10.3402/tellusb.v64i0.17301
- Myhre, G., Shindell, D., Bréon, F.-M., Collins, W., Fuglestvedt, J. and co-authors. 2013. Anthropogenic and natural radiative forcing. In: Climate Change 2013: The Physical Science Basis. Contribution of Working Group I to the Fifth Assessment Report of the Intergovernmental Panel on Climate Change. Cambridge University Press, Cambridge, UK.
- Nakano, T., Inoue, G. and Fukuda, M. 2004. Methane consumption and soil respiration by a birch forest soil in West Siberia. Tellus B 56, 223–229. doi:10.1111/j.1600-0889.2004.00102.x
- Nauta, A. L., Heijmans, M., Blok, D., Limpens, J., Elberling, B. and co-authors. 2015. Permafrost collapse after shrub removal shifts tundra ecosystem to a methane source. Nat. Clim. Change 5, 67–70. doi:10.1038/nclimate2446
- Nicholson, B. J., Gignac, L. D. and Bayley, S. E. 1996. Peatland distribution along a north-south transect in the Mackenzie River Basin in relation to climatic and environmental gradients. Vegetatio 126, 119–133. doi:10.1007/BF00045599
- Nilsson, M., Mikkela, C., Sundh, I., Granberg, G., Svensson, B. H. and co-authors. 2001. Methane emission from Swedish mires: national and regional budgets and dependence on mire vegetation. J. Geophys. Res. 106, 20847–20860. doi:10.1029/2001JD900119
- Olefeldt, D., Turetsky, M. R., Crill, P. M. and McGuire, A. D. 2013. Environmental and physical controls on northern terrestrial methane emissions across permafrost zones. Global Change Biol. 19, 589–603. doi:10.1111/gcb.12071
- Pajunen, A. M. 2009. Environmental and biotic determinants of growth and height of Arctic willow shrubs along a latitudinal gradient. Arct. Antarct. Alp. Res. 41, 478–485. doi:10.1657/1938-4246-41.4.478
- Parmentier, F. J. W., van Huissteden, J., van der Molen, M. K., Schaepman-Strub, G., Karsanaev, S. A. and co-authors. 2011a. Spatial and temporal dynamics in eddy covariance observations of methane fluxes at a tundra site in northeastern Siberia. J. Geophys. Res. 116, G03016.
- Parmentier, F. J. W., van Huissteden, J., Kip, N., den Camp, H., Jetten, M. S. M. and co-authors. 2011. The role of endophytic methane-oxidizing bacteria in submerged Sphagnum in determining methane emissions of Northeastern Siberian tundra. Biogeosciences 8, 1267–1278. doi:10.5194/bg-8-1267-2011
- R Core Team. 2017. R: A Language and Environment for Statistical Computing. R Foundation for Statistical Computing, Vienna, Austria. Online at: https://www.R-project.org/
- Ranson, K. J., Montesano, P. M. and Nelson, R. 2011. Object-based mapping of the circumpolar taiga-tundra ecotone with MODIS tree cover. Remote Sens. Environ. 115, 3670–3680. doi:10.1016/j.rse.2011.09.006
- Roulet, N. T., Jano, A., Kelly, C. A., Klinger, L. F., Moore, T. R. and co-authors. 1994. Role of the Hudson-Bay Lowland as a source of atmospheric methane. J. Geophys. Res. 99, 1439–1454. doi:10.1029/93JD00261
- Sachs, T., Giebels, M., Boike, J. and Kutzbach, L. 2010. Environmental controls on CH4 emission from polygonal tundra on the microsite scale in the Lena river delta, Siberia. Global Change Biol. 16, 3096–3110.
- Schickhoff, U., Walker, M. D. and Walker, D. A. 2002. Riparian willow communities on the Arctic slope of Alaska and their environmental relationships: a classification and ordination analysis. Phytocoenologia 32, 145–204. doi:10.1127/0340-269X/2002/0032-0145
- Schneider, J., Grosse, G. and Wagner, D. 2009. Land cover classification of tundra environments in the Arctic Lena Delta based on Landsat 7 ETM + data and its application for upscaling of methane emissions. Remote Sens. Environ. 113, 380–391. doi:10.1016/j.rse.2008.10.013
- Semiletov, I. P., Pipko, I. I., Shakhova, N. E., Dudarev, O. V., Pugach, S. P. and co-authors. 2011. Carbon transport by the Lena River from its headwaters to the Arctic Ocean, with emphasis on fluvial input of terrestrial particulate organic carbon vs. carbon transport by coastal erosion. Biogeosciences 8, 2407–2426. doi:10.5194/bg-8-2407-2011
- Settele, J., Scholes, R., Betts, R., Bunn, S., Leadley, P. and co-authors. 2014. Terrestrial and inland water systems, In: Climate Change 2014: Impacts, Adaptation, and Vulnerability. Part A: Global and Sectoral Aspects. Contribution of Working Group II to the Fifth Assessment Report of the Intergovernmental Panel on Climate Change. Cambridge University Press, Cambridge, UK.
- Shingubara, R., Sugimoto, A., Murase, J., Tei, S., Takano, S. and co-authors. 2016. Multi-year response of CH4 efflux to wetting at Indigirka Lowland in northeastern Siberia. In: Japan Geoscience Union Meeting, Chiba, Japan, Japan Geoscience Union, Japan.
- Sidorchuk, A. and Matveev, B. 1994. Channel processes and erosion rates in the rivers of the Yamal Peninsula in western Siberia. In: Proceedings of the Symposium on Variability in Stream Erosion and Sediment Transport, Canberra, December 1994. IAHS Publ. 224. 197–202.
- Sidorchuk, A. Y., Panin, A. V., Borisova, O. K., Elias, S. A. and Syvistki, J. P. 2000. Channel morphology and river flow in the northern Russian Plain in the Late Glacial and Holocene. Int. J. Earth Sci. 89, 541–549. doi:10.1007/s005310000132
- Sjogersten, S. and Wookey, P. A. 2002. Climatic and resource quality controls on soil respiration across a forest-tundra ecotone in Swedish Lapland. Soil Biol. Biochem. 34, 1633–1646. doi:10.1016/S0038-0717(02)00147-5
- Sjogersten, S. and Wookey, P. A. 2009. The impact of climate change on ecosystem carbon dynamics at the Scandinavian mountain birch forest-tundra heath ecotone. Ambio 38, 2–10. doi:10.1579/0044-7447-38.1.2
- Skre, O., Baxter, R., Crawford, R. M. M., Callaghan, T. V. and Fedorkov, A. 2002. How will the tundra-taiga interface respond to climate change? Ambio, 37–46. (Special Issue 12).
- Soja, A. J., Tchebakova, N. M., French, N. H. F., Flannigan, M. D., Shugart, H. H. and co-authors. 2007. Climate-induced boreal forest change: predictions versus current observations. Global Planet. Change 56, 274–296. doi:10.1016/j.gloplacha.2006.07.028
- Striegl, R. G., Dornblaser, M. M., McDonald, C. P., Rover, J. R. and Stets, E. G. 2012. Carbon dioxide and methane emissions from the Yukon River system. Global Biogeochem. Cycles 26, GB0E05.
- Strom, L., Falk, J. M., Skov, K., Jackowicz-Korczynski, M., Mastepanov, M. and co-authors. 2015. Controls of spatial and temporal variability in CH4 flux in a high arctic fen over three years. Biogeochemistry 125, 21–35. doi:10.1007/s10533-015-0109-0
- Takakai, F., Desyatkin, A. R., Lopez, C. M. L., Fedorov, A. N., Desyatkin, R. V. and co-authors. 2008. CH4 and N2O emissions from a forest-alas ecosystem in the permafrost taiga forest region, eastern Siberia, Russia. J. Geophys. Res. Biogeosci. 113, G02002.
- Takeuchi, W., Tamura, M. and Yasuoka, Y. 2003. Estimation of methane emission from West Siberian wetland by scaling technique between NOAA AVHRR and SPOT HRV. Remote Sens. Environ. 85, 21–29. doi:10.1016/S0034-4257(02)00183-9
- Tchebakova, N. M., Parfenova, E. and Soja, A. J. 2009. The effects of climate, permafrost and fire on vegetation change in Siberia in a changing climate. Environ. Res. Lett. 4, 045013. doi:10.1088/1748-9326/4/4/045013
- Tei, S., Sugimoto, A., Liang, M. C., Yonenobu, H., Matsuura, Y. and co-authors. 2017. Radial growth and physiological response of coniferous trees to Arctic amplification. J. Geophys. Res. Biogeosci. 122, 2786–2803. doi:10.1002/2016JG003745
- Troeva, E., Isaev, A., Cherosov, M. and Karpov, N. 2010. The Far North: Plant Biodiversity and Ecology of Yakutia. Springer, Dordrecht.
- van Huissteden, J., Maximov, T. C., Kononov, A. V. and Dolman, A. J. 2008. Summer soil CH4 emission and uptake in taiga forest near Yakutsk, Eastern Siberia. Agric. For. Meteorol. 148, 2006–2012. doi:10.1016/j.agrformet.2008.08.008
- Virtanen, T. and Ek, M. 2014. The fragmented nature of tundra landscape. Int. J. Appl. Earth Obs. Geoinf. 27, 4–12. doi:10.1016/j.jag.2013.05.010
- Walter, K. M., Zimov, S. A., Chanton, J. P., Verbyla, D. and Chapin, F. S. 2006. Methane bubbling from Siberian thaw lakes as a positive feedback to climate warming. Nature 443, 71–75. doi:10.1038/nature05040
- Wanninkhof, R. 1992. Relationship between wind-speed and gas-exchange over the ocean. J. Geophys. Res. 97, 7373–7382. doi:10.1029/92JC00188