
ABSTRACT
Objectives
We aim to explore and analyze the related influencing factors of liver and cardiac iron overload in MDS patients detected by magnetic resonance imaging (MRI).
Methods
We have detected cardiac T2* and liver T2* by MRI in 105 MDS patients. Among them, 20 patients accepted MRI examination before and after iron chelation therapy (ICT). Results: We found that adjusted ferritin (ASF) was significantly correlated with liver T2* and cardiac T2*. RBC transfusion volume, brain natriuretic peptide (BNP) and age were the related factors of cardiac T2*, while RBC transfusion volume and erythropoietin (EPO) were related factors of liver T2*. After ICT, the changes of ASF and liver T2* were earlier than cardiac T2*. Chronic hepatitis but virus copy normal’s has no significant effect on liver iron deposition.
Conclusion
These results showed special attention should be paid to these related influencing factors of liver and cardiac T2* expression when we evaluated iron overload and detected the efficacy of ICT in MDS patients.
Background
A majority of MDS patients are chronically transfused as a result of anemia and can therefore develop iron overload (IO). IO can not only be exacerbated via increased dietary iron absorption as a result of ineffective erythropoiesis [Citation1] but also can be aggravated by the apoptosis of erythroblasts in MDS patients [Citation2]. Liver biopsy was once the gold index for diagnosing iron overload, but it was difficult to be widely used in clinic because of its high trauma and poor repeatability. The iron deposition degree can be evaluated based on the change of T2* in iron-bearing tissue by magnetic resonance imaging (MRI). This non-invasive detection method has become the gold standard to evaluate the iron content of myocardium and liver [Citation3]. Serum ferritin (SF) is the most commonly used and convenient method to test the iron level in clinical, but the results are easily affected by other factors (such as infection, inflammation and tumor). Besides, it cannot always truly reflect the iron deposition in the body. Instead of actual measured ferritin, adjusted ferritin (ASF) can reduce the effect of inflammation on ferritin [Citation4]. However, there is no large sample of clinical data to analyze the related influencing factors of liver T2* and cardiac T2*. Chronic hepatitis affects the clearance of serum ferritin in the liver, which can aggravate the excessive iron deposition in the liver [Citation5]. And elderly MDS patients are candidates for cardiac disease. Does age and other factors in patients with hepatitis antibody positive affect the expression of liver or cardiac T2*? Through a restrospective study in 105 MDS patients, we hope to find out the answer.
Methods
This study was conducted in accordance with the Declaration of Helsinki and was approved by Ethics Committee of our hospital. Written informed consent was obtained from all the participants.
Patients
One hundred and five MDS patients in our department were studied. MDS diagnosis references to this literature [Citation6]. Typing was in accordance with the 2016 WHO classification standards [Citation7]. Iron overload diagnosis references to this literature [Citation8]. In this study, liver T2*>6.3 ms was defined as normal, 1.4–6.3 ms as mild to moderate IO and <1.4 ms as severe IO. Cardiac T2*>20 ms as normal, 8–20 ms as mild to moderate IO and <8 ms as severe IO. A decrease in the liver T2* or cardiac T2* value indicates an increase in liver or cardiac iron content and vice versa. Patients with no blood transfusion were classified as group 1, monthly blood transfusion volume >800 ml as group 2 and monthly blood transfusion volume <800 ml as group 3. Among a total of 35 patients who received ICT treatment, 20 patients received the treatment of ICT for more than four courses. The usage is as follows: the deferoxamine mesylate dose was 20–60 mg kg−1 d−1, and the drug was continuously infused by a subcutaneous pump for 12 h.
Methods
Detection of liver and cardiac T2* by MRI: using verio 3.0T MRI system of Siemens company in Germany, the image acquisition of liver and cardiac was completed by skilled operators. Routine abdominal scan included fat suppression T2* WI in coronal and transverse axial positions, dual echo T1* WI in the same/reverse phase and diffusion-weighted imaging sequence. After routine scanning, the multi echo gradient echo sequence was used to collect liver axial multi echo T2* WI, and patients were asked to hold their breath at the end of breath during scanning. Imaging parameters: echo time(TE)(2.0–11.8)ms, echo interval 0.6 ms, total 16 echoes, repetition time(TR)200 ms, layer thickness 10 mm, scanning time 17 s. Then, myocardial T2* imaging was performed, and two chamber and four chamber localization images were collected in turn. The short axis position of the heart was selected at the place with the largest transverse diameter of the interventricular septum at the four chamber level, and multi echo gradient echo sequence was used. During the scanning process, the patients were asked to hold their breath at the end of exhalation. Imaging parameters: TE(2.0–19.4)ms, echo interval 2.5 ms, total 8 echoes, TR 22 ms, imaging matrix256 × 128, layer thickness 10 mm, scanning time 12 s.
Biochemical test: Twenty milliliters of peripheral blood was collected and sent to our biochemical immune laboratory for detection. The numerical values of serum iron (SI), SF, Total iron binding capacity (TIBC), C-reactive protein (CRP) and erythropoietin (EPO) were collected. SF and EPO were monitored by radioimmunoassay, SI and TIBC were measured by routine chemistry and CRP was evaluated by immunoturbidimetry. As the previous study found that SF was positively correlated with CRP (r = 0.414, P = 0.002), we used ASF instead of SF according to the literature [Citation4]: When CRP > 10 mg/l, ASF = SF/log 10 CRP; when CRP ≤ 10 mg/l, ASF = SF.
Statistics
The statistics were analyzed by SPSS 17.0. Normal distribution data were presented as x̄±SD, and comparison between two data using the independent sample t-test. The difference between these two groups before and after ICT was compared by the paired t-test. Nonparametric data were obtained using the rank sum test. Linear regression analysis was made to analyze the correlation. In all analysis, p<0.05 was considered as statistically significant.
Results
Patient characteristics
Among the 105, 102 patients were characterized with ASF > 1000 µg/l or liver iron overload (liver T2* < 6.3 ms) or heart iron overload (heart T2* < 20 ms), which include ASF>1000 µg/l in 79 cases, ASF> 2500 µg/l in 24 cases. Among these 13 MDS patients without blood transfusion history, 5 cases were with ASF > 1000 μg/l. Among the 31 patients with ASF < 1000 μg/l, 27 patients had liver iron overload, 5 patients had no blood transfusion history, 10 patients had cardiac iron overload and 5 patients had no blood transfusion history. Ninety-two patients had blood transfusion history. The mean RBC transfusion volume was 26 (2–560) U, and the mean transfusion frequency was 2 U per month (0.25–6). Among 33 severe hepatic iron overload patients, the mean age of 4 cases with ASF < 1000 ng/ml was 62.75 (52–76) year; the mean age of 14 cases with ASF < 2500 ng/ml was 62.46 (48–78) year; the mean age of 15 cases with ASF > 2500 ng/ml was 57.82 (35–82) year. According to the definition [Citation9], 83 patients were RBC transfusion dependence. shows the general information of patients.
Table 1. Patient characteristics.
The relationship between ASF with liver T2* and cardiac T2*
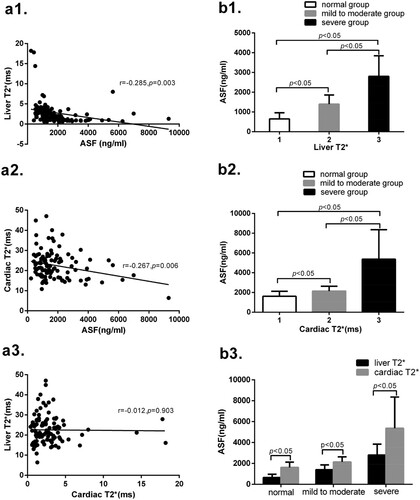
Among all 105 MDS patients, ASF expression indicates significant differences among normal, mild to moderate and severe groups in liver T2* and cardiac T2*. ASF is negatively correlated with liver T2* and cardiac T2*. But there is no significant correlation between liver T2* with cardiac T2*. Grouping according to the values of liver T2* and cardiac T2*, the ASF expression are different among normal, mild to moderate and severe groups. These results are shown in .
Figure 1. (a1) Liver T2* is negatively correlated with ASF (r = −0.285, p = 0.003). (a2) Cardiac T2* is negatively correlated with ASF (r = −0.267, p = 0.006). (a3) There is no significant correlation between liver T2* and cardiac T2* (r = −0.012, p = 0.903). (b1) There are significant differences in ASF between groups 1 and 2 (647.8 ± 314.2 vs 1397.2 ± 461.8, p < 0.05), between groups 2 and 3 (1397.2 ± 461.8 vs 2806.9 ± 1037.3, p < 0.05), and between groups 1 and 3 (647.8 ± 314.2 vs 2806.9 ± 1037.3, p < 0.05). (b2) There are significant differences in ASF between groups 1 and 2 (1613.7 ± 504.8 vs 2136.5 ± 493.9, p < 0.05), between groups 2 and 3 (2136.5 ± 493.9 vs 5372.0 ± 2985.4, p < 0.05), and between groups 1 and 3(1613.7 ± 504.8 vs 5372.0 ± 2985.4, p < 0.05). (b3) Cardiac T2*corresponds to ASF all higher in the normal group, mild to moderate group and severe group than those in the liver T2* group (1613.7 ± 504.8 vs 647.8 ± 314.2, p < 0.05; 2136.5 ± 493.9 vs1397.2 ± 461.8, p < 0.05; 5372.0 ± 2985.4 vs 2806.9 ± 1037.3, p < 0.05).
The relationship between EPO with ASF, liver T2* and cardiac T2* in all and no blood transfusion MDS patients
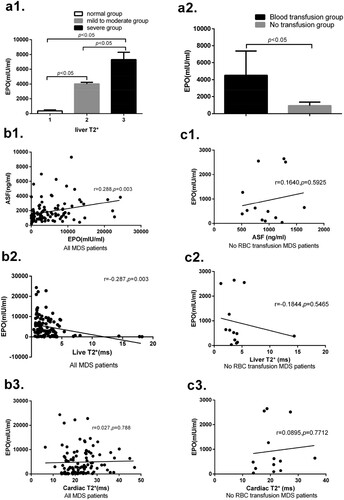
EPO expression is a significant correlation between liver T2* and ASF, but is not significantly correlated between cardiac T2* in all 105 MDS patients. EPO expressions are significantly different between normal, mild to moderate and severe liver T2* groups. EPO expression in the blood transfusion group is significantly higher than that in the no blood transfusion group. These results are shown in .
Figure 2. (a1) In liver T2*, the expression of EPO in group 2 is significantly higher than that in group 1 (4032.24 ± 206.27 vs 365.83 ± 137.36, p < 0.05), and the expression of EPO in group 3 is significantly higher than that in group 2 (7327.03 ± 983.88 vs 4032.24 ± 206.27, p < 0.05).(a2) The expression of EPO in the RBC transfusion group is significantly higher than that in the no RBC transfusion group (4512.64 ± 2869.43 vs 935.92 ± 419.35, p < 0.05).(b1) There is significant correlation between ASF and EPO (r = 0.288, p = 0.003) in all 105 MDS patients. (b2) There is significant correlation between liver T2* and EPO in all patients (r = −0.287, p = 0.003). (b3) There is no significant correlation between cardiac T2* and EPO in all patients (r = 0.027, p = 0.788). (c1) There is no significant correlation between ASF and EPO in 13 no RBC transfusion MDS patients (r = 0.164, p = 0.593). (c2) There is no significant correlation between liver T2* and EPO in no RBC transfusion patients (r = 0.184, p = 0.547). (c3) There is no significant correlation between cardiac T2* and EPO in no RBC transfusion patients (r = 0.090, p = 0.771).
The relationship between liver T2*, cardiac T2*, ASF with blood transfusion volume
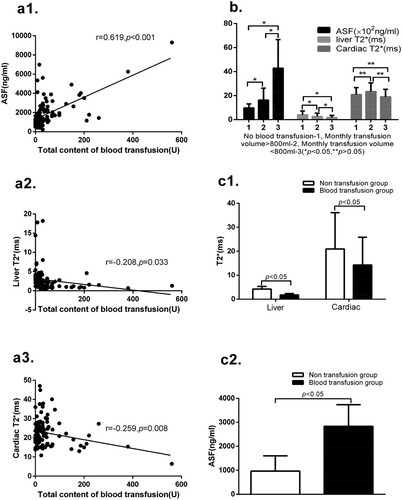
There are significantly differences in the test of ASF, liver T2*and cardiac T2* between the non-transfusion group and blood transfusion group. The total contents of blood transfusion are significantly correlated with liver T2*, cardiac T2* and ASF. The values of ASF and liver T2* are significantly different among groups 1, 2 and 3. But in terms of cardiac T2*, there are no significantly differences among group 1, 2 and 3. These results are shown in .
Figure 3. (a1) The total content of blood transfusion is significantly positive correlated with the levels of ASF (r = 0.619, p < 0.001). (a2) The total content of blood transfusion is significantly negatively correlated with liver T2* (r = −0.208, p = 0.033). (a3) The total content of blood transfusion is significantly negatively correlated with the values of cardiac T2* (r = −0.259, p = 0.008). (b) In terms of ASF levels, there are significant differences between groups 1 and 2 (978 ± 330 vs1628 ± 997, p < 0.05), between groups 2 and 3 (1628 ± 997 vs 4284 ± 2380, p < 0.05) and between groups 1 and 3 (978 ± 330 vs 4284 ± 2380, p < 0.05). In the values of liver T2*, there are significant differences between groups 1 and 2 (4.02 ± 3.19 vs 2.72 ± 2.66, p < 0.05), between groups 2 and 3 (2.72 ± 2.66 vs 1.82 ± 1.75, p < 0.05), and between groups 1 and 3 (4.02 ± 3.19 vs 1.82 ± 1.75, p < 0.05). In terms of values of cardiac T2*, there are no significant differences between groups 1 and 2 (20.91 ± 5.81 vs 23.37 ± 7.23, p > 0.05), between groups 2 and 3 (23.37 ± 7.23 vs 19.00 ± 6.28, p > 0.05) and between groups 1 and 3 (20.91 ± 5.81 vs 19.00 ± 6.28, p > 0.05). (c1) There are significant differences between the non-transfusion group and blood transfusion group in the values of liver T2* (4.22 ± 1.11 vs 1.74 ± 0.60, p < 0.05), and in cardiac T2* (20.96 ± 15.16 vs 14.26 ± 11.55, p < 0.05). (c2) There are significant differences between the non-transfusion group and blood transfusion group in the levels of ASF (964.46 ± 638.09 vs 2836.50 ± 900.20, p < 0.05).
The relationship between liver T2* and cardiac T2* with related factors
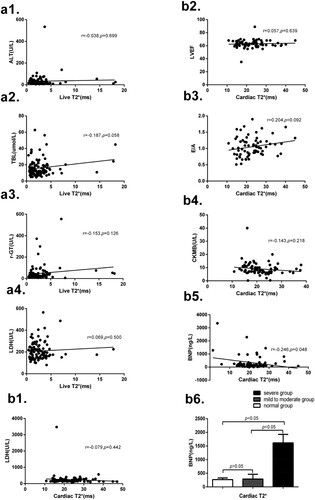
Among all 105 MDS patients, liver T2* is no significantly correlated with LDH, ALT, TBL and r-GT. Cardiac T2* is negative correlated with brain natriuretic peptide (BNP), but is not significantly correlated with LDH, left ventricular ejection fraction (LVEF), E/A and creatine kinase isoenzymes (CKMB). Besides, grouping according to the values of cardiac T2*, BNP expression in the severe group is significantly higher than that in the mild to moderate group and normal group, but there is no significant difference between the mild to moderate group and normal group. These results are shown in .
Figure 4. (a1) There is no significant correlation between liver T2* and ALT (r = −0.038, p = 0.699). (a2) No significant correlation between liver T2* and TBL (r = −0.187, p = 0.058). (a3) No significant correlation between liver T2* and r-GT (r = −0.153, p = 0.126). (a4) No significant correlation between liver T2* and LDH (r = 0.069, p = 0.500). (b1) There is no significant correlation between cardiac T2* and LDH(r = −0.079, p = 0.442). (b2) No significant correlation between cardiac T2* and LVEF (r = 0.057, p = 0.639). (b3) No significant correlation between cardiac T2* and E/A (r = 0.204, p = 0.092). (b4) No significant correlation between cardiac T2* and CKMB (r = −0.143, p = 0.218). (b5) There is significant correlation between cardiac T2 * and BNP (r = −0.246, p = 0.048). (b6) Grouping according to the values of cardiac T2*, the BNP in severe group is significantly higher than that in the mild to moderate group (1613.73 ± 312.38 vs 289.15 ± 173.85, p < 0.05) and that in the normal group (1613.73 ± 312.38 vs 268.95 ± 59.70, p < 0.05), and there is no significant difference between the mild to moderate group and normal group (289.15 ± 173.85 vs 268.95 ± 59.70, p > 0.05). Note: alanine aminotransferase (ALT), total bilirubin (TBL), glutamyl transferase (r-GT), lactate dehydrogenase (LDH), left ventricular ejection fraction (LVEF), the ration of early stage peak flow rate and late stage peak flow rate (E/A), creatine kinase isoenzymes (CKMB) and brain natriuretic peptide (BNP).
The relationship between liver T2*and cardiac T2*with IPSS-R, IPSS and WPSS score
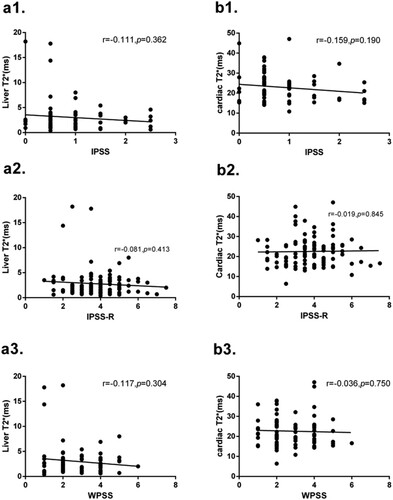
Analysis of 105 MDS patients showed that liver T2* and cardiac T2* were not significantly correlated to IPSS-R, IPSS and WPSS scores. These results are shown in .
Figure 5. (a1) No correlation is found between liver T2* and IPSS score (r = −0.111, p = 0.362). (a2) No correlation is found between liver T2* and IPSS-R score (r = −0.081, p = 0.413). (a3) No correlation is found between liver T2* and WPSS score (r = −0.117, p = 0.304). (b1) No correlation is found between cardiac T2* and IPSS score (r = −0.159, p = 0.190). (b2) No correlation is found between cardiac T2* and IPSS-R score (r = −0.019, p = 0.845). (b3) No correlation is found between cardiac T2* and WPSS score (r = −0.036, p = 0.750).
The change in ASF, liver T2*, cardiac T2*, EPO and BNP before and after ICT
Compared with those before ICT, the values of ASF and EPO were decreased and the level of liver T2* was increased after ICT, but the values of cardiac T2* and BNP were not changed significantly before and after ICT. These results are shown in .
Table 2. The change in ASF, liver T2*, cardiac T2*, EPO and BNP before and after iron chelation therapy (ICT).
The relationship between ASF, liver T2*, cardiac T2* with age, liver and cardiac diseases
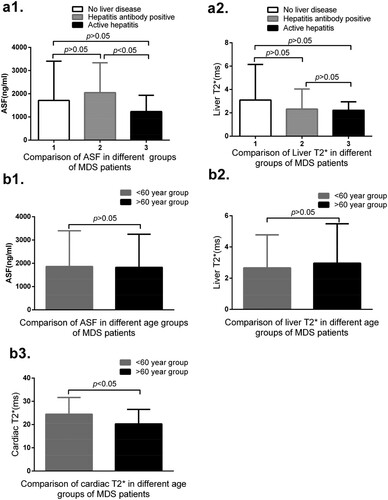
Among all the 105 patients, 49 cases have no basic liver diseases, 50 cases have hepatitis antibody positive, 46 cases have hepatitis B core antibody (HBcAg) positive and 8 cases have anti hepatitis E antibody positive, 4 cases have HBcAg and anti hepatitis E antibody positive, and 19 cases have hepatitis B e antibody (HBeAg) and HBcAg positive. All these patients virus copy are normal. Among them, six cases have hepatitis (including five cases of hepatitis B and one case of hepatitis C). Among the six patients with normal liver T2*, four cases are HBcAg positive, 3 cases are HBeAg and HBcAg positive, and one case is hepatitis C positive. Among these 66 mild to moderate liver T2* patients, 25 cases are HBcAg positive, including 10 cases being HBeAg and HBcAg positive, one case with HBcAg and anti hepatitis E antibody positive, 3 cases with anti hepatitis E antibody positive and 3 cases with hepatitis B positive. Among those 33 severe liver T2* patients, 18 cases are with HBcAg positive, including 7 cases with HBeAg positive, 4 cases with HBcAg positive and 1 case with HBV. In the three cases of coronary heart disease, one case includes after stent implantation after myocardial infarction. These three patients all have normal cardiac T2*. All mild to moderate and severe cardiac T2* patients all have no heart disease history. There are no significant differences between the age <60 year group and the age >60 year group in the values of ASF and liver T2*, but there are significant differences in the values of cardiac T2* between these two groups. These results are shown in .
Figure 6. (a1) No correlation is found between groups 1 and 2 (1712.27 ± 1693.58 vs 2048.20 ± 1289.89, p = 0.271), between groups 1 and 3 (1712.27 ± 1693.58 vs 1232.67 ± 703.79, p = 0.223), and between groups 2 and 3 (2048.20 ± 1289.89 vs 1232.67 ± 703.79, p = 0.038) in the levels of ASF. (a2) No significant differences between groups 1 and 2 (3.095 ± 3.347 vs 2.321 ± 1.724, p = 0.153), between groups 1 and 3 (3.095 ± 3.347 vs 2.220 ± 0.726, p = 0.141), and between groups 2 and 3 (2.321 ± 1.724 vs 2.220 ± 0.726, p = 0.809). (b1) There are no significant differences between age < 60 year and age > 60 year group in the levels of ASF (1861.79 ± 1531.84 vs 1824.69 ± 1424.81, p = 0.898). (b2) No significant differences between these two age groups in the values of liver T2*(2.66 ± 2.12 vs 2.96 ± 2.53, p = 0.606). (b3) No significant difference between these two age groups (24.44 ± 7.22 vs 20.29 ± 6.22, p = 0.002) in the values of cardiac T2*.
Discussion
Excessive iron is widely deposited in the liver, heart and other organs, especially for patients with hepatitis [Citation10] and anemia cardiomyopathy [Citation11], which can result in structural damage and dysfunction. High percentages of MDS patients suffer from chronic and severe anemia, which leads to RBC transfusion dependent. Our study shows that the values of liver T2* and cardiac T2* in the blood transfusion group are significantly lower than those in the non-blood transfusion group, while the levels of ASF are significantly higher in the non-blood transfusion group than those in the blood transfusion group. These results show that RBC transfusion is one of the important factors leading to iron overload in liver, cardiac and whole body. Results of correlation analysis show that the total content of blood transfusion is significantly related with the value of liver T2* and cardiac T2*. Besides, the monthly blood transfusion volume >800 ml is also related to the value of liver T2* and ASF, but is unrelated to the results of cardiac T2*. The analysis based on IPSS and IPSS-R scores does not take into account the factors of blood transfusion and could not reflect the IO of liver and cardiac. The analysis based on the WPSS score, although considers blood transfusion factors, the score is low, which cannot reflect iron deposition.
Blood transfusion is not the only cause of iron overload. Ineffective hematopoiesis can also cause iron overload [Citation12]. Our data show that iron deposition in the liver or cardiac can appear in non-blood transfusion MDS patients. Previous literature shows that serum hepcidin levels are appropriately low in MDS patients who did not receive RBC transfusions, and their hepcidin–ferritin ratio is markedly decreased compared to normal, and the hepcidin–ferritin ratio is negatively correlated with the EPO level [Citation13]. EPO is not associated with ASF, liver T2* and cardiac T2* in MDS patients without RBC transfusion. But due to the limited sample cases, research has to further study this conclusion. In all the 105 patients, EPO expression is significantly different between normal, mild to moderate and severe liver T2* groups, and EPO is significantly correlated to ASF and liver T2*, but is not significantly correlated to cardiac T2*. EPO is significantly higher in the RBC transfusion group than that in the non-transfusion group and the increase of EPO may aggravate iron overload caused by blood transfusion. Previous literature shows that erythrocytes stimulated by EPO secrete erythroferrone can inhibit the expression of hepcidin and increase the absorption of iron [Citation14]. This may be one of the reasons why patients with high EPO level have higher ASF and lower liver T2*.
There is no significant correlation between cardiac T2* and LDH, LVEF, E/A, CKMB, and no significant correlation between liver T2* and LDH, ALT, r-GT and TBL. There is significant correlation between cardiac T2* and BNP. BNP in severe cardiac T2* group is significant higher than that in normal and mild to moderate groups. Due to the limited sample cases, no conclusion can be drawn about the influence of coronary or other heart disease on cardiac T2*. Besides, age > 60 years is one of the important factors which influence cardiac T2*, since the risk of cardiovascular disease occurs in elderly patients and it increases significantly with age, such as obesity, hypertension, diabetes and hyperlipidemia. But age is not the factor influencing liver T2*, since the incidence rate of liver diseases such as chronic hepatitis does not increase with age.
Previous literature shows a moderate correlation between liver iron concentration and SF in MDS patients [Citation15]. Our study confirms that ASF correlates with liver T2*and cardiac T2*, but there is no significant correlation between cardiac T2* and liver T2*, and the correlation coefficients between ASF and cardiac are significantly higher than those in the liver. After ICT, the values of ASF, liver T2* and EPO decrease significantly, while the levels of cardiac T2* and BNP do not change significantly. These results show that the mechanism of iron deposition in cardiac and liver is different. Iron deposition occurs and decreases later in cardiac that in liver after receiving ICT, owing to the different mechanisms of iron absorption and excretion between the heart and the liver. The different metabolic dynamics of iron lead to the delay of iron deposition and removal in the heart. This phenomenon also occurs in thalassemia patients during ICT [Citation16]. Its specific mechanism needs further study. Our previous research shows that the EPO concentration and EPO resistance increase in iron overload MDS patients, but the concentration and resistance of EPO decrease while the efficacy of ESA increase after ICT. The change may be related to the impaired EPO-STAT5 signal pathway and the increase of EPO feedback [Citation17]. The change of BNP and EPO after ICT also confirms the relationship for BNP and cardiac T2*, and EPO and liver T2*.
The positive expressions of HBcAg and/or HBeAg, and/or anti hepatitis E antibody, have no significant effect on liver iron deposition in MDS patients without virus replication. Previous literature shows that chronic hepatitis may significantly inhibit the expression of hepcidin in the early stage, but the negative effect of viral factors may be eliminated with the accumulation of iron ions [Citation18]. And the negative effect of viral factors may be eliminated in patients with hepatitis antibody positive but without virus replication. Thus, hepatitis antibody positive has no effect on liver iron deposition. However, the values of liver T2* are not significantly reduced in four MDS patients with active hepatitis (hepatitis B and hepatitis C) compared with those in hepatitis antibody positive patients. This may be a result of the limited sample size. The conclusion has not been decided.
In conclusion, special attention should be paid to these related influencing factors on the liver and cardiac T2* expression when we evaluate iron overload and detect the efficacy of ICT in MDS patients. Since the cardiac may still be in the IO state after the decrease of ASF and iron content in the liver, the detection of iron content in the cardiac after ICT is very important. Due to insufficient cases, the influence of heart disease on cardiac T2* needs to be further explored.
Acknowledgements
We would like to thank other members of the department of hematology groups for their excellent care of the patients.
Disclosure statement
No potential conflict of interest by the authors.
References
- Camaschella C, Nai A. Ineffective erythropoiesis and regulation of iron status in iron loading anaemias. Br J Hematol. 2016;172(4):512–523.
- Gu S, Zhao Y, Guo J, et al. High expression of APAF-1 elevates erythroid apoptosis in iron overload myelodysplastic syndrome. Tumor Biol. 2014;35:2211–2218.
- Fragasso A, Ciancio A, Mannarella C, et al. Myocardial iron overload assessed by magnetic resonance imaging (MRI) T2* in multi-transfused patients with thalassemia and acquired anemias. Eur J Intern Med. 2011;22(1):62–65.
- Armand P, Kim HT, Rhodes J, et al. Iron overload in patients with acute leukemia or MDS undergoing myeloablative stem cell transplantation. Biol Blood Marrow Transplant. 2011;17(6):852–860.
- Abbass G, Farhan S, Nadeem MA, et al. Frequency of iron overload in patients of chronic hepatitis C undergoing therapy and treatment response in patients with iron overload. Pakistan J Med Health Sci. 2016;10(2):399–401.
- Hematology Branch of the Chinese Medical Association. MDS diagnosis and treatment expert consensus 2012. Chin J Hematol. 2012;33:347–352.
- Arber DA, Orazi A, Hasserjian R, et al. The 2016 revision to the World Health Organization classification of myeloid neoplasms and acute leukemia. Blood. 2016;127(20):2391–2405.
- Gattermann N, Rachmilewitz EA. Iron overload in MDS pathophysiology, diagnosis, and complications. Ann Hematol. 2011;90(1):1–10.
- Malcovati L, Della Porta MG, Pascutto C, et al. Prognostic factors and life expectancy in myelodysplastic syndromes classified according to WHO criteria: a basis for clinical decision making. J Clin Oncol. 2005;23:7594–7603.
- Kountouras D, Tsagarakis NJ, Fatourou E, et al. Liver disease in adult transfusion-dependent beta-thalassaemic patients: investigating the role of iron overload and chronic HCV infection. Liver Int. 2013;33:420–427.
- Abeid ZK, Al-Tu'ma FJ, Al-Naffi KO. Polymorphism of HFE gene in ischemic heart diseases and its relation with iron overload. Ijppr Human. 2017;8(3):31–41.
- Angelucci E, Cianciulli P, Finelli C, et al. Unraveling the mechanisms behind iron overload and ineffective hematopoiesis in myelodysplastic syndromes. Leuk Res. 2017;62:108–115.
- Cui R, Gale RP, Zhu G, et al. Serum iron metabolism and erythropoiesis in patients with myelodysplastic syndrome not receiving RBC transfusions. Leuk Res. 2014;38(5):545–550.
- Kautz L, Jung G, Du X, et al. Erythroferrone contributes to hepcidin suppression and iron overload in a mouse model of β-thalassemia. Blood. 2015;126(17):2031–2037.
- Cancado R, Watman NP, Lobo C, et al. Assessment of liver and cardiac iron overload using MRI in patients with chronic anemias in Latin American countries: results from ASIMILA study. Hematology. 2018;23(9):676–682.
- Noetzli LJ, Carson SM, Nord AS, et al. Longitudinal analysis of heart and liver iron in thalassemia major. Blood. 2008;112(7):2973–2978.
- Zhang Y. Effect of iron chelation therapy on EPO-STAT5 signalling pathway and EPO resistance in iron overloaded low-risk myelodysplastic syndrome patients. Hematology. 2020;25(1):1–10.
- Girellid D, Pasino M, Goodnough JB, et al. Reduced serum hepcidin levels in patients with chronic hepatitis C. J Hepatol. 2009;51(5):845–852.