
ABSTRACT
Objectives
Multiple myeloma (MM) involves a clinically and biologically heterogeneous malignancy of plasma cells. It is difficult to predict the prognosis of MM. The presence of circulating clonal plasma cells (CPC) has been associated with a worse prognosis in patients with MM.
Methods
This study retrospectively analysed CPC in 108 newly diagnosed MM patients by 8-colour flow cytometry to investigate their value for predicting the outcome and combined the level of CPC with the revised International Staging System (R-ISS) to stratify the MM patients according to risk.
Results
CPC were detected in 58/108 patients (53.7%). The optimum cut-off for the prediction of overall survival was determined to be 0.105%. Patients with higher R-ISS stages seemed to harbour more CPC. A level of CPC≥0.105% was an independent risk factor for adverse outcomes (P<0.001). The combination of the R-ISS staging system and level of CPC was used to stratify MM patients according to risk, and the combination of R-ISS stage III and a level of CPC≥0.105% defined the ultra-high-risk group.
Conclusion
This study suggests that a high proportion of CPC is associated with aggressive disease and that the use of the current R-ISS system in conjunction with assessment of the level of CPC may facilitate the stratification of newly diagnosed MM patients into clinically relevant prognostic subgroups.
Introduction
The introduction of novel agents has improved the clinical outcomes of multiple myeloma (MM) in the last decade [Citation1]; however, there is still a group of patients who have poor survival and exhibit resistance to novel agents. Therefore, it is necessary to identify these high-risk patients. The definition of a high-risk group is continuously evolving and remains controversial. The most widely accepted definition is based on cytogenetic and clinical biomarkers according to the revised International Staging System (R-ISS) [Citation2] and the recently updated Mayo Stratification of Myeloma and Risk-Adapted Therapy (mSMART) [Citation3]. Through genome analysis, Walker et al. described the high-risk type of myeloma as double-hit myeloma that involves either TP53 double-allele mutation or ISS stage III disease with CKS1B amplification (1q21+) [Citation4]. Unfortunately, next-generation sequencing is expensive and time- and labour-consuming. It is essential to develop assays for prognostic factors that are feasible and cost-effective to use in clinical practice.
High levels of circulating clonal plasma cells (CPC), identified by cytology [Citation5], multiparameter flow cytometry (MFC) [Citation6], or slide-based immunofluorescence [Citation6], are associated with a poor prognosis in patients with MM [Citation7,Citation8] and are a risk factor for progression in patients with monoclonal gammopathy of undetermined significance [Citation9] and smouldering MM [Citation10]. Two studies have proposed that the cut-off value for plasma cell leukaemia (PCL) should be revised to 5% CPC in peripheral blood smears from myeloma patients due to its similar outcomes to the originally defined PCL (i.e. ≥20% CPC) [Citation11,Citation12]. As the measurement of CPC is more minimally invasive than the measurement of bone marrow (BM), it is also very important for disease monitoring in myeloma patients after treatment [Citation13]. Although the biological significance of CPC in MM patients remains unknown, CPC represent a unique subset of patient-paired, potentially clonogenic BM plasma cells that have a quiescent phenotype [Citation14]. Therefore, we hypothesize that the quantification of CPC could have implications for redefining high-risk disease and that incorporating the level of CPC into the R-ISS staging system will identify a group at much higher risk of adverse outcomes with more aggressive disease. In the current study, we retrospectively analysed CPC in 108 newly diagnosed MM (NDMM) patients and investigated the correlations between their abundance and other clinical parameters and survival. We also combined the level of CPC with the R-ISS staging system to better stratify MM patients into subgroups with homogeneous survival.
Patients and method
Patients
A total of 108 NDMM patients between October 2015 and June 2018 were included. Patients signed informed consent forms, and the study was performed by the Declaration of Helsinki and approved by the Institutional Review Board (IRB) of Jiangsu Province Hospital. Clinical characteristics and laboratory data were collected.
The diagnostic criteria and response evaluation were based on the International Myeloma Working Group (IMWG) criteria [Citation15]. Patients were followed up to monitor their treatment response, progression-free survival (PFS), and overall survival (OS).
CPC and BM minimal residual disease (MRD) assessed by MFC
CPC and BM MRD were assessed by 8-colour flow cytometry. Blood samples and BM aspirates (2–4 ml) were collected in tubes containing EDTA as an anticoagulant and assessed by flow cytometry within 24h after collection. Appropriate amounts of peripheral blood and BM were added to a flow detection tube (adjusted according to the complete blood cell count and BM nucleated cell count to ensure that the total number of nucleated cells per tube was >106), and a specific antibody combination (CD38PBE/CD56APC-A750/CD19PerCP-Cy5.5/CD138APC/CD45KO/CD27Pe-Cy7 from BD Biosciences) was added at one-time point. Then, the cells were protected from light at room temperature and erythrocyte lysis, membrane rupture and perforation, and cKappa-FITC/cLamba-PE antibody staining were performed.
All samples were analysed with a Navios cytometry instrument with Kaluza software (Beckman Coulter). The gate was set on the FSC-INT/FSC-PEAK dot map to remove adherent cells, the gate was set on the FSC-INT/SSC-INT dot map to remove cell debris and dead cells, and the nucleated cell population was selected. Plasma cells were gated according to CD38/CD138 expression. CD19+CD56− cells were identified as normal plasma cells (nPCs), while CD19+CD56+, CD19−CD56+ and CD19−CD56− cells were identified as abnormal plasma cells (aPCs). Then, the cKappa/cLambda ratio of aPCs and nPCs was analysed. CPC were identified according to the cytoplasmic light chain ratio (kappa: lambda >3.0 or <0.3). At least 50,0000 nucleated cells were analysed for each tube. The percentage of CPC was expressed as CPC/total nucleated cells from the BM and blood. CPC negativity and MRD negativity were defined as the absence of CPC in the blood or BM with a limit of detection of <1×10⁻⁴, while CPC positivity and MRD positivity were defined as a level of CPC higher than this threshold. BM sample quality was assessed according to the method reported previously [Citation16].
Fluorescence in-situ hybridization (FISH) analyses
FISH was performed for 98/108 patients who had BM samples available at initial diagnosis. Five chromosomal abnormalities, including t(4; 14), t(14; 16), 1q21 amplification, IgH rearrangement, and P53 deletion, were detected by interphase fluorescence in-situ hybridization (iFISH) on CD138-sorted plasma cells. A total of 100–300 interphase nuclei in each sample were scored, as appropriate. The positive cut-off threshold was set as 20% for P53 deletion and 1q21 amplification and 10% for immunoglobulin H (IgH) translocations. High-risk cytogenetic abnormalities include t(4; 14), t(14;16), and P53 deletion.
Statistical analysis
The Mann–Whitney U test was used to compare differences between continuous variables, and chi-square tests and Fisher exact tests were used for nominal variables. The correlations between CPC and clinical stages were calculated by Spearman’s correlation. The distributions of OS and PFS were plotted by the Kaplan–Meier (K–M) method with the log-rank test. Univariate and multivariate analyses of survival were performed with Cox regression. GraphPad Prism 8.0 (GraphPad Software, San Diego, CA) and SPSS (version 25.0) (IBM Corporation, Armonk, NY, USA) were used for the statistical analysis. All reported P-values were two-sided with 95% confidence intervals, and a P-value ≤ 0.05 indicated statistical significance. Before the log-rank test was performed, the optimal CPC cut-off value was determined based on the receiver operating characteristic (ROC) curve.
Results
Clinical characteristics
The median age of the patients (n = 108) was 63 (range, 36–84) years, and 67 (62%) patients were males. All patients were recruited from October 2015 to June 2018 and were followed up until June 2019, and the median follow-up time was 22 (range, 2.0–43.0) months. CPC were detected in 58/108 patients (53.7%). No CPC were found in the remaining 50 patients (46.3%). The optimal cut-off value for the predicting OS was 0.105%, with a sensitivity of 69% and a specificity of 75%, according to the ROC analysis. Based on this, the patients were divided into two groups: one included 42 (38.9%) patients with CPC ≥ 0.105%, and the other included 66 (61.1%) patients with CPC < 0.105%. The clinical parameters were compared between the two groups. Patients with CPC ≥ 0.105% had higher levels of β2-microglobulin (P = 0.011), lactate dehydrogenase (LDH) (P = 0.001), and ferritin (FER) (P = 0.002); were more likely to harbour the P53 deletion (P < 0.001); and had a lower blood platelet count (BPC) (P = 0.038), than those with CPC < 0.105%. The characteristics of these two groups are shown in .
Table 1. Clinical characteristics of the 108 newly diagnosed MM patients according to CPC expressions.
Correlations between clinical stages and the level of CPC
A total of 16.7% (1/6) of the patients with CPC ≥ 0.105% were in DS stage I, 31.6% (6/19) were in DS stage II and 42.2% (35/83) were in DS stage III (P = 0.232). In terms of the ISS stage, the proportions of patients with each stage in the CPC ≥ 0.105% group were 23.1% (3/13), 34.2% (13/38), and 45.6% (26/57) (P = 0.092), respectively. In 98 patients with data available for R-ISS stratification, the proportions of patients with each stage in the group with CPC ≥ 0.105% were 20% (2/10), 35.2% (19/54), and 55.9% (19/34) (P = 0.017), respectively. Although all three staging systems showed a tendency for an increase in stage with an increase in the level of CPC, this was only statistically significant for the R-ISS stage, as shown in .
Table 2. Correlations between levels of CPC and patients’ clinical stages.
Survival analysis according to the level of CPC
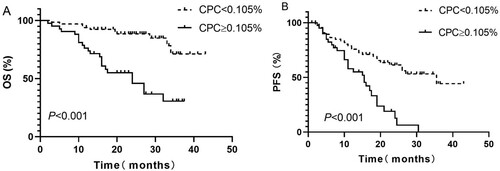
At the end of follow-up, 76 of 108 patients were still alive, which means that this study did not reach its median OS. The median PFS of the whole cohort was 23.0 (95% CI: 17.9–28.2) months. The median OS of patients with CPC ≥ 0.105% was 24.0 (95% CI: 15.0–33.0) months, while the median OS was not reached for patients with CPC < 0.105% ((A)). According to the K–M curves, patients with CPC ≥ 0.105% had significantly worse survival (P < 0.001). The median PFS duration of patients in the 2 groups were 16 (95% CI: 13.8–18.2) months and 35.5 (95% CI: 19.6–51.4) months (P < 0.001), respectively, ((B)). All the differences were statistically significant, as shown in .
Figure 1. Kaplan–Meier curves showing the (A) overall survival (OS) and (B) progression-free survival (PFS) of patients with less than or more than 0.015% circulating clonal plasma cells (CPC) at the time of the diagnosis of multiple myeloma (MM).
There was no significant difference in the frequency of initial therapy between the two groups, as shown in . The median OS was not reached in the patients in both the CPC ≥ 0.105% and CPC < 0.105% groups who received immunomodulatory drug (IMiD)-based therapy ((C)), while the median OS in patients who received bortezomib-based therapy was 17.0 (95% CI: 5.6–28.4) months for those with CPC ≥ 0.105% and not reached for those with CPC < 0.105% at diagnosis ((A)). According to the K–M curves, patients with CPC ≥ 0.105% had worse survival than patients with CPC < 0.105% after bortezomib-based therapy (P < 0.001; (A)). Interestingly, this trend was not statistically significant in patients who underwent IMiD-based therapy (P = 0.190; (C)).
Figure 2. Kaplan–Meier curves showing the (A) overall survival (OS) and (B) progression-free survival (PFS) of patients who received upfront bortezomib-based treatment with less than or more than 0.015% circulating clonal plasma cells (CPC) at the time of diagnosis. C and D show OS and PFS, respectively, for patients who received IMiD-based therapy.
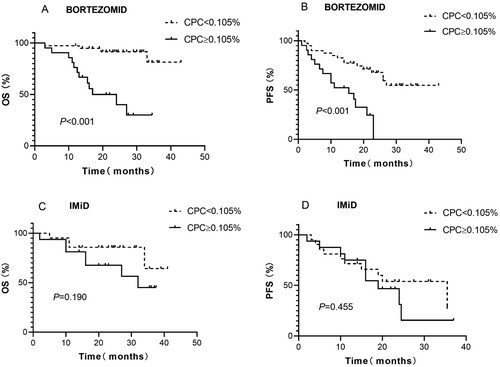
The median PFS of patients who received bortezomib therapy and had CPC ≥ 0.105% was 15.5 (95% CI: 6.19–24.8) months, while it was not reached in those with CPC < 0.105% (P < 0.001; (B)). A similar, but nonsignificant, trend was observed for PFS in these 2 groups of patients who received IMiD regimens [19 (95% CI: 11.37–26.62) months for the former group and 35.5 (95% CI: 15.9–55) months for the latter group (P = 0.455, (D))].
Survival analysis of the level of CPC after treatment
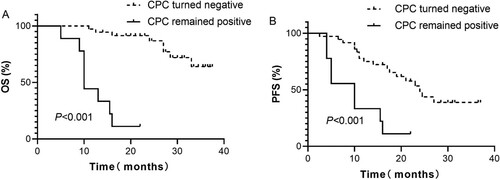
A total of 45 patients had complete follow-up data on the level of CPC. Among them, 36 patients had no CPC when the best response was achieved after treatment. The other 9 patients remained positive for CPC. The median OS of CPC-positive patients was only 10 (95% CI: 9.03–10.97) months, while that of patients who were negative for CPC after treatment was not reached. This suggests an inferior outcome for patients who were positive for CPC (P < 0.001). The median PFS duration of patients in those 2 groups were 8.0 (95% CI: 5.49–12.74) and 24 (95% CI: 19.37–28.63) months, respectively, and this difference was significant (P < 0.001), as shown in .
Figure 3. Kaplan–Meier curves showing the (A) overall survival (OS) and (B) progression-free survival (PFS) of evaluable patients with detectable or undetectable circulating clonal plasma cells (CPC) after treatment.
We further compared the MRD status of the BM by flow cytometry and the level of peripheral blood CPC in 45 patients at the point of remission (). MRD was still positive in the BM from 16 out of 36 patients who were negative for CPC, while CPC could be detected in all of the patients with positive MRD results according to the BM analysis. The negative predictive value of CPC for BM MRD was 56%, and the positive predictive value was 100% ().
Table 3. Comparison of CPC expression and paired MRD of bone marrow.
Univariate and multivariate Cox analyses for CPC
To evaluate whether factors other than the level of CPC could affect patient prognosis, we used a Cox proportional hazard model including age, β2-MG, LDH, serum creatine (sCr), CPC, R-ISS stage III, and high-risk cytogenetic changes to explore their effects on OS and PFS. As a result, we found that the following factors negatively affected OS in the univariate Cox model: β2-MG ≥ 3.5 mg/L, LDH ≥ 271 U/L, sCr ≥ 177.8 μmol/L, CPC ≥ 0.105%, R-ISS stage III and high-risk cytogenetic changes. β2-MG ≥ 3.5 mg/L, sCr ≥ 177.8 μmol/L, and CPC≥0.105% also had significant impacts on PFS. In the multivariate analysis, only CPC ≥ 0.105% and R-ISS stage III were significantly associated with an inferior OS, whereas only CPC ≥ 0.105% predicted a worse PFS ()
Table 4. Univariate and multivariate COX analysis of factors predicting for OS and PFS.
The combined level of CPC and R-ISS stages to stratify MM patients
The R-ISS staging system in conjunction with the level of CPC was used to stratify the risk of adverse outcomes in MM patients. In the group of patients with R-ISS stage I (n = 10), there was no difference in OS between the two groups with CPC ≥ 0.105% and CPC < 0.105% (NR vs. NR, P = 0.593). Among patients with R-ISS stage II disease (n = 54), the median OS was 27 months for those with CPC ≥ 0.105% but was not reached for patients with CPC < 0.105% (P = 0.0383). Among those with R-ISS stage III disease (n = 34), a statistically significant difference was found in OS between patients with CPC ≥ 0.105% and CPC < 0.105% (11.5 months vs. 33 months, P < 0.001). There seemed to be a trend for worse survival in the CPC ≥ 0.105% group of patients with R-ISS stage II disease than in the CPC < 0.105% group of patients with R-ISS stage III disease, but the difference was not significant, as shown in (A) (27 months vs. 33 months, P = 0.313).
Figure 4. Kaplan–Meier curves showing (A) overall survival (OS) and (B) progression-free survival (PFS) according to R-ISS stages based on the level of circulating clonal plasma cells (CPC) level.
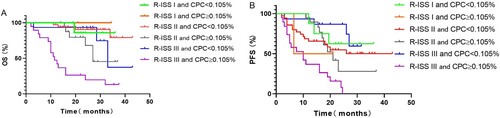
There was no difference in PFS between patients with CPC ≥ 0.105% and CPC < 0.105% among those with R-ISS stage II disease (21 months vs. NR; P = 0.921) and R-ISS stage I disease (13.75 months vs. NR; P = 0.547). The median PFS for those with CPC ≥ 0.105% was significantly worse than that of those with CPC < 0.105% (10 months vs not reached, P < 0.001) in the group with R-ISS stage III disease. A trend for better survival was noted in R-ISS III stage patients with CPC < 0.105% than in all of R-ISS stage II patients and those with R-ISS stage I disease with CPC ≥ 0.105% (NR vs. 21 months, P = 0.052; NR vs. 13.75 months, P = 0.188, respectively), but the differences were not significant, as shown in (B).
Discussion
Several studies have demonstrated that a higher proportion of CPC is a negative prognostic factor in MM at several clinical milestones (at diagnosis [Citation7], pre-stem cell transplantation [Citation17], and in the relapsed or refractory phase [Citation8]). This study focused on 108 patients with symptomatic NDMM. We considered 0.105% to be the optimal cut-off value for CPC for the prediction of a poor prognosis. NDMM patients with a high proportion of clonal CPC and persistence of CPC following therapy have worse survival. This prognostic value was independent of other well-established prognostic markers, such as high-risk FISH cytogenetic changes, LDH at diagnosis, and β2-MG. Interestingly, when we combined the R-ISS staging system and level of CPC to re-stratify patients according to the risk of adverse outcomes of MM, patients with a low level of CPC in stage III disease had similar outcomes to those with stage II disease. However, a high-risk R-ISS stage combined with CPC ≥ 0.105% was found to indicate an even higher risk of adverse outcomes.
The main reason for the existence of a high number of CPC is cytogenetic abnormalities. A recent study showed that 13q deletion and t(4;14) were more common in patients with CPC ≥ 2% than in those with intramedullary MM [Citation5]. Another study from the Mayo Clinic also showed that the incidence of t(4;14) was significantly higher in those with CPC before autologous stem cell transplantation [Citation17]. In the present study, it was observed that patients with CPC ≥ 0.105% had a twofold higher risk of harbouring high-risk cytogenetic changes than those with CPC < 0.105%. When assessing the frequency of individual cytogenetic abnormalities, 14.3% of the high-CPC group harboured P53 deletions, which was more than eightfold (30% vs 3.4%) the rate in the low-CPC group. As impairment of the P53 tumour suppressor pathway might play a role in extramedullary tumor expansion [Citation18], we speculated that 17p deletion may contribute to the increase in the level of CPC. This may shed light on the pathogenesis of 17p deletion-facilitated extramedullary disease.
With advancement in technologies utilized for diagnosis and the emergence of new agents for the treatment of MM, prognostic markers have also evolved [Citation2, Citation19]. In this study, patients in the high-CPC group had a worse median OS than those in the R-ISS stage III group (24 months vs. 32 months), but the groups had an identical median PFS of 16 months. Of note, a level of CPC ≥ 0.105% was correlated with a higher R-ISS stage; moreover, in R-ISS stage III patients, approximately half of the group with CPC < 0.105% did not have inferior survival, as we had hypothesized, and only those with CPC ≥ 0.105% were classified in the much higher risk group with a dire prognosis (median OS = 11.5 months; PFS = 10 months). In consideration of the strong impact on OS revealed by multivariate Cox analysis, the presence of ≥0.105% CPC may be considered for inclusion as an additional factor in the R-ISS staging system. A recent study by the Mayo Clinic demonstrated that R-ISS stage I and R-ISS stage II MM patients with the presence of > 5 CPC/μL by MFC at diagnosis had a worse prognosis than R-ISS stage III MM patients, indicating that they could be potentially upstaged to R-ISS III [Citation20]. However, patients with high level of CPC who had R-ISS stage I and R-ISS stage II disease did not have survival outcomes that were similar to those of all R-ISS stage III patients in our study, probably due to the short follow-up time. Consistent with the Mayo Clinic findings, the combination of R-ISS stage and level of CPC could facilitate clinical diagnosis and treatment by identifying high-risk MM patients, thereby facilitating treatment decision-making. This is particularly useful given the short follow-up time in our study, as it appears to be a powerful predictor of early treatment relapse and mortality and can identify the subset of patients at even higher risk.
The impact of CPC on prognosis was also evaluated by comparing OS between groups of patients treated with various regimens. We found that the prognosis of patients with a high level of CPC was significantly inferior to that of patients with low level of CPC in the bortezomib group. However, this trend was not found in the IMiD group. Moreover, a similar proportion of patients positive for CPC became negative for CPC after the use of these two regimens. This suggested that IMiD was insufficient for improving the prognosis of patients with a high level of CPC. Due to the relatively small size of the cohort, a large-scale study and long-term follow-up are needed to assess whether the level of CPC can be used as a predictor of treatment response.
Interestingly, CPC were not detected in 64% of the patients with MRD-positive BM; however, there was concordance with CPC-positive MRD, which is in line with previous observations [Citation13]. This further indicates the positive predictive value of the level of CPC for BM MRD and shows that it could represent a more minimally invasive biomarker of BM MRD positivity.
However, our study is limited by its retrospective nature, relatively short follow-up duration, and a small cohort of patients. Second, the survival analysis did not account for competing risks for mortality. Further prospective studies with larger patient cohorts are needed to validate the prognostic value of CPC, especially for enhancing the R-ISS classification of a subset of much higher risk NDMM patients with stage III disease.
Conclusion
This study further reinforces the value of the level of CPC as a prognostic marker in myeloma. Furthermore, the presence of CPC appeared to enhance the ability of the current R-ISS staging prognostic system to distinguish a subset of patients with a, particularly poor prognosis. Thus, these findings may have significance in the context of modifying the definitions of high-risk disease and in clinical practice about adopting a risk-adapted initial treatment.
Disclosure statement
No potential conflict of interest was reported by the authors.
Additional information
Funding
References
- Rajkumar SV. Multiple myeloma: 2016 update on diagnosis, risk-stratification, and management. Am J Hematol. 2016;91(7):719–734.
- Palumbo A, Avet-Loiseau H, Oliva S, et al. Revised International staging system for multiple myeloma: a report from International Myeloma Working group. J Clin Oncol. 2015;33(26):2863–2869.
- mSMART 3.0: Classification of active MM[DB/OL]. https:// www.msmart.org/mm-treatment-guidelines.
- Walker BA, Mavrommatis K, Wardell CP, et al. A high-risk, Double-Hit, group of newly diagnosed myeloma identified by genomic analysis. Leukemia. 2019;33(1):159–170.
- An G, Qin X, Acharya C, et al. Multiple myeloma patients with low proportion of circulating plasma cells had similar survival with primary plasma cell leukemia patients. Ann Hematol. 2015;94(2):257–264.
- Witzig TE, Gertz MA, Lust JA, et al. Peripheral blood monoclonal plasma cells as a predictor of survival in patients with multiple myeloma. Blood. 1996;88(5):1780–1787.
- Nowakowski GS, Witzig TE, Dingli D, et al. Circulating plasma cells detected by flow cytometry as a predictor of survival in 302 patients with newly diagnosed multiple myeloma. Blood. 2005;106(7):2276–2279.
- Gonsalves WI, Morice WG, Rajkumar V, et al. Quantification of clonal circulating plasma cells in relapsed multiple myeloma. Br J Haematol. 2014;167(4):500–505.
- Kumar S, Rajkumar SV, Kyle RA, et al. Prognostic value of circulating plasma cells in monoclonal gammopathy of undetermined significance. J Clin Oncol. 2005;23(24):5668–5674.
- Gonsalves WI, Rajkumar SV, Dispenzieri A, et al. Quantification of circulating clonal plasma cells via multiparametric flow cytometry identifies patients with smoldering multiple myeloma at high risk of progression. Leukemia. 2017;31(1):130–135.
- Ravi P, Kumar SK, Roeker L, et al. Revised diagnostic criteria for plasma cell leukemia: results of a Mayo Clinic study with comparison of outcomes to multiple myeloma. Blood Cancer J. 2018;8(12):116.
- Granell M, Calvo X, Garcia-Guiñón A, et al. Prognostic impact of circulating plasma cells in patients with multiple myeloma: implications for plasma cell leukemia definition. Haematologica. 2017;102(6):1099–1104.
- Sanoja-Flores L, Flores-Montero J, Puig N, et al. Blood monitoring of circulating tumor plasma cells by next-generation flow in multiple myeloma after therapy. Blood. 2019;134(24):2218–2222.
- Paiva B, Paino T, Sayagues J-M, et al. Detailed characterization of multiple myeloma circulating tumor cells shows unique phenotypic, cytogenetic, functional, and circadian distribution profile. Blood. 2013;122(22):3591–3598.
- Kumar S, Paiva B, Anderson KC, et al. International Myeloma Working Group consensus criteria for response and minimal residual disease assessment in multiple myeloma. Lancet Oncol. 2016;17(8):e328–e346.
- Rawstron AC, Orfao A, Beksac M, et al. Report of the European Myeloma Network on multiparametric flow cytometry in multiple myeloma and related disorders. Haematologica. 2008;93:431–438.
- Chakraborty R, Muchtar E, Kumar SK, et al. Risk stratification in myeloma by detection of circulating plasma cells before autologous stem cell transplantation in the novel agent era. Blood Cancer J. 2016;6(12):e512.
- Tiedemann RE, Gonzalez-Paz N, Kyle RA, et al. Genetic aberrations and survival in plasma cell leukemia. Leukemia. 2008;22(5):1044–1052.
- Greipp PR, Miguel JS, Durie BGM, et al. International staging system for multiple myeloma. J Clin Oncol. 2005;23(15):3412–3420.
- Gonsalves WI, Jevremovic D, Nandakumar B, et al. Enhancing the R-ISS classification of newly diagnosed multiple myeloma by quantifying circulating clonal plasma cells. Am J Hematol. 2020;95(3):310–315.