
ABSTRACT
Objective
The aim of this study was to determine the biological function of Sprouty 1 (SPRY1) on acute myeloid leukemia (AML), and to investigate the potential mechanism.
Methods
The expression of SPRY1 and the prognostic values of SPRY1 were assessed through the analysis of the Cancer Genome Atlas. Meanwhile, the expression of SPRY1 in AML cells was determined by qRT-PCR and western blot. Then, the biological function of SPRY1 on the proliferation, cell cycle and apoptosis in K-562 and HL-60 cells were tested using 3-(4,5-dimethylthiazol-2-yl)-2,5-diphenyltetrazolium bromide assay, colony-formation assay, 5-ethynyl-20-deoxyuridine assay and flow cytometry. Additionally, the protein expressions were measured by western blot.
Results
We found that SPRY1 was markedly overexpressed in the cells of the patients with AML, and the patients with AML having a high SPRY1 expression has a bad prognosis. The proliferation and cell cycle progression in K-562 and HL-60 cells were notably promoted by SPRY1 overexpression, but inhibited by SPRY1 knockdown. Meanwhile, the apoptosis of K-562 and HL-60 cells was significantly repressed by SPRY1 overexpression and facilitated by SPRY1 knockdown. In addition, we found that SPRY1 overexpression significantly activated the Hedgehog pathway in AML cells. The function of SPRY1 on the proliferation, cell cycle and apoptosis was reversed by Gli1 in K-562 and HL-60 cells.
Discussion
Identifying new biomarkers and exploring the pathogenesis of AML is urgent to improve the disease surveillance for patients with AML.
Conclusions
SPRY1 could facilitate cell proliferation and cell cycle progression, and suppress cell apoptosis via activating the Hedgehog pathway in AML.
Introduction
Acute myeloid leukemia (AML) is one of the most common malignant tumors of the blood system, which is featured by the uncontrolled proliferation, impaired apoptosis and interfere with programmed differentiation of leukemic cells [Citation1]. AML accounts for approximately 70% of all patients with acute leukemia [Citation2]. In the past years, despite the considerable improvements in chemotherapy and stem cell transplantation, the 5-year survival of patients with AML is only 20−40% [Citation3]. Therefore, identifying new biomarkers and exploring the mechanisms of AML progression are urgently needed for the treatment of AML.
Sprouty (SPRY) family consists of four members (SPRY1, SPRY2, SPRY3 and SPRY4), which differs in tissue distribution, activity and interaction partners [Citation4]. Growing evidence has demonstrated that SPRY1 plays an important role in cell proliferation, differentiation, migration and apoptosis [Citation5]. SPRY1 is reported to be involved in the development of different types of cancers, such as ovarian cancer [Citation6,Citation7], gastric cancer [Citation8], glioma [Citation9] and breast cancer [Citation5]. Additionally, the analysis of the Cancer Genome Atlas (TCGA) confirms that SPRY1 expression is significantly upregulated in patients with AML. However, none of the studies report on the effects of SPRY1 in AML to date.
In current study, we demonstrated that SPRY1 expression was significantly upregulated in AML. In addition, we also confirmed that SPRY1 could facilitate cell proliferation and cell cycle progression, and suppress cell apoptosis via activating the Hedgehog pathway in AML, thus providing SPRY1 as a potential diagnostic biomarker and therapeutic target for AML.
Materials and methods
Cell lines and cultures
Human bone marrow stromal cells HS-5 and myeloid leukemia cells (Kasumi-1) were obtained from American Type Culture Collection (ATCC, Manassas, VA, USA). Myeloid leukemia cells (K-562, MV-4-11 and HL-60) were supplied by Shanghai Cell Bank of Chinese Academy of Sciences (Shanghai, China). Myeloid leukemia cells (Kasumi-1, K-562, MV-4-11 and HL-60) were cultured in Roswell Park Memorial Institute 1640 (RPMI-1640) medium (HyClone, South Logan, UT, USA) at 37°C in a humidified air containing 5% CO2. The HS-5 cells were cultured in Dulbecco’s modified Eagle’s medium (DMEM; Gibco, Grand Island, NY, USA) under the same conditions. Cyclopamine and Vismodegib supplied by MedChemExpress (NJ, USA) and Beyotime (Shanghai, China), respectively, were dissolved and diluted with dimethyl sulfoxide (DMSO).
Cell transfection
For promoting SPRY1 or Gli1 expression, SPRY1 gene overexpression vector (pcDNA-SPRY1), Gli1 gene overexpression vector (pcDNA-Gli1) and their empty pcDNA3.1 vector were transfected into K-562 and HL-60 cells by Lipofectamine 3000 (Invitrogen, Waltham, MA, USA). For inhibiting SPRY1 or Gli1 expression, small interference RNA against SPRY1 (si-SPRY1), si-Gli1 and their negative controls were also transfected into K-562 and HL-60 cells. The pcDNA-SPRY1, pcDNA-Gli1, si-SPRY1, si-Gli1 and their negative controls were obtained from Genepharma (Shanghai, China). Moreover, K-562 and HL-60 cells transfected with pcDNA-SPRY1 or co-transfected pcDNA-SPRY1 and pcDNA-Gli1 were cultured in DMEM containing Cyclopamine (20 μM) or Vismodegib (100 μM) for 48 h. After 48 h of the transfection, the cells were collected for further study.
3-(4,5-Dimethylthiazol-2-yl)-2,5-diphenyltetrazolium Bromide (MTT) assay
The transfected K-562 and HL-60 cells were first inoculated into a 96-well plate at 37°C at a density of 5×10³/well. After the indicated time, the plates were incubated at 37°C in dark for 4 h after each well was added with 20 μL of MTT solution (5 mg/mL, Sigma, Burlington, MA, USA). Following the removal of MTT solution, 200 μL of DMSO was added to each well. Finally, the absorbance at 570 nm was measured using a microplate reader (Thermo Fisher, USA). Each experiment was performed in triplicate and repeated at least three times.
Colony-formation assay
For the colony-formation assay, the transfected K-562 and HL-60 cells were seeded into a 6-well plate at 500 cells per well and cultured in RPMI-1640 medium for 14 days. After that, the cell colonies were washed with phosphate buffered saline (PBS), fixed with 4% paraformaldehyde for 30 min and then stained with 0.1% crystal violet (Sigma) for 20 min. Finally, the colony numbers were photographed and counted under a microscope.
5-Ethynyl-20-deoxyuridine (EdU) assay
EdU assay was performed using Cell-Light™ EdU Apollo 488 In Vitro Kit (Ruibio, Zhejiang, China). After transfection, K-562 and HL-60 cells were incubated in EdU solution for 2 h. Then, 4′,6-diamidino-2-phenylindole (DAPI, Beyotime) was used to stain the nuclei. Finally, the cells were visualized under the fluorescence microscopy. Nuclei that double-labeled with EdU and DAPI were considered to be positive cells.
Cell cycle and apoptosis flow cytometry analyses
After 48 h of transfection, K-562 and HL-60 cells were harvested by trypsinization and washed with PBS twice. For cell apoptosis assay, cell apoptotic rate was assessed using an Annexin V-FITC/PI Apoptosis Detection Kit (Sigma) according to the manufacturer’s protocol. In brief, the cells were double-stained with Annexin V-FITC and PI for 20 min in the dark. For cell cycle assay, the cells were fixed in 70% chilled ethanol at 4°C overnight, and then stained with PI for 15 min in the dark. Finally, cell apoptotic rate and cell cycle were analyzed using the flow cytometry (FACSCalibur, BD Biosciences, USA).
RNA extraction and quantitative RT–PCR
Total RNAs from cells were extracted using the RNAiso Plus Reagent (Takara, Dalian, China) as per the manufacturer’s protocols. Complementary DNAs (cDNAs) were obtained using PrimeScript RT reagent kit (TaKaRa, Japan). Then, qRT-PCR was performed in the StepOne Plus Real-Time PCR system (Applied Biosystems, Waltham, MA, USA) using the SYBR Premix Ex Taq kit (TaKaRa). The primers used in our study were as follows: SPRY1 (Forward): 5′-TCCCTGCCCTGGATAAGGAA-3′, (Reverse): 5′-CACGGCCGAAATGCCTAATG-3′; Gli1 (Forward): 5′-TGTGGGGACAGAAGTCAAGT-3′, (Reverse): 5′-GCCAATGGAGAGATGACCGT-3′ and GAPDH (Forward): 5′-CATGTTGCAACCGGGAAGGA-3′, (Reverse): 5′-GCCCAATACGACCAAATCAGAG-3′.
Western blot analysis
After cells were disrupted, the total protein was extracted using radioimmuno-precipitation assay (RIPA) buffer (Beoytime). Then, proteins (50 μg/sample) were electrophorized by 10% SDS-PAGE and transferred onto polyvinylidene difluoride membrane (Millipore, Burlington, MA, USA). After that, the membranes were blocked with 5% skim milk, and incubated with the relevant primary antibodies at 4°C overnight. Then, the membranes were incubated with the secondary antibody for 1 h at room temperature. The proteins were visualized with the enhanced chemiluminescence reagent (Pierce, USA). The primary antibodies used in our study were as follows: SPRY1, no. #12993; p16, no. #80772; p21, no. #2947, obtained from Cell signaling, USA; Bax, no. ab32503; cleaved caspase-3, no. ab2302; Bcl-2, no. ab32124; SHH, no. ab53281; Gli1, no. ab49314, obtained from Abcam, USA; Smo, no. 66851-1-Ig; GAPDH, no. 60004-1-Ig, obtained from Proteintech, USA.
Bioinformatics
The expression data of SPRY1 in 173 patients with AML and 70 normal people were obtained from the Cancer Genome Atlas (TCGA) database (https://cancergenome.nih.gov/) and the Genotype-Tissue Expression (GTEx) data (https://www.gtexportal.org). Then, the differential expression of SPRY1 and its relative prognosis curve were analyzed using Gene Expression Profiling Interactive Analysis (GEPIA) website (http://gepia2.cancer-pku.cn). The differentially expressed SPRY1 was analyzed using the Limma package. The differentially expressed SPRY1 was screened by the following criteria: |the log-fold change (log2FC)| > 1 and P-value <.05. Moreover, ‘quartile’ was used to define the ‘high SPRY1’ and ‘low SPRY1’ groups in the overall survival curve. To explore the signaling pathways that the SPRY1 acts on AML, the Gene set enrichment analysis (GSEA) was performed. GSEA was run and the cut-off criteria were as follows: |normalized enrichment scores (NES)| > 1.0, false discovery rate (FDR) q < 0.25 and nominal p < .05.
Statistical analysis
Data analysis was implemented with the GraphPad Prism 8.0. All data were displayed as mean ± standard deviation (SD) from more than two independent assays. Student’s t-test or one-way ANOVA accompanied was used to analyze the comparisons. P < .05 was considered to be statistically significant.
Results
The expression of SPRY1 is upregulated in AML and related to the prognosis of AML
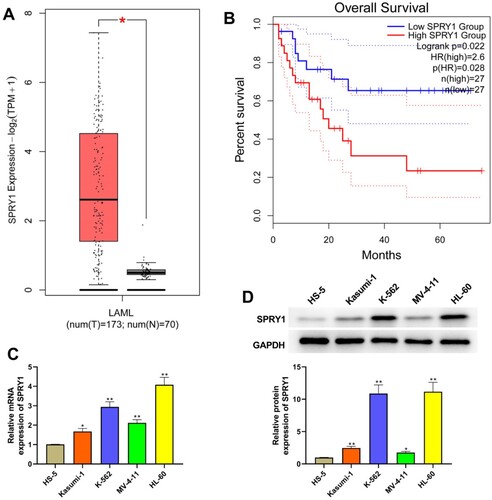
As seen in (a), the analysis of TCGA showed that SPRY1 expression was significantly increased in patients with AML. Moreover, TCGA database also confirmed that the patients with AML having high SPRY1 expression has a bad prognosis ((b)). Subsequently, we also investigated the expression of SPRY1 in myeloid leukemia cells by qRT-PCR and western blot. The results of (c,d) showed that the mRNA and protein expression of SPRY1 was increased in Kasumi-1, K-562, MV-4-11 and HL-60 cells relative to HS-5 cells.
Figure 1. The expression of SPRY1 was upregulated in AML and relates to the prognosis of AML. (a) The expression of SPRY1 in AML from TCGA. (b) Kaplan–Meier curve of AML clinical outcome for SPRY1 from TCGA. cC) The mRNA expression of SPRY1 in HS-5, Kasumi-1, K-562, MV-4-11 and HL-60 cells was detected by qRT-PCR. (d) The protein expression of SPRY1 in HS-5, Kasumi-1, K-562, MV-4-11 and HL-60 cells was determined with western blot. *P < .05, compared with normal group (A); *P < .05, **P < .01, compared with HS-5 cells group (c and d). The error bars represent the mean ± SD of three independent experiments.
SPRY1 facilitates the proliferation of K-562 and HL-60 cells
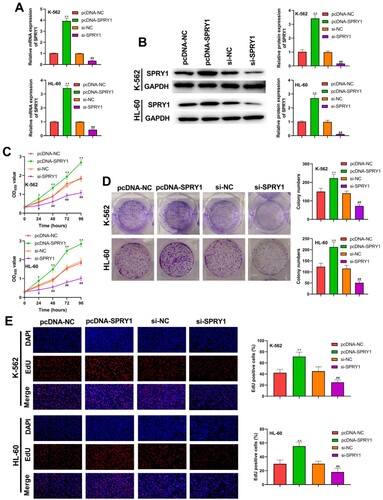
Following the transfection of K-562 and HL-60 cells, the transfection efficiency was subsequently determined by qRT-PCR and western blot, as shown in (a,b). The proliferation of K-562 and HL-60 cells was assessed by MTT, colony-formation and EdU assays ((c–e)). Their results confirmed that SPRY1 overexpression significantly increased cell viability, colony numbers and EdU-positive cells in K-562 and HL-60 cells. On the contrary, the cell viability, colony numbers and EdU-positive cells was markedly decreased by SPRY1 knockdown. Altogether, these results suggested that SPRY1 facilitates the proliferation of K-562 and HL-60 cells.
Figure 2. SPRY1 facilitated the proliferation of K-562 and HL-60 cells. (a) After 48 h of transfection, the mRNA expression of SPRY1 in K-562 and HL-60 cells was detected by qRT-PCR. (b) After 48 h of transfection, the protein expression of SPRY1 in K-562 and HL-60 cells was analyzed by western blot. (c) After 48 h of transfection, the viability of K-562 and HL-60 cells was measured by MTT assay. (d) After 48 h of transfection, the colony numbers of K-562 and HL-60 cells were tested by colony-formation assay. (e) After 48 h of transfection, the proliferation of K-562 and HL-60 cells was tested using EdU assay. *P < .05, **P < .01, compared with pcDNA-NC group; #P < .05, ##P < .01, compared with si-NC group. The error bars represent the mean ± SD of three independent experiments.
SPRY1 facilitates cell cycle changes from G1 phase to S phase in K-562 and HL-60 cells
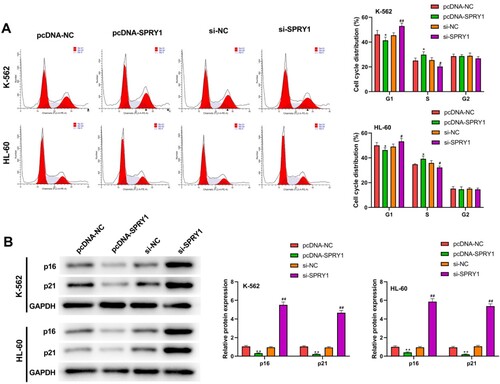
The results of (a) demonstrated that SPRY1 overexpression significantly decreased the cell proportion at G1 phase, and strikingly increased the cell proportion at S phase in both K-562 and HL-60 cells. Conversely, SPRY1 knockdown resulted in the conspicuous upregulation of cell proportion at G1 phase and the noticeable downregulation of S phase cell percentage. In addition, we also detected the expression of p16 and p21 by western blot ((b)). The results showed that the expressions of p16 and p21 were significantly decreased by SPRY1 overexpression, but increased by SPRY1 knockdown in K-562 and HL-60 cells. The above results revealed that SPRY1 may facilitate cell cycle changes from G1 phase to S phase in K-562 and HL-60 cells.
Figure 3. SPRY1 facilitated the cell cycle changes from G1 phase to S phase in K-562 and HL-60 cells. (a) After 48 h of transfection, the cell cycle of K-562 and HL-60 cells was detected by flow cytometry. (b) After 48 h of transfection, the expressions of p16 and p21 in K-562 and HL-60 cells were measured by western blot. *P < .05, **P < .01, compared with pcDNA-NC group; #P < .05, ##P < .01, compared with si-NC group. The error bars represent the mean ± SD of three independent experiments.
SPRY1 suppresses the apoptosis of K-562 and HL-60 cells
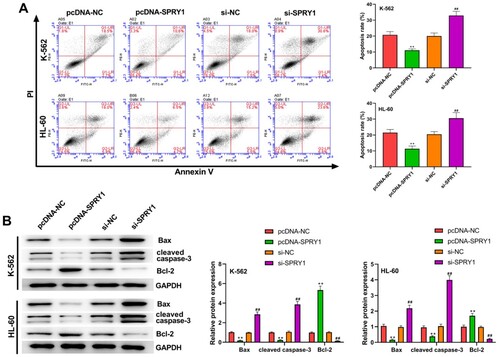
To further investigate the effects of SPRY1 on the apoptosis of K-562 and HL-60 cells, flow cytometry was carried out ((a)). The experimental results confirmed that the apoptosis of K-562 and HL-60 cells was significantly inhibited by SPRY1 overexpression and promoted by SPRY1 knockdown. Moreover, the experimental results of western blot showed that the expression of Bax and cleaved caspase-3 was markedly reduced by SPRY1 overexpression, while Bcl-2 expression was enhanced a lot by SPRY1 knockdown. Meanwhile, SPRY1 knockdown significantly elevated the expression of Bax and cleaved caspase-3, but reduced Bcl-2 expression in K-562 and HL-60 cells. Taken together, these results indicated that SPRY1 may suppress the apoptosis of K-562 and HL-60 cells.
Figure 4. SPRY1 suppressed the apoptosis of K-562 and HL-60 cells. (a) After 48 h of transfection, the apoptosis of K-562 and HL-60 cells was analyzed with flow cytometry. (b) After 48 h of transfection, the expressions of Bax, cleaved caspase-3 and Bcl-2 in K-562 and HL-60 cells were measured by western blot. **P < .01, compared with pcDNA-NC group; ##P < .01, compared with si-NC group. The error bars represent the mean ± SD of three independent experiments.
SPRY1 activates Hedgehog signaling pathway in K-562 and HL-60 cells
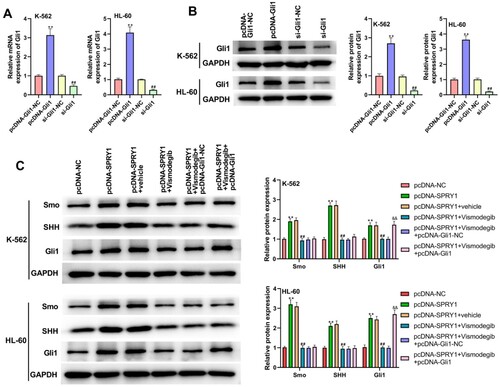
As shown in (a), GSEA confirmed that the high SPRY1 expression was positively associated with the ‘Hedgehog signaling pathway’. To validate this hypothesis, the effects of SPRY1 on the expressions of Smo, SHH and Gli1 were investigated in K-562 and HL-60 cells by western blot. The experimental results showed that the expressions of Smo, SHH and Gli1 were significantly increased by SPRY1 overexpression, but decreased by SPRY1 knockdown ((b)). Moreover, the treatment of Cyclopamine reversed the function of SPRY1 overexpression on the expressions of Smo, SHH and Gli1 ((b)). They suggested that SPRY1 might activate the Hedgehog signaling pathway in K-562 and HL-60 cells. To further confirm this conclusion, another Hedgehog pathway inhibitor (Vismodegib) was treated into K-562 and HL-60 cells. As shown in (a,b), the transfection efficiency was determined by qRT-PCR and western blot. Likewise, the treatment of Vismodegib also reversed the effect of SPRY1 overexpression on the expressions of Smo, SHH and Gli1 ((c)). Moreover, the expression of Gli1 in pcDNA-SPRY1 + Vismodegib + pcDNA-Gli1 group was elevated compared with that in pcDNA-SPRY1 + Vismodegib + pcDNA-Gli1-NC group ((c)). All these results together confirmed that SPRY1 could activate the Hedgehog signaling pathway in K-562 and HL-60 cells.
Figure 5. SPRY1 activated the Hedgehog signaling pathway in K-562 and HL-60 cells. (a) GSEA suggested that the SPRY1 expression was positively associated with the Hedgehog pathway. (b) After 48 h of transfection and Cyclopamine treatment, the expressions of Smo, SHH and Gli1 in K-562 and HL-60 cells were measured by western blot. **P < .01, compared with pcDNA-NC group; ##P < .01, compared with si-NC group; &&P < .01, compared with pcDNA-SPRY1 + vehicle group. The error bars represent the mean ± SD of three independent experiments.
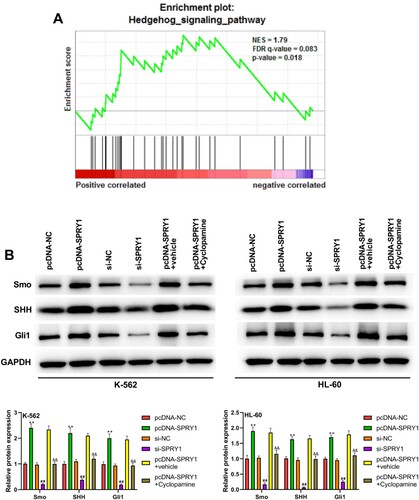
Figure 6. Vismodegib reversed the activation of Hedgehog signaling pathway by SPRY1 overexpression in K-562 and HL-60 cells. (a) After 48 h of transfection, the mRNA expression of Gli1 in K-562 and HL-60 cells was detected using qRT-PCR. (b) After 48 h of transfection, the protein expression of Gli1 in K-562 and HL-60 cells was measured using western blot. (c) After 48 h of transfection and Vismodegib treatment, the expressions of Smo, SHH and Gli1 in K-562 and HL-60 cells were measured by western blot. **P < .01, compared with pcDNA-Gli1-NC group; ##P < .01, compared with si-Gli-NC group (A and B). **P < .01, compared with pcDNA-NC group; ##P < .01, compared with pcDNA-SPRY1 + vehicle group; &&P < .01, compared with pcDNA-SPRY1 + Vismodegib + pcDNA-Gli1-NC group (C). The error bars represent the mean ± SD of three independent experiments.
Gli1 reverses the effect of SPRY1 on the proliferation, cell cycle and apoptosis in K-562 and HL-60 cell
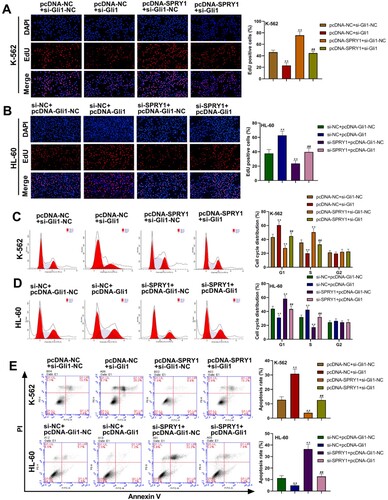
As shown in (a–e), silencing Gli1 significantly decreased the cell proliferation, increased the cell proportion at G1 phase and decreased the cell proportion at S phase, and elevated cell apoptosis in K-562 cells, but Gli1 overexpression notably increased cell proliferation, decreased the cell proportion at G1 phase and increased the cell proportion at S phase, and reduced cell apoptosis in HL-60 cells. Moreover, the phenotypes presented with SPRY1 overexpression were abrogated by concomitant Gli1 silencing in K-562 cells ((a,c,e)). Conversely, the phenotypes seen with SPRY1 silencing were rescued by Gli1 overexpression in HL-60 cells ((b,d,e)). These results suggested that Gli1 could reverse the effect of SPRY1 on the proliferation, cell cycle and apoptosis in K-562 and HL-60 cell.
Figure 7. Gli1 reversed the effect of SPRY1 on the proliferation, cell cycle and apoptosis in K-562 and HL-60 cell. (a) After 48 h of co-transfection, the proliferation of K-562 cells was tested using EdU assay. (b) After 48 h of co-transfection, the proliferation of HL-60 cells was tested using EdU assay. (c) After 48 h of co-transfection, the cell cycle of K-562 cells was detected by flow cytometry. (d) After 48 h of co-transfection, the cell cycle of HL-60 cells was detected by flow cytometry. (e) After 48 h of co-transfection, the apoptosis of K-562 and HL-60 cells was analyzed with flow cytometry. **P < .01, compared with pcDNA-NC + si-Gli1-NC group; ##P < .01, compared with pcDNA-NC + si-Gli1 group or pcDNA-SPRY1 + si-Gli1-NC group. The error bars represent the mean ± SD of three independent experiments.
Discussion
Patients with AML often suffer from severe infection, anemia and easy bleeding, due to the loss of healthy blood cells [Citation10,Citation11]. Conventional chemotherapy for patients with AML is partially effective, but not in all patients. Therefore, identifying the new biomarkers and exploring the pathogenesis of AML is urgent to improve the disease surveillance for patients with AML. In this study, we revealed that SPRY1 could facilitate cell proliferation and cell cycle progression, and suppress cell apoptosis via activating the Hedgehog pathway in AML.
SPRY1 function in cancers has proven elusive, and it is likely dependent on tumor type and genetic context. On the one hand, SPRY proteins can function as tumor suppressors in different types of human tumors including prostate cancer, ovarian cancer and liver cancer, where the expressions of SPRY proteins are downregulated [Citation7,Citation12,Citation13]. However, on the other hand, increasing studies have suggested that the upregulation of SPRY proteins, including SPRY1, could facilitate the progression of some cancers. For example, the overexpression of SPRY1 promotes triple-negative breast cancer malignancy through enhancing EGF-mediated mesenchymal phenotype [Citation5]. Schaaf et al. [Citation14] have indicated that silencing of SPRY1 could trigger complete regression of rhabdomyosarcoma tumors carrying a mutated RAS gene. Montico and co-workers have identified that the loss of SPRY1 could inhibit the growth of BRAFV600-mutant cutaneous melanoma and improve the response to targeted therapy [Citation15]. The analysis of TCGA database revealed that the SPRY1 expression was significantly upregulated in patients with AML. The present study also confirmed that SPRY1 was highly expressed in AML cells relative to human bone marrow stromal cells HS-5. Thus, SPRY1 might be related to the development and progression of AML. Then, to confirm this hypothesis, we investigated the effects of SPRY1 on cell proliferation, cell cycle and cell apoptosis in AML. Our data revealed that SPRY1 overexpression significantly facilitated cell proliferation and cell cycle progression, and suppressed cell apoptosis. On the contrary, SPRY1 knockdown notably inhibited cell proliferation and cell cycle progression, and promoted cell apoptosis in AML.
The Hedgehog pathway was first discovered by Nusslein-Volhard and Wieschaus in 1980 through a large gene screening in Drosophila [Citation16]. Since then, the Hedgehog pathway has been implicated in the modulation of differentiation, proliferation, tissue polarity, stem cell population and carcinogenesis [Citation17]. The canonical Hedgehog pathway is dependent upon the three types of human Hedgehog ligands (Sonic Hedgehog (SHH), Indian Hedgehog (IHH) and Desert Hedgehog (DHH)) and consists of two receptors (Patched (PTCH) and Smoothened (Smo)) [Citation18,Citation19]. The activation of Smo can further activate Glioma (Gli) zinc finger transcription factors (Gli1-3), and then the activated Gli is translocated into the nucleus and binds the target DNA to express specific genes [Citation20,Citation21]. At present, Gli1 has been reported to be dysregulated in multiple malignancies and promote cancer progression [Citation22,Citation23]. More and more studies have suggested that aberrant activation of Hedgehog signaling drives tumor initiation and maintenance [Citation23–25]. Moreover, the Hedgehog pathway is evidently activated in AML and plays a role in the survival of patients with AML [Citation21,Citation26]. In recent years, some Smo antagonists have been confirmed to be beneficial for the patients with AML [Citation27,Citation28]. Additionally, GSEA confirmed that the high SPRY1 expression was positively associated with the ‘Hedgehog signaling pathway’. In our study, to confirm whether the effect of SPRY1 on AML via the Hedgehog pathway, the expressions of Smo, SHH and Gli1 were measured by western blot in AML cells. Our results demonstrated that SPRY1 overexpression significantly activated the Hedgehog pathway in AML cells. Moreover, we also confirmed that the function of SPRY1 overexpression on the proliferation, cell cycle and apoptosis was reversed by Gli1 silencing in K-562 cells, and the function of SPRY1 silencing on the proliferation, cell cycle and apoptosis was reversed by Gli1 overexpression in HL-60 cells.
Taken together, the present study provided evidence indicating that SPRY1 could facilitate cell proliferation and cell cycle progression, and suppress cell apoptosis via activating the Hedgehog pathway in AML. Our findings indicated that SPRY1 may be a potential therapeutic strategy for AML in future.
Authors’ contributions
Guiyang Lv conceptualised and designed the study and wrote the manuscript; Yuanyuan Wang and ChunXiao Ji performed the study; Chunlei Shi and Ying Li analysed and interpreted the study; all the authors approved the final manuscript.
Disclosure statement
No potential conflict of interest was reported by the author(s).
Data availability statement
The datasets used and analysed during the current study are available from the corresponding author on reasonable request.
References
- Khwaja A, Bjorkholm M, Gale RE, et al. Acute myeloid leukaemia. Nat Rev Dis Primers. 2016;2:16010–16031.
- Chen L, Mao H, Zhang J, et al. Targeting FLT3 by chimeric antigen receptor T cells for the treatment of acute myeloid leukemia. Leukemia. 2017;31(8):1830–1834.
- De Kouchkovsky I, Abdul-Hay M. Acute myeloid leukemia: a comprehensive review and 2016 update. Blood Cancer J. 2016;6(7):441–450.
- Christofori G. Split personalities: the agonistic antagonist sprouty. Nat Cell Biol. 2003;5(5):377–379.
- He Q, Jing H, Liaw L, et al. Suppression of Spry1 inhibits triple-negative breast cancer malignancy by decreasing EGF/EGFR mediated mesenchymal phenotype. Sci Rep. 2016;6:23216–23228.
- Masoumi-Moghaddam S, Amini A, Wei AQ, et al. Sprouty 1 predicts prognosis in human epithelial ovarian cancer. Am J Cancer Res. 2015;5(4):1531–1541.
- Masoumi-Moghaddam S, Amini A, Ehteda A, et al. The expression of the Sprouty 1 protein inversely correlates with growth, proliferation, migration and invasion of ovarian cancer cells. J Ovarian Res. 2014;7:61–70.
- He X, Wang J, Chen J, et al. lncRNA UCA1 predicts a poor prognosis and regulates cell proliferation and migration by repressing p21 and SPRY1 expression in GC. Mol Ther Nucleic Acids. 2019;18:605–616.
- Chai C, Song LJ, Han SY, et al. MicroRNA-21 promotes glioma cell proliferation and inhibits senescence and apoptosis by targeting SPRY1 via the PTEN/PI3 K/AKT signaling pathway. CNS Neurosci Ther. 2018;24(5):369–380.
- Ley TJ, Miller C, Ding L, et al. Genomic and epigenomic landscapes of adult de novo acute myeloid leukemia. N Engl J Med. 2013;368(22):2059–2074.
- Arber DA, Orazi A, Hasserjian R, et al. The 2016 revision to the world health organization classification of myeloid neoplasms and acute leukemia. Blood. 2016;127(20):2391–2405.
- Fritzsche S, Kenzelmann M, Hoffmann MJ, et al. Concomitant down-regulation of SPRY1 and SPRY2 in prostate carcinoma. Endocr Relat Cancer. 2006;13(3):839–849.
- Jin XL, Sun QS, Liu F, et al. microRNA 21-mediated suppression of Sprouty1 by pokemon affects liver cancer cell growth and proliferation. J Cell Biochem. 2013;114(7):1625–1633.
- Schaaf G, Hamdi M, Zwijnenburg D, et al. Silencing of SPRY1 triggers complete regression of rhabdomyosarcoma tumors carrying a mutated RAS gene. Cancer Res. 2010;70(2):762–771.
- Montico B, Colizzi F, Giurato G, et al. Loss of Spry1 reduces growth of BRAF(V600)-mutant cutaneous melanoma and improves response to targeted therapy. Cell Death Dis. 2020;11(5):392–406.
- Nüsslein-Volhard C, Wieschaus E. Mutations affecting segment number and polarity in drosophila. Nature. 1980;287(5785):795–801.
- Jia Y, Wang Y, Xie J. The Hedgehog pathway: role in cell differentiation, polarity and proliferation. Arch Toxicol. 2015;89(2):179–191.
- Varjosalo M, Taipale J. Hedgehog: functions and mechanisms. Genes Dev. 2008;22(18):2454–2472.
- Pak E, Segal RA. Hedgehog signal transduction: Key players, oncogenic drivers, and cancer therapy. Dev Cell. 2016;38(4):333–344.
- Scales SJ, de Sauvage FJ. Mechanisms of Hedgehog pathway activation in cancer and implications for therapy. Trends Pharmacol Sci. 2009;30(6):303–312.
- Terao T, Minami Y. Targeting Hedgehog (Hh) pathway for the acute myeloid leukemia treatment. Cells. 2019;8(4):312–322.
- Kim TJ, Lee JY, Hwang TK, et al. Hedgehog signaling protein expression and its association with prognostic parameters in prostate cancer: a retrospective study from the view point of new 2010 anatomic stage/prognostic groups. J Surg Oncol. 2011;104(5):472–479.
- Jiang J, Hui CC. Hedgehog signaling in development and cancer. Dev Cell. 2008;15(6):801–812.
- Zhao D, Cui Z. MicroRNA-361-3p regulates retinoblastoma cell proliferation and stemness by targeting hedgehog signaling. Exp Ther Med. 2019;17(2):1154–1162.
- Liu X, Liu J, Zhang X, et al. MiR-520b promotes the progression of non-small cell lung cancer through activating Hedgehog pathway. J Cell Mol Med. 2019;23(1):205–215.
- Shallis RM, Bewersdorf JP, Boddu PC, et al. Hedgehog pathway inhibition as a therapeutic target in acute myeloid leukemia. Expert Rev Anticancer Ther. 2019;19(8):717–729.
- Tibes R, Al-Kali A, Oliver GR, et al. The Hedgehog pathway as targetable vulnerability with 5-azacytidine in myelodysplastic syndrome and acute myeloid leukemia. J Hematol Oncol. 2015;8:114–223.
- Fukushima N, Minami Y, Kakiuchi S, et al. Small-molecule Hedgehog inhibitor attenuates the leukemia-initiation potential of acute myeloid leukemia cells. Cancer Sci. 2016;107(10):1422–1429.