
ABSTRACT
Background: Several studies scatteredly identified the myelodysplastic syndromes’ transcriptomic profiles (MDS). However, the exploration of transcriptional signatures, key signalling pathways, and their association with prognosis and diagnosis in the integrated multiple datasets remains lacking. Methods: We integrated the GSE4619, GSE19429, GSE30195, and GSE58831 microarray datasets of CD34 + cells for identifying the differentially expressed genes (DEGs) in the MDS. The series of bioinformatics methods are applied to identify the key hub genes, gene clusters, prognostic hub genes, and genes associated with diagnostic efficacy. Finally, we validated the expression differences of hub genes in the GSE114922 dataset. Results: We explored the DEGs related to gene ontology enrichment and KEGG pathways. We identified significant hub genes, including 168 upregulated hub genes (such as STAT1, IFIH1, EPRS, GRB2, RAC2, MAPK14, CASP1, and SPI1) and 52 downregulated hub genes (such as CREBBP, HIF1A, PIK3CA, EZH2, PIK3R1, MDM2, IRF4, CXCR4, PCNA, and CD19) in the MDS. In addition, we identified six significant molecular complex detection (MCODE)-derived upregulated gene clusters and one downregulated gene cluster, respectively. Moreover, we found that the higher expression level of MX2, GBP2, PXN, IFI44, FDXR, PLCB2, ASS1, ERCC4, PML, and RRAGD and the lower expression level of CD19, PAX5, TCF3, LEF1, NUSAP1, and TIMELESS hub genes are significantly correlated with shorter survival times of MDS patients. Furthermore, the area value under the ROC curve (AUC) of PXN, FDXR, PLCB2, PML, CD19, PAX5, and LEF1 prognostic genes are more than 0.80, indicating that these genes could be effectively used for the diagnostic efficacy of MDS patients. Conclusions: Identifying key hub genes and their association with the prognosis and diagnostic efficacy may provide substantial clues for the treatment and diagnosis of MDS patients.
1. Introduction
The most common malignant blood disorder is myelodysplastic syndromes (MDS) characterized by dysfunctional haematopoiesis [Citation1]. The major molecular cause of MDS is genetic instability, which in turn transformed into acute myeloid leukaemia (AML) in a larger number of cases [Citation1]. MDS is frequently occurring in older males and in other individuals who are earlier exposure to cytotoxic therapy [Citation2]. Some previous studies demonstrated the genetic abnormalities and molecular pathogenesis of MDS patients [Citation3–6]. It has been reported that the pathogenesis, initiation of disease, disease progression, and heterogeneity of MDS are crucially associated with the genetic abnormalities [Citation3]. The deregulated transcriptomes have a greater contribution to the development of MDS [Citation4]. The primary hallmark of MDS development is genes or chromosomal changes, copy-number alterations, and somatic mutations [Citation6]. For example, Ying le demonstrated that the dysfunctional genes and signalling pathways are altered during the progression of MDS [Citation5]. Aberrantly expressed transcriptomes are substantially associated with the clinical outcome of MDS patients [Citation4]. Autophagy-associated genes predicted the poor prognosis of MDS patients [Citation7]. Also, deregulated metabolic genes are correlated with poor prognosis of MDS patients [Citation8]. These MDS-associated studies provided a clue that the deregulated and genetically altered transcriptomes are associated with the pathogenesis, development, progression, and clinical outcomes of the MDS patients.
Herein, a meta-analysis integrated the four microarray gene expression datasets of MDS to identify the differentially expressed genes (DEGs). Then, we explored the functional enrichment analysis, included biological processes, molecular functions, cellular components, and KEGG pathways that are significantly associated with the upregulated and downregulated genes, respectively. In addition, we constructed the protein–protein interaction (PPI) network of DEGs and identified the key hub genes based on the degree of interaction of DEGs. We investigated the expression validation of top hub genes in the independent datasets of MDS patients. Moreover, we explored the association of hub genes with the survival prognosis of MDS patients. Finally, we investigated the diagnostic efficacy of prognostic hub genes in MDS patients.
2. Methods and materials
2.1 Datasets
We searched the NCBI gene expression omnibus (GEO) database (https://www.ncbi.nlm.nih.gov/geo/) using the keywords ‘myelodysplastic syndromes ‘, ‘bone marrow’, ‘CD34 + cells’ ‘ CD34 + cells in MDS’, ‘bone marrow in MDS’ and ‘transcriptomes in MDS’, and identified a five gene expression datasets of CD34 + cells that are associated with MDS of human. We downloaded and integrated the GSE4619 (n = 66) [Citation9], GSE19429 (n = 200) [Citation10], GSE30195 (n = 19) [Citation11], and GSE58831 (n = 176) [Citation4] to identify the DEGs in the MDS. The platform of these datasets is Affymetrix human genome U133 plus 2.0 array. The integrated dataset (combining four datasets) has 461 samples, including 412 MDS samples and 49 healthy controls. Then, we used the GSE114922 (n = 90) [Citation12] for validating the expression differences of key genes between the MDS and control samples. The platform of the GSE114922 is GPL20301 (Illumina HiSeq 4000 (Homo sapiens)). All data were transformed into log2-base normalization. For analyzing the survival differences between the two groups of patients, we downloaded the clinical data of GSE58831[Citation4].
2.2 Identification of differentially expressed genes (DEGs)
We used the web tool NetworkAnalyst software [Citation13] to identify the DEGs between MDS and normal samples. The multiple probes of a single gene were averaged and normalized by log2 normalization. We reduced the batch effects of multiple datasets by using the ComBat method [Citation14]. A total of 19,547 common genes were found after integrating the four datasets. We employed the R package ‘limma’ to identify the significant DEGs between MDS and normal samples [Citation15]. We identified the DEGs with a threshold absolute value of combined effect size (ES) >0.585 and adjusted P-value≤0.05.
2.3 Gene ontology and gene-set enrichment analysis
We performed the DEGs’ functional and gene-set enrichment analysis by using the GSEA [Citation16]. We used the GSEA tool for identifying the gene ontology terms and KEGG pathways for the significant upregulated and downregulated DEGs in the MDS. The biological processes, cellular components, molecular functions, and KEGG [Citation17] pathways that are significantly associated with the upregulated DEGs and the downregulated DEGs were identified, respectively. The FDR-value < 0.05, calculated by the Benjamini – Hochberg method [Citation18], was considered significant when selecting the functionally enriched terms.
2.4 Identifying hub genes and gene clusters from the protein-protein interaction (PPI) network of DEGs
We constructed the PPI network using the STRING database to understand better the regulatory relationship among the identified DEGs [Citation19]. To determine the rank of hub genes, we used Cytoscape plug-in tool cytoHubba [Citation20]. Hub genes were identified based on the degree of interactions with their neighbour genes. To construct the PPI network of DEGs, we selected the minimum required interaction score of 0.40. Hub genes were defined as a gene that was connected to a minimum of 20 other DEGs in the original PPI. We visualize the PPI networks by utilizing the Cytoscape 3.6.1 software A Cytoscape plug-in molecular complex detection (MCODE) was used to detect the significant modules from the original PPI network [Citation21]. We identified the significant modules based on the MCODE score and node number. The threshold of the MCODE analysis was MCODE score > 5.0, Node Score Cut-off: 0.2, Haircut: true, K-Core: 2, and maximum depth from Seed: 100.
2.5 Validation of Hub gene expression levels in the independent dataset
The expression levels differences of top hub genes were further validated using the GSE114922 (n = 90) [Citation12] of MDS patients. The GSE114922 is RNA-sequencing data that was performed on bone marrow CD34 + hematopoeitic stem and progenitor cells from patients with MDS (n = 82) and healthy controls (n = 8). We used the R package ‘limma’ to identify the significant DEGs between MDS and healthy samples [Citation15]. The expression differences of hub genes with P < 0.05 were considered statistically significant between the two groups.
2.6 Survival analysis of Hub genes
We utilized the R package ‘survival’ to investigate the survival prognosis of MDS patients. We compared the overall survival (OS) of MDS patients classified based on the expression levels of all hub genes (High expression group > mean > Low expression group). Kaplan-Meier survival curves were used to show the survival differences, and the log-rank test was utilized to evaluate the significance of survival differences. The prognostic roles of screened hub genes in the MDS were analyzed using the expression and clinical data of GSE58831[Citation4]. Cox P< 0.05 was taken as the significant between two groups of MDS patients.
2.7 Diagnostic efficacy evaluation for the prognostic hub genes in the MDS
To evaluate the diagnostic values of the prognostic key upregulated and downregulated hub genes, the receiver operating characteristic (ROC) curve was plotted and the area under the ROC curve (AUC) was calculated using the ‘pROC’ R package [Citation22], indicating the capability to distinguish MDS and healthy control. The diagnostic roles of screened hub genes in the MDS were analyzed using the expression data of GSE58831[Citation4]. The more excellent AUC value of individual genes indicated the differences between MDS and normal samples, and the key gene with AUC > 0.5 in the MDS datasets was defined as a diagnostic efficiency of the gene [Citation23].
3. Results
3.1 Identification of DEGs in MDS with the integration of four gene expression data
In the integrated datasets, we explored 2404 differentially expressed genes (DEGs), which included 1619 upregulated (Supplementary Table S1) and 785 downregulated (Supplementary Table S2) genes in the MDS datasets when compared with healthy control. The top (the highest combined effect size (ES)) significantly upregulated 25 genes (such as DENND2D, SMIM20, KCNE3, TGDS, ALDH3B1, SNX3, PLEKHA8P1, CDC16, E2F6, RPS27L, COA6, LYL1, BNIP3, and CHCHD10) are displaying in . In addition, the top 25 downregulated genes (such as OR7A5, GPR176, IRF4, ARPP21, IGHV5-78, LRIG1, AKAP12, DUSP26, MME, RAG1, SH2D4B, and LDLRAD4) are displayed in .
Table 1. The top upregulated DEGs in MDS with relative to the healthy control.
Table 2. The top downregulated DEGs in MDS with relative to the healthy control.
3.2 Bone marrow of CD34+ cells-derived transcriptomes are associated with gene ontology and the enrichment of KEGG pathways
We used the GSEA tool to identify the enriched gene ontology terms and KEGG pathways that were associated with identified DEGs ( and ). The identified gene ontology included biological processes, cellular components, and molecular functions (Figure 1A and 1B). The upregulated genes are significantly associated with the enrichment of biological processes (Such as small molecule metabolic process, cellular macromolecule localization, establishment of protein localization, protein containing complex subunit organization, intracellular transport, regulation of intracellular signal transduction, immune effector process, lipid metabolic process, and positive regulation of biosynthetic process) (Supplementary Table S3), cellular components (mitochondrion, envelope, vacuole, mitochondrial envelope, endosome, organelle subcompartment, Golgi apparatus, mitochondrial matrix, Golgi apparatus subcompartment, endoplasmic reticulum) (Supplementary Table S4), and molecular functions (identical protein binding, enzyme binding, transcription regulator activity, DNA binding transcription factor activity, transition metal ion binding, protein dimerization activity, and oxidoreductase activity) (Supplementary Table S5). Besides, downregulated genes are significantly associated with the enrichment of biological processes (Supplementary Table S6), cellular components (Supplementary Table S7), and molecular functions (Supplementary Table S8). Figure 1A and Figure 1B illustrated the top ten upregulated and downregulated GO, respectively.
Figure 1. Significantly enriched GOs that are associated with CD34 + cells-derived DEGs in the MDS. A. Significantly enriched GOs that are associated with CD34 + cells-derived upregulated genes in the MDS. B. Significantly enriched GOs that are associated with CD34 + cells-derived Downregulated genes in the MDS.
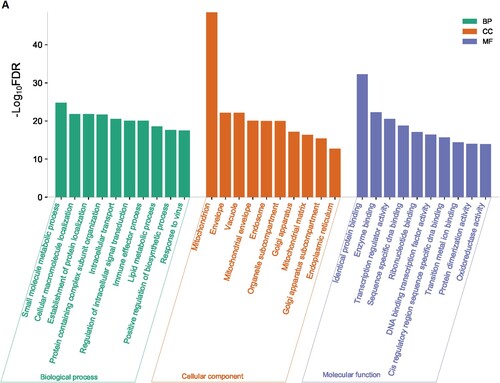
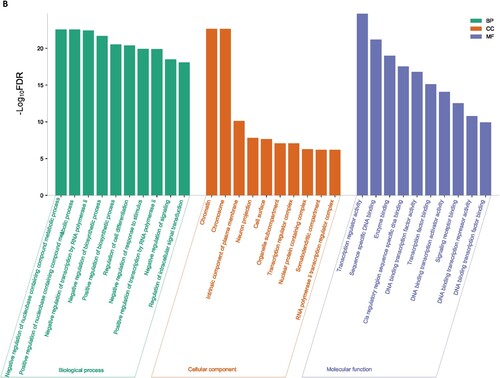
Figure 2. Significantly enriched KEGG pathways that associated with CD34 + cells-derived DEGs in the MDS. A. The top 25 enriched KEGG pathways are considerably associated with upregulated genes. B. The KEGG pathways that significantly associated with downregulated genes.
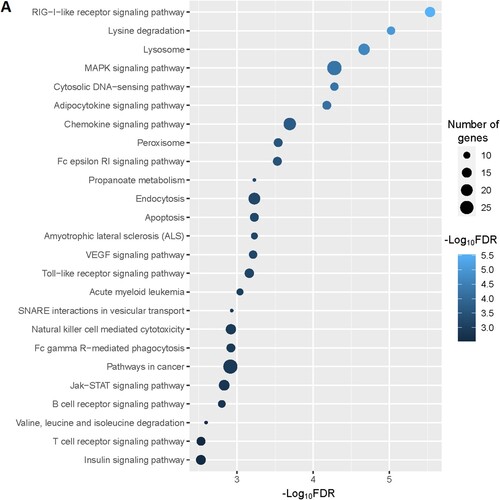
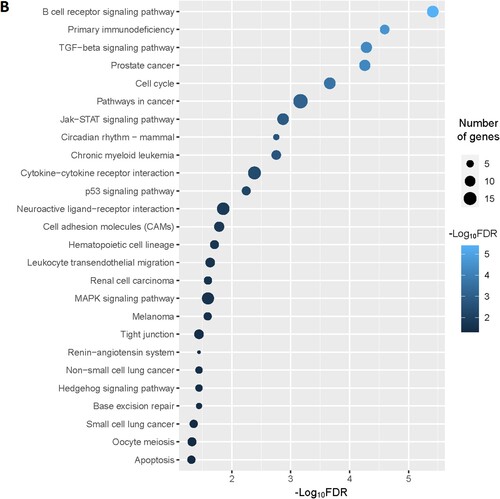
Moreover, we identified the significantly enriched KEGG pathways () for upregulated and downregulated genes, respectively. The upregulated pathways are mainly associated with immune regulation (RIG-I-like receptor signaling pathway, adipocytokine signaling pathway, chemokine signaling pathway, Fc epsilon RI signaling pathway, Toll-like receptor signaling pathway, Fc gamma R-mediated phagocytosis, natural killer cell mediated cytotoxicity, B cell receptor signaling pathway, T cell receptor signaling pathway, epithelial cell signaling in Helicobacter pylori infection, leukocyte transendothelial migration, NOD-like receptor signaling pathway, cytokine-cytokine receptor interaction), metabolisms (lysine degradation, propanoate metabolism, valine, leucine and isoleucine degradation, fatty acid metabolism, beta-Alanine metabolism, butanoate metabolism, Fructose and mannose metabolism, glycerolipid metabolism, glycerophospholipid metabolism, inositol phosphate metabolism, limonene and pinene degradation, amino sugar and nucleotide sugar metabolism, alanine, aspartate and glutamate metabolism, glycosaminoglycan biosynthesis – chondroitin sulfate, sulfur metabolism), cellular signaling and development (lysosome, MAPK signaling pathway, cytosolic DNA-sensing pathway, peroxisome, apoptosis, endocytosis, VEGF signaling pathway, Jak-STAT signaling pathway, homologous recombination, Wnt signaling pathway, phosphatidylinositol signaling system, oxidative phosphorylation, tight junction, nucleotide excision repair, ErbB signaling pathway, basal transcription factors), cancers (acute myeloid leukemia, pathways in cancer, and pancreatic cancer) (A and Supplementary Table S9). Besides, we identified significantly enriched KEGG pathways that are associated with downregulated genes in the MDS. Some of these downregulated pathways are B cell receptor signaling pathway, primary immunodeficiency, cell cycle, circadian rhythm – mammal, cytokine-cytokine receptor interaction, p53 signaling pathway, neuroactive ligand–receptor interaction, cell adhesion molecules (CAMs), hematopoietic cell lineage, renin-angiotensin system, Oocyte meiosis, and apoptosis (B and Supplementary Table S10).
3.3 STRING-based PPI analysis identifying key hub genes and modules in the MDS
We constructed the PPI of all significant upregulated and downregulated genes to identify the key hub genes and significant gene modules in the MDS. The STRING-based PPI information was inputted into the Cytoscape for further analysis. We revealed that the 1446 upregulated genes are involved with the PPI network (Supplementary Table S11) and 632 downregulated genes are (Supplementary Table S12) associated with the PPI network. Then, we investigated the rank of all upregulated and downregulated genes based on the Cytoscape plug-in CytoHubba tool. We identified the168 upregulated hub genes (minimum degree of interaction is 20 with other neighbours DEGs) (Supplementary Table S11) and 52 downregulated hub genes (minimum degree of interaction is 20 with other neighbours DEGs) (Supplementary Table S12) in the MDS. The PPI networks of upregulated and downregulated hub genes were illustrated in A and B, respectively. The top ten upregulated hub genes are STAT1, STAT3, IFIH1, EPRS, GRB2, RAC2, MAPK14, CASP1, SPI1, and TBK1. The identified top ten downregulated hub genes are CREBBP, HIF1A, PIK3CA, EZH2, PIK3R1, MDM2, IRF4, CXCR4, PCNA, and CD19. The top upregulated and downregulated hub genes and their regulatory status, names, the rank of hub genes, degree of interaction, combined ES, and adjusted P values are shown in .
Figure 3. Identification of the hub genes that are associated with PPI in the MDS. A. The interaction of 168 upregulated hub genes identified from the PPI in MDS. B. The interaction of 52 downregulated hub genes identified from the PPI in MDS. The color intensity of nodes indicates the interconnected degree of hub genes. The more red color indicated the higher the degree of interactions.
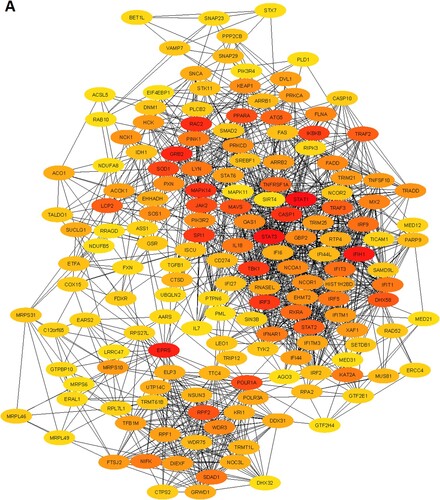
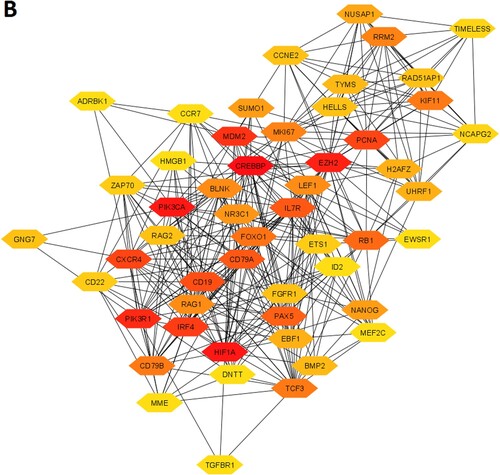
Table 3. The top ten upregulated and top ten downregulated hub genes were extracted from the original PPI. The hub genes were identified by using the Cytoscape plug-in CytoHubba tool.
Furthermore, we extracted the significant gene modules from the original PPI networks by using Cytoscape plug-in MCODE tool. We found the 6 essential gene modules/clusters (MCODE score > 5.0) for the upregulated genes in the MDS () (Supplementary Table S13). The 42 genes are interconnected in cluster 1, including XAF1, OAS1, IFIT1, MX2, IFIH1, GBP2, STAT1, IRF9, IFIT3, and IFITM1 are the top interconnected genes (A and Supplementary Table S13). The enrichment analysis revealed the 3 KEGG pathways (RIG-I-like receptor signaling pathway, Toll-like receptor signaling pathway, and Jak-STAT signaling pathway) that are associated with the genes of cluster 1 (). In cluster 2, some of the mitochondrial ribosomal proteins (MRPS6, MRPL46, MRPS10, MRPS30, and MRPL40) are interconnected in the network (B and Supplementary Table S13). The 16 genes, including RXRA, MED8, NCOA1, MED18, FAM120B, MED31, MED20, and MED21 are interconnected in cluster 3 (C and Supplementary Table S13). The enrichment analysis identified the 4 KEGG pathways (apoptosis, natural killer cell mediated cytotoxicity, cytokine-cytokine receptor interaction, and p53 signaling pathway) that are significantly correlated with cluster 3 (). Cluster 4 has 36 interconnected genes, including IKBKB, CASP1, TBK1, TNFRSF1A, TRAF2, FADD, TICAM1, TRADD, MLKL, and CASP10 (D and Supplementary Table S13). The significantly enriched 23 KEGG pathways that are associated with cluster 4 are shown in . The interconnected nodes of cluster 5 (E and Supplementary Table S13) and cluster 6 (F and Supplementary Table S13) are also shown in . The 36 KEGG pathways (such as peroxisome, oxidative phosphorylation, endocytosis, melanogenesis, B cell receptor signaling pathway, Fc epsilon RI signaling pathway, chemokine signaling pathway, Fc gamma R-mediated phagocytosis, T cell receptor signaling pathway, natural killer cell mediated cytotoxicity, acute myeloid leukemia, NOD-like receptor signaling pathway, focal adhesion, PPAR signaling pathway) are significantly enriched in cluster 6 ().
Figure 4. MCODE-derived significant Clusters of upregulated DEGs in the MDS
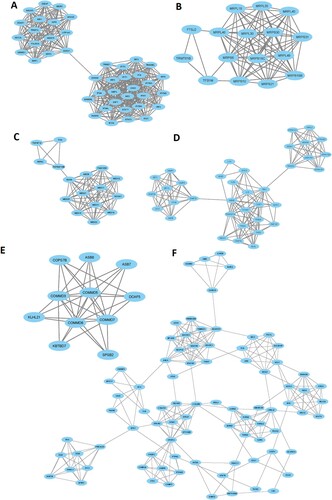
Table 4. The enriched KEGG pathways in the significant clusters of upregulated genes in the MDS. The pathways are identified using the GSEA tool.
In addition, we investigated the significant gene clusters for the downregulated genes. We revealed that one cluster (Supplementary Table S13), with an MCODE score of 13.935, is significantly derived from the original PPI of downregulated genes. The 32 genes are interconnected in the cluster 1 network (A and Supplementary Table S13). The highly connected nodes in cluster 1 are EZH2, HELLS, MKI67, CD19, PAX5, RRM2, TCF3, EBF1, CD79A, VPREB1, KIF11, NUSAP1, E2F8, and IL7R. We found that the 3 pathways, included primary immunodeficiency, B cell receptor signaling pathway, and hematopoietic cell lineage are significantly enriched in cluster 1 (B).
Figure 5. MCODE-derived significant Cluster of downregulated genes in the MDS (A) and its functional enrichment analysis (B)
3.4 Expression validation of top hub genes in the independent dataset
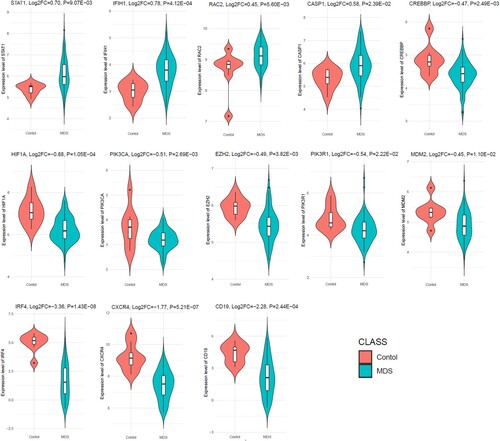
To determine the aberrant expression of MDS-associated hub genes in RNA-sequence data, we investigated the expression level of top ten upregulated and top ten downregulated hub genes in the independent dataset GSE114922. Interestingly, we found that the upregulated STAT1, IFIH1, RAC2, and CASP1 are significantly upregulated in the GSE114922 when compared to the MDS patients with controls (). Besides, the 9 hub genes out of the top ten downregulated hub genes (CREBBP, HIF1A, PIK3CA, EZH2, PIK3R1, MDM2, IRF4, CXCR4, and CD19), are consistently downregulated in the GSE114922 (). This result indicates that the aberrant expression of these key hub genes is associated with the pathogenesis of MDS.
Figure 6. Consistent deregulation of hub genes in the independent dataset.
3.5 Hub genes are associated with poor survival prognosis in the MDS
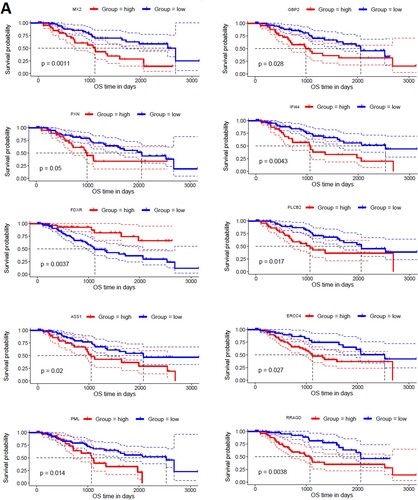
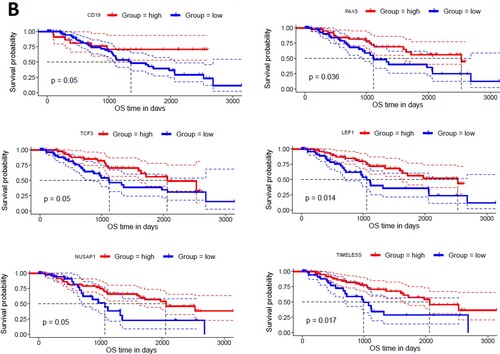
To find the correlation of hub genes with the survival time of MDS patients, we investigated the survival prognosis of 168 upregulated and 52 downregulated hub genes based on the mean expression of individual genes. We found that upregulated hub genes’ expression levels included MX2, GBP2, PXN, IFI44, FDXR, PLCB2, ASS1, ERCC4, PML, and RRAGD are significantly correlated with shorter survival times of MDS patients (A). On the other hand, the lower expression level of downregulated hub genes, including CD19, PAX5, TCF3, LEF1, NUSAP1, and TIMELESS are significantly associated with the shorter survival time of MDS patients (B). Since, these hub genes are involved in the PPI network with other neighbour genes, indicating that the prognostic hub genes are associated with the clinical outcome of MDS patients through the PPI-based signaling in the cellular environment. Interestingly, the functional enrichment analysis revealed that the sixteen hub genes are related to the enrichment of acute myeloid leukemia, melanogenesis, Wnt signaling pathway, chemokine signaling pathway, and pathways in cancer (P < 0.01). Altogether, our analysis revealed that the expression level of CD34 + cells-derived hub-genes is related to MDS pathogenesis and the shorter survival time of MDS patients.
Figure 7. Identifying prognostic hub genes in the MDS. A. Upregulated 10 hub genes are poorly correlated with the survival prognosis of patients’ B. Downregulated 6 hub genes are poorly associated with a survival prognosis of patients.
3.6 Prognostic Hub genes are associated with the diagnostic value in the MDS
We speculate that the prognostic sixteen hub genes (MX2, GBP2, PXN, IFI44, FDXR, PLCB2, ASS1, ERCC4, PML, RRAGD, CD19, PAX5, TCF3, LEF1, NUSAP1, and TIMELESS) have diagnostic value in MDS patients. We used the GSE58831 dataset (n = 176) to validate our hypothesis, and the results showed that the ROC curve of the expression levels of MX2, GBP2, PXN, IFI44, FDXR, PLCB2, ASS1, ERCC4, PML, RRAGD, CD19, PAX5, TCF3, LEF1, NUSAP1, and TIMELESS hub genes showed excellent diagnostic value for MDS patients (n = 159) when compared with normal samples (n = 17) (). The cut-off points, AUC, 95% CI, sensitivity, specificity, PPV, and NPV of these16 genes are illustrated in . The value of area under the ROC curve (AUC) of PXN, FDXR, PLCB2, PML, CD19, PAX5, and LEF1 genes are more than 0.80, indicating that these genes could be effectively used for diagnostic efficacy in the MDS.
Figure 8. Diagnostic value of prognostic hub genes in the MDS. The MDS patients considering the cases and healthy sample is control.
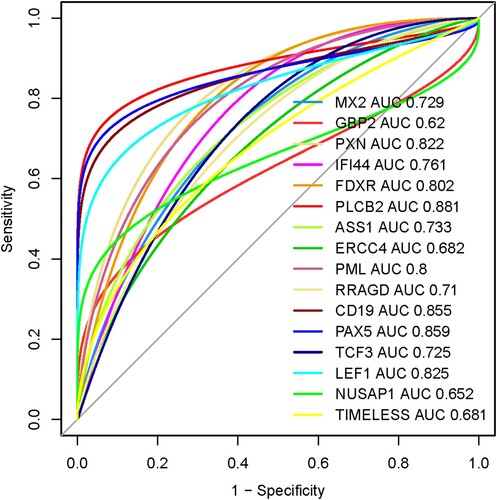
Table 5. The 16 prognostic genes with cut-off points, AUC, 95% CI, sensitivity, specificity, PPV, and NPV.
4. Discussions
Genome-wide expression profiling is the fundamental step to identify the differentially expressed genes in disease conditions [Citation24]. We combine the four microarray gene expression profiling datasets into a single integrated dataset for investigating the differential expression of genes in the MDS relative to the healthy controls. We revealed that the 1619 upregulated (Supplementary Table S1) and 785 downregulated genes (Supplementary Table S2) in the MDS patients by a meta-analysis (Combined ES > 0.585, Adjusted P < 0.05). Previous studies consistently explored that CD34 + cells-derived transcriptomes are associated with MDS and acute myeloid leukemia. For example, the expression level of the ALDH3B1 gene is elevated in the MDS [Citation10]. E2F6, another upregulated gene, is associated with CHK proteins in cell-cycle checkpoint control and consistently deregulated in the MDS [Citation10]. Deregulated expression of IRF4 is associated with acute myeloid leukemia and myelodysplastic syndrome susceptibility [Citation25]. AKAP12, a downregulated gene with tumour suppressor properties, is related to the myeloid malignancies [Citation26].
It was previously reported that the functional enrichment analysis, including gene ontology and the enrichment of pathways, are substantially associated with significant DEGs in the MDS [Citation5,Citation8]. We found that the upregulated and downregulated DEGs are significantly related to various biological processes, cellular components, and molecular functions, respectively (). Since deregulated pathways are critically associated with the molecular pathogenesis of MDS [Citation27], we identified the KEGG pathways that are significantly associated with identified DEGs. The upregulated pathways are mainly involved in immune system deregulation, metabolic abnormalities, and aberrant cellular signalling and developmental process (A and Supplementary Table S9). In addition, the downregulated genes are aberrantly involved with the deregulation of immunity, cancer, and cellular signalling in the MDS (A and Supplementary Table S10). A. Pellagatti et al. demonstrated that the Wnt pathways, immunodeficiency, apoptosis, and chemokine signaling are the deregulated pathways in the MDS [Citation10]. Ying le et al. reported that hematopoietic cell lineage is deregulated in the MDS [Citation5]. B cell receptor signaling pathway is associated with shared gene signature between MDS and AML [Citation28]. Altogether, these results indicated that the aberrantly expressed genes are involved with the deregulation of signaling pathways and key biological functions in the MDS.
Various human diseases are originated from the result of abnormal protein–protein interactions [Citation29]. We constructed and identified the key interacting genes from the PPI network of DEGs (). We found that the STAT1, STAT3, IFIH1, EPRS, GRB2, RAC2, MAPK14, CASP1, and SPI1 were the top upregulated hub genes (Supplementary Table S11) and CREBBP, HIF1A, PIK3CA, EZH2, PIK3R1, MDM2, IRF4, CXCR4, PCNA, and CD19 (Supplementary Table S12) were the top downregulated hub genes in the MDS. Digdem Yoyen-Ermis et al. demonstrated that the STAT3 pathway is activated in the AML and MDS [Citation30]. In stem cells of MDS patients, the master myeloid differentiation – driving transcription factor SPI1 was expressed at higher levels [Citation31]. In our expression validation analysis, we checked the expression differences of the top 10 upregulated and top 10 downregulated hub genes in the independent dataset (GSE114922). Interestingly, we revealed that the thirteen genes are consistently deregulated in the validation cohort (), indicating that the expression of these genes is consistently deregulated in the multiple datasets. Some previous studies reported the consistent results. For example, the elevated IFN-γ/STAT1 signaling is associated with MDS progression and treatment response [Citation32]. Rac2 may play a crucial role in the initial development of myelodysplastic syndrome [Citation33]. The expression of CREBBP is associated with hematopoietic malignancies, including myelodysplastic syndrome (MDS) [Citation34]. Variants in IRF4 related to acute myeloid leukemia and MDS susceptibility [Citation25]. Anke C. Spoo et al. suggested that CXCR4 should be incorporated into the risk assessment of AML patients [Citation35]. The expression level of CD19 is downregulated and one of the crucial genes in the MDS [Citation36]. Since genes with similar characteristics have tended to interact with each other through PPI networks in the diseases/disorders, clustering analysis provides the information to predict human disease-related gene clusters/modules [Citation37]. We investigated the significant gene clusters (MCODE score > 5.0) in the MDS, and we revealed that these gene clusters are substantially related to the enrichment of KEGG pathways in the MDS ( and and Table 4), indicating that these gene clusters are crucially associated with the pathogenesis of MDS.
Furthermore, we analyzed the association of hub genes with the survival prognosis of MDS patients. The upregulation of MX2, GBP2, PXN, IFI44, FDXR, PLCB2, ASS1, ERCC4, PML, and RRAGD hub genes are significantly correlated with shorter survival times of MDS patients (A) and the downregulation of CD19, PAX5, TCF3, LEF1, NUSAP1, and TIMELESS (B) are significantly correlated with the overall survival prognosis of MDS patients. It was stated that the overexpression of PXN is associated with poor prognosis in AML patients [Citation38]. M. A. ElBaiomy et al. concluded that the higher expression level of LEF1 is a favourable prognostic marker in the AML patient risk [Citation39]. Finally, we found that these survival-associated hub genes have diagnostic efficacy in the MDS when compared with healthy control (). Altogether, this study provides the clue that these deregulated sixteen genes (MX2, GBP2, PXN, IFI44, FDXR, PLCB2, ASS1, ERCC4, PML, RRAGD, CD19, PAX5, TCF3, LEF1, NUSAP1, and TIMELESS) may be associated with the prognostic and diagnostic value of MDS patients. The aberrant expression level of CD19 is indicated as the marker of monocytes lineage in acute myelogenous leukemia [Citation40]. In hematolymphoid, it was demonstrated that the lower expression of PAX-5 helps to establish B-cell lineage and increases diagnostic yield [Citation41]. In the myelodysplastic syndromes, downregulation of the LEF1 is associated with disease progression [Citation42].
The major limitation of our study is that the deregulated key genes and networks identified by bioinformatics analysis have not been validated by experimental research in the MDS patients. Another drawback of our study is that MDS is a group of heterogonous diseases, the different classification subgroup and the different prognosis subgroup should have other hub genes. However, we did not identify the hub genes in the different subtypes of MDS patients. Thus, although our findings could provide potential biomarkers for the MDS prognosis and diagnosis, as well as therapeutic targets, further experimental and clinical validation would be warranted to transform these findings into the clinical application of MDS and different subtypes of MDS patients.
5. Conclusions
This bioinformatics analysis provided compelling evidence about the deregulated CD34 + cells-derived hub transcriptomes that are associated with an inferior prognosis and diagnostic efficacy in the MDS patients. The association of these prognostic-hub genes should be experimentally validated in different subtypes of MDS patients. In summary, identifying key hub genes and their association with the prognostic and diagnostic efficacy may provide substantial clues for the diagnosis and treatment of MDS patients.
Authors’ contributions
All authors have contributed to the research concept, design, analysis, and interpretation of the results. All authors read, reviewed, and approved the document's final version.
Supplemental Material
Download MS Excel (224.4 KB)Disclosure statement
No potential conflict of interest was reported by the author(s).
Data availability
The GEO datasets (GSE4619 (n = 66), GSE19429 (n = 200), GSE30195 (n = 19), GSE58831 (n = 176), GSE114922) used in this study were downloaded from The National Biotechnology Information Center Gene (NCBI-Gene) database (https://www.ncbi.nlm.nih.gov/gene).
Additional information
Funding
Related Research Data
References
- Corey SJ, Minden MD, Barber DL, et al. Myelodysplastic syndromes: the complexity of stem-cell diseases. Nat Rev Cancer. 2007;7:118–129.
- Montalban-Bravo G, Garcia-Manero G. Myelodysplastic Syndromes: 2018 Myelodysplastic syndromes: 2018 update on diagnosis, risk-stratification and management. Am J Hematol; 93:129–147.
- Maciejewski JP, Balasubramanian SK. Clinical implications of somatic mutations in aplastic anemia and myelodysplastic syndrome in genomic Age. Hematology. 2017;2017:66–72.
- Gerstung M, Pellagatti A, Malcovati L, et al. Combining gene mutation with gene expression data improves outcome prediction in myelodysplastic syndromes. Nat Commun. 2015;6:5901.
- Le Y. Screening and identification of Key candidate genes and pathways in myelodysplastic syndrome by bioinformatic analysis. PeerJ. 2019;7:e8162.
- Ogawa S. Genetics of MDS. Genetics of MDS; 133:1049–e1059.
- Wang M-J, Liu W-Y, Wang X-Y, et al. Autophagy gene panel-based prognostic model in myelodysplastic syndrome. Front Oncol. 2021;10.
- Hu F, Chen S, Dai Y, et al. Identification of a metabolic gene panel to predict the prognosis of myelodysplastic syndrome. J Cell Mol Med. 2020;24:6373–6384.
- Pellagatti A, Cazzola M, Giagounidis AAN, et al. Gene expression profiles of CD34+ cells in myelodysplastic syndromes: involvement of interferon-stimulated genes and correlation to FAB subtype and karyotype. Blood. 2006;108:337–345.
- Pellagatti A, Cazzola M, Giagounidis A, et al. Deregulated gene expression pathways in myelodysplastic syndrome hematopoietic stem cells. Leukemia. 2010;24:756–764.
- Graubert TA, Shen D, Ding L, et al. Recurrent mutations in the U2AF1 splicing factor in myelodysplastic syndromes. Nat Genet. 2012;44:53–57.
- Pellagatti A, Armstrong RN, Steeples V, et al. Impact of spliceosome mutations on RNA splicing in myelodysplasia: dysregulated genes/pathways and clinical associations. Blood. 2018;132:1225–1240.
- Xia J, Gill EE, Hancock REW. NetworkAnalyst for Statistical, Networkanalyst for statistical, visual and network-based meta-analysis of gene expression data. Nat Protoc. 2015;10:823–844.
- Johnson WE, Li C, Rabinovic A. Adjusting batch effects in microarray expression data using empirical Bayes methods. Biostatistics. 2007;8:118–127.
- Ritchie ME, Phipson B, Wu D, et al. Limma powers differential expression analyses for RNA-sequencing and microarray studies. Nucleic Acids Res. 2015;43:e47–e47.
- Subramanian A, Tamayo P, Mootha VK, et al. Gene Set enrichment analysis: A knowledge-based approach for interpreting genome-wide expression profiles. Proc Natl Acad Sci USA. 2005;102:15545–15550.
- Kanehisa M, Furumichi M, Tanabe M, et al. Temporal self-regulation of transposition through host-independent transposase rodlet formation. Nucleic Acids Res. 2017;45:353–366.
- Benjamini Y, Hochberg Y. Controlling the false discovery rate: A practical and powerful approach to multiple testing. Journal of the Royal Statistical Society: Series B (Methodological)). 1995;57:289–300.
- Szklarczyk D, Gable AL, Lyon D, et al. H3.3K4M destabilizes enhancer H3K4 methyltransferases MLL3/MLL4 and impairs adipose tissue development. Nucleic Acids Res. 2019;47:607–620.
- Chin C-H, Chen S-H, Wu H-H, et al. Cytohubba: identifying Hub objects and Sub-networks from complex interactome. BMC Syst Biol. 2014;8:S11.
- Bader GD, Hogue CWV. An automated method for finding molecular complexes in large protein interaction networks. BMC Bioinformatics. 2003;4:2.
- Robin X, Turck N, Hainard A, et al. Proc: An open-source package for R and S+ to analyze and compare ROC curves. BMC Bioinformatics. 2011;12:77.
- Yang Q, Wang R, Wei B, et al. Candidate biomarkers and molecular mechanism investigation for glioblastoma multiforme utilizing WGCNA. Biomed Res Int. 2018;2018:e4246703.
- Clark NR, Hu KS, Feldmann AS, et al. The characteristic direction: A geometrical approach to identify differentially expressed genes. BMC Bioinformatics. 2014;15:79.
- Wang J, Clay-Gilmour AI, Karaesmen E, et al. Genome-Wide association analyses identify variants in IRF4 associated With acute myeloid leukemia and myelodysplastic syndrome susceptibility. Front Genet. 2021;12:554948.
- Flotho C, Paulun A, Batz C, et al. Akap12, a gene with tumour suppressor properties, Is a target of promoter DNA methylation in childhood myeloid malignancies. Br J Haematol. 2007;138:644–650.
- Pellagatti A, Cazzola M, Giagounidis A, et al. Deregulated gene expression pathways in myelodysplastic syndrome hematopoietic stem cells. Leukemia. 2010;24:756–764.
- Zhang Z, Zhao L, Wei X, et al. Integrated bioinformatic analysis of microarray data reveals shared gene signature between MDS and AML. Oncol Lett. 2018;16:5147–5159.
- Ryan DP, Matthews JM. Protein-Protein interactions in human disease. Curr Opin Struct Biol. 2005;15:441–446.
- Yoyen-Ermis D, Tunali G, Tavukcuoglu E, et al. Myeloid maturation potentiates STAT3-mediated atypical IFN-γ signaling and upregulation of PD-1 ligands in AML and MDS. Sci Rep. 2019;9:11697.
- Saunthararajah Y, Sekeres M, Advani A, et al. Evaluation of noncytotoxic DNMT1-depleting therapy in patients with myelodysplastic syndromes. J Clin Invest. 2015;125:1043–11055.
- Hemmati S, Haque T, Gritsman K. Inflammatory signaling pathways in preleukemic and leukemic stem cells. Front Oncol. 2017;7:265.
- Shao X, Miao M, Qi X, et al. Ras-Proximate-1 GTPase-activating protein and Rac2 May play pivotal roles in the initial development of myelodysplastic syndrome. Oncol Lett. 2012;4:289–298.
- Zhou T, Perez SN, Cheng Z, et al. Context matters: distinct disease outcomes as a result of crebbp hemizygosity in different mouse bone marrow compartments. PLOS ONE. 2016;11:e0158649.
- Spoo AC, Lübbert M, Wierda WG, et al. Cxcr4 Is a prognostic marker in acute myelogenous leukemia. Blood. 2007;109:786–791.
- Zhu Y, Wu L. Identification of latent core genes and pathways associated with myelodysplastic syndromes based on integrated bioinformatics analysis. Hematology. 2020;25:299–308.
- Sun PG, Gao L, Han S. Prediction of human disease-related gene clusters by clustering analysis. Int J Biol Sci. 2011;7:61–73.
- Zhang X, Xiong H, Duan J, et al. High Expression of PXN Predicts a Poor Prognosis in Acute Myeloid Leukemia 2021.
- ElBaiomy MA, Aref S, El Zaafarany M, et al. Prognostic Impact of Lymphoid Enhancer Factor 1 Expression and Serum Galectin.3 in Egyptian AML Patients. Adv Hematol. 2019;2019:2352919), doi:10.1155/2019/2352919.
- Tisone JA, Bohman JE, Theil KS, et al. Aberrant expression of CD19 as a marker of monocytic lineage in acute myelogenous leukemia. Am J Clin Pathol. 1997;107:283–291.
- Desouki MM, Post GR, Cherry D, et al. PAX-5: A valuable immunohistochemical marker in the differential diagnosis of lymphoid neoplasms. Clin Med Res. 2010;8:84–88.
- Pellagatti A, Marafioti T, Paterson JC, et al. Marked downregulation of the granulopoiesis regulatorLEF1is associated with disease progression in the myelodysplastic syndromes. Br J Haematol. 2009;146:86–90.