
ABSTRACT
Purpose
While the prognosis of multiple myeloma (MM) has significantly improved over the last decade because of new treatment options, it remains incurable. Aetiological explanations and biological targets based on genomics may provide additional help for rational disease intervention.
Materials and Methods
Three microarray datasets associated with MM were downloaded from the Gene Expression Omnibus (GEO) database. GSE125364 and GSE39754 were used as the training set, and GSE13591 was used as the verification set. The differentially expressed genes (DEGs) were obtained from the training set, and Gene Ontology (GO) and Kyoto Encyclopedia of Genes and Genomes (KEGG) pathway analyses were performed to annotate their functions. The hub genes were derived from the combined results of a protein–protein interaction (PPI) network and weighted gene coexpression network analysis (WGCNA). The receiver operating characteristic (ROC) curves of hub genes were plotted to evaluate their clinical diagnostic value. Biological processes and signaling pathways associated with hub genes were explained by gene set enrichment analysis (GSEA).
Results
A total of 1759 DEGs were identified. GO and KEGG pathway analyses suggested that the DEGs were related to the process of protein metabolism. RPN1, SEC61A1, SPCS1, SRPR, SRPRB, SSR1 and TRAM1 were proven to have clinical diagnostic value for MM. The GSEA results suggested that the hub genes were widely involved in the N-glycan biosynthesis pathway.
Conclusion
The hub genes identified in this study can partially explain the potential molecular mechanisms of MM and serve as candidate biomarkers for disease diagnosis.
1. Introduction
Multiple myeloma (MM) is the second most common type of cancer in the blood system; it is characterized by abnormal clonal proliferation of malignant plasma cells in bone marrow [Citation1]. It has been reported that nearly 140 000 new cases are diagnosed worldwide each year, and the number of cases of morbidity and mortality in 2019 alone is more than twice that in 1990 [Citation2,Citation3]. Due to the insidious onset of monoclonal gammopathy of undetermined significance (MGUS, a premalignant precursor condition of active MM), a considerable number of patients are diagnosed accidentally when serious complications occur. According to a report, more than 50% of patients presenting with no history of malignancy who required urgent surgery for pathological compression fracture were found to have MM or plasmacytoma [Citation4].
Multiple genetic changes may initiate the process of myeloma and promote its progression [Citation5]. With the development of autologous haematopoietic cell transplantation and new targeted drugs, the overall survival of MM has been considerably prolonged. However, the overall treatment effect in the world is far from satisfactory [Citation2]. First, as a disease of unknown aetiology, the treatment of MM is still largely limited to symptomatic management. Second, under the pressure of drug selectivity, mutations in target genes lead to the development of drug resistance and disease relapse, which has been observed in patients undergoing chimeric antigen receptor T-cell therapy [Citation6]. Third, the absence of efficient diagnostic tools makes early diagnosis difficult for asymptomatic patients, a group that is believed to benefit most from timely intervention [Citation7,Citation8]. Therefore, exploring the aetiology of MM and looking for efficient biomarkers to improve the recognition ability of patients will help to minimize the harm of MM to humans.
Different from traditional research methods, the popularization and application of high-throughput sequencing and the establishment of a global gene database provide broader and necessary data support for the aetiological diagnosis of MM [Citation9]. Meanwhile, the development of bioinformatics technology provides a reliable way to discover key regulatory genes of disease [Citation10]. On this basis, an increasing number of MM-related genes and pathways have been discovered, and some of them have been proven to play an important role in the onset and progression of disease in subsequent validation [Citation11–13]. However, these studies may have some defects while providing valuable information. On the one hand, the unstandardized heterogeneity of the data used may lead to the concealment of important genetic information, resulting in unreliable results. On the other hand, monotonous computer algorithms and unreasonable threshold settings may include many genes with low association with MM or exclude certain genes with small differential multiples but have an important functional role, which weakens the value of follow-up research based on these studies [Citation14]. For these concerns, bioinformatics analysis for MM needs to be developed to a deeper and more comprehensive level.
In this study, we integrated the gene expression information of MM in the Gene Expression Omnibus (GEO) database to construct the training set and validation set of differentially expressed genes (DEGs). Comprehensive bioinformatics analysis methods, including Gene Ontology (GO) analysis, Kyoto Encyclopedia of Genes and Genomes (KEGG) pathway analysis, protein–protein interaction (PPI) network analysis, weighted gene coexpression network analysis (WGCNA), and gene set enrichment analysis (GSAE), were used to screen and annotate the candidate genes. The clinical diagnostic value of hub genes was also verified. The aim of this study was to screen the hub genes and pathways highly associated with MM and to explain their functions.
2. Material and methods
2.1. Data integration and DEGs identification
Three microarray datasets associated with MM, including the GSE125364, GSE39754, and GSE13591 datasets, were downloaded from the GEO database (http://www.ncbi.nlm.nih.gov/geo). The GSE125364 and GSE39754 datasets were used as the training set (including 45 MM samples and 3 healthy controls, 170 MM samples and 6 healthy controls, respectively), and the GSE13591 dataset, which included 133 MM samples and 5 healthy controls, was used as the validation set. Supplementary Table S1 shows the detailed information for the 3 datasets.
First, the GSE125364 and GSE39754 datasets were standardized and integrated. The batch effect was removed to obtain the gene expression matrix of the samples. Principal component analysis (PCA) was used to visualize the spatial distribution of samples and evaluate their enrichment degree. Subsequently, the R package ‘limma (version 3.5.1)’ was used to identify DEGs between 215 MM samples and 9 healthy controls [Citation15]. P-value was adjusted by the Benjamin and Hochberg method. The cut-off criteria were adjusted to P-value < 0.05 and |[log2FoldChange (log2FC)]| > 1. All genes were visualized by volcano plot using the R package ‘ggplot2 (version 3.3.2)’, and the top 100 significantly changed DEGs were shown by heatmap using the R package ‘pheatmap (version 0.7.7)’ [Citation16].
2.2. GO and KEGG pathway analysis
GO analysis (http://www.geneontology.org/) and KEGG pathway analysis (http://www.genome.jp/kegg/pathway.html) were conducted by the Database for Annotation, Visualization and Integrated Discovery online version 6.8.0 (DAVID V6.8.0, https://david-d.ncifcrf.gov/) to evaluate the biological functions and pathways associated with DEGs [Citation17]. GO analysis includes 3 terms: biological process (BP), molecular functions (MF) and cellular components (CC). Analysis results were displayed using the ‘ggplot2 (version 3.3.2)’ package of R [Citation16]. P-values < 0.05 and counts ≥ 2 were considered significantly enriched.
2.3. PPI network construction
The STRING online database (version 11.0, https://string-db.org/) was used to construct a PPI network to clarify the relationships among proteins encoded by DEGs. The minimum interaction score was set as 0.9 [Citation18]. The network was visualized by Cytoscape (version 3.8.0, https://cytoscape.org/). Then, CytoHubba (version 0.1) plug-ins of Cytoscape (version 3.8.0) were used to recognize the interaction degree of candidate gene clustering according to 5 types of algorithms [the Degree, the Density of Maximum Neighborhood Component (DMNC), the Edge Percolated Component (EPC), the Maximal Clique Centrality (MCC) and the Maximum Neighborhood Component (MNC)] [Citation19]. A Venn diagram produced by the online tool Bioinformatics & Evolutionary Genomics (http://bioinformatics.psb.ugent.be/webtools/Venn/) was used to show the overlapping genes.
2.4. WGCNA of candidate genes
WGCNA, which was implemented by the R package ‘WGCNA (version 1.6.9)’, can cluster genes with similar expression patterns to show the association between modules and specific traits or phenotypes [Citation20]. Different samples were grouped to identify the module genes that were highly correlated with the phenotype. First, the samples were clustered, and outliers were removed to ensure the accuracy of the analysis. The soft threshold parameter that satisfied the scale-free coexpression network relationship was set to 15. Second, to reduce interference from spurious correlations, the adjacency matrix was replaced by a topological overlap matrix (TOM). Through the dynamics cut tree algorithms, the corresponding dissimilarity was calculated to identify hierarchical clustering genes, and the minimum module size was set to 30 to obtain large modules. Third, different module eigenvectors (MEs) were achieved to merge modules with high similarity at a height cut of 0.75. The relevance between modules and clinical traits is shown with a heatmap to determine the modules most closely associated with MM. The |correlation coefficient| > 0.5 and P-value < 0.05 were cut-offs for module screening. Finally, the module membership (mM) and gene significance (GS) of individual genes were measured, and the genes in the key modules with |mM| > 0.8 and |GS| > 0.2 were selected for further analysis.
2.5. Candidate Hub Gene Identification and evaluation
To identify the candidate hub genes, the intersection of candidate genes from the abovementioned WGCNA and PPI results was constructed, and a Venn diagram was used to display the overlapping genes. Pathway interrelation analysis of candidate hub genes was performed using the ClueGo (version 2.5.8) plug-ins of Cytoscape (version 3.8.0) [Citation21]. To evaluate the ability of candidate hub genes to recognize MM samples and healthy controls, the expression data of genes were extracted from the training set, and receiver operator characteristic (ROC) curves were constructed using the R package ‘pROC (version 1.12.1)’ [Citation22].
2.6. Hub gene validation
In the validation phase, the expression data of the candidate hub genes from the GSE13591 dataset were extracted, and the R package ‘ggplot2 (version 3.3.2)’ was used to visualize the consistency of the expression trends of the samples. Then, the ROC curves of these genes in the validation set were plotted, and the results with the training set were compared. Genes with inconsistent expression trends and insignificant differences (P-value ≥ 0.05) were excluded from the following analysis. Finally, the random forest (RF) model of hub genes in the training set was constructed, and the diagnostic efficiency of the model was verified by the validation set. Decision curve analysis (DCA) was used to weigh the clinical practicability of the RF model.
2.7. GSEA of hub genes
GSEA can be used to determine whether an already-defined gene set exhibits a statistically significant difference in two different traits [Citation23]. In this study, GSEA software (version 3.0, http://www.gsea-msigdb.org/gsea/index.jsp) was used to explore biological processes and pathways that may be involved in the pathogenesis of MM. The KEGG pathway gene set was used as the enrichment background, and the expression values of hub genes were taken as phenotypic files to calculate Pearson correlation coefficients. The correlation coefficients between each hub gene and other genes were sorted in descending order as scanning sequences, and the abovementioned gene set was used as a background gene for enrichment analysis. The analysis was performed under the following settings: false discovery rate (FDR) < 0.25, nominal P-value < 0.05 and |normalized enrichment score (NES)| > 1.
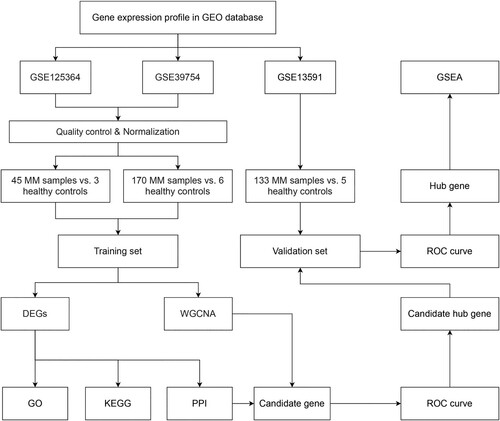
shows the flow chart of the study design.
Figure 1. Flowchart of the study design. GEO, Gene Expression Omnibus; GSE, GEO Series; MM, multiple myeloma; DEGs, differentially expressed genes; WGCNA, weighted gene coexpression network analysis; GO, gene ontology; KEGG, Kyoto Encyclopedia of Genes and Genomes; PPI, protein–protein interaction; ROC curve, receiver operator characteristic curve; GSEA, gene set enrichment analysis.
3. Results
3.1. DEGs screening
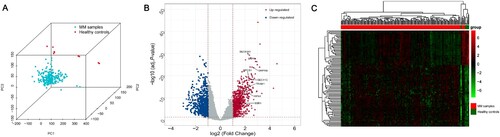
By integrating the GSE125264 and GSE39754 datasets, the gene expression matrices of 224 samples were obtained (including 215 MM samples and 9 healthy controls). PCA results showed complete separation between MM samples and healthy controls in the PCA distribution 3D plot (A). The DEGs in MM samples and healthy controls in the gene expression matrix were analysed by the R package ‘limma (version 3.5.1)’. In total, 1759 DEGs were identified, including 954 upregulated genes and 805 downregulated genes. All DEGs were described by the volcano plot (B) and Supplementary Data S1, and the heatmap shows the expression of the top 100 DEGs (C).
Figure 2. Screening of DEGs. (A) PCA shows that MM samples and healthy controls belong to different subgroups. (B) Volcano plot with cut-off criteria set to adjusted P-value < 0.05 and |log2FC| > 1. Red dots indicate upregulated genes, and blue dots indicate downregulated genes. Arrows indicate the location of the candidate hub genes. (C) Heatmap of the top 100 DEGs according to the values of |log2FC|. DEGs, differentially expressed genes; PCA, principal component analysis; MM, multiple myeloma; FC, fold change.
3.2. Function and pathway analysis
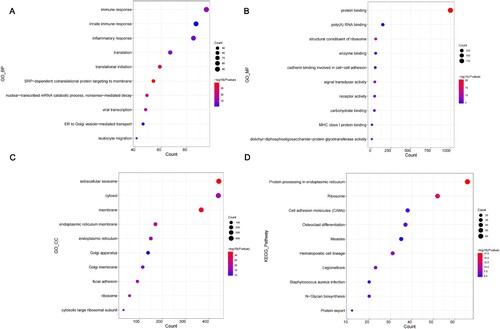
GO and KEGG pathway analyses were performed to investigate the functions of DEGs. A total of 307 GO BP, 91 GO CC, 63 GO MF and 47 KEGG pathways were obtained (Supplementary Data S2). The top 10 GO and KEGG pathways were selected for display by bubble diagram according to the rank of enrichment count (). For GO BP, DEGs were mainly enriched in immune response, innate immune response, inflammatory response, translation and translational initiation (A). For GO MF, DEGs were significantly associated with protein binding, poly(A) RNA binding, structural constituent of ribosome, enzyme binding and cadherin binding involved in cell–cell adhesion (B). For GO CC, the obtained results indicated that proteins encoded by DEGs were mostly located in the extracellular exosome, cytosol, membrane, endoplasmic reticulum (ER) and ER membrane (C). The results of KEGG pathway analysis showed that the pathways associated with protein processing in the ER, ribosome, cell adhesion molecules and osteoclast differentiation were significantly enriched in DEGs (D).
Figure 3. GO and KEGG pathway analysis of DEGs. (A-D) The bubble diagrams show the top 10 functional and pathway enrichment results with significant differences. (A) BP. (B) MF. (C) CC. (D) KEGG. GO, Gene Ontology; KEGG, Kyoto Encyclopedia of Genes and Genomes; DEGs, differentially expressed genes; BP, biological process; MF, molecular functions; CC, cellular components.
3.3. PPI network
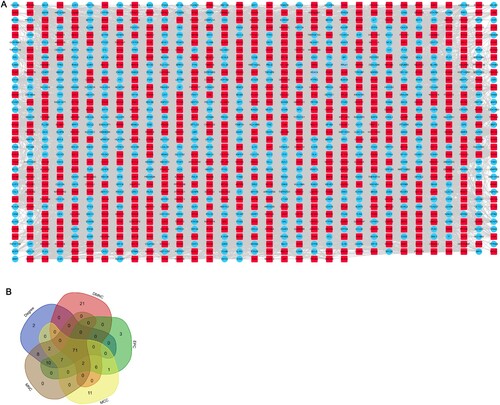
A total of 1759 DEGs were imported into the STRING online database (version 11.0) to construct the PPI network. Outlier proteins were removed, and an interaction network of 1145 proteins was obtained. The protein network was processed by Cytoscape (version 3.8.0) and is shown in A. Different types of algorithms were used to analyse the 1 145 genes with interactions using the Cytohubba (version 0.1) plug-ins of Cytoscape (version 3.8.0) (Supplementary Data S3). The top 100 genes obtained by each algorithm are shown by a Venn diagram, and 71 candidate genes were obtained from the overlapping part (B).
Figure 4. Candidate genes in the PPI network. (A) The PPI network of 1145 protein coding genes. (B) Venn diagram shows the shared genes based on 5 types of algorithms. PPI, protein–protein interaction.
3.4. Candidate genes in WGCNA
The overall clustering and clinical characteristic heatmap of the training set are shown in A. The correlation of the samples was good, and all samples were included for further analysis. As shown in B, when the soft threshold was set to 15 (R2 = 0.85), the interaction between genes conformed to the scale-free distribution to the maximum extent, and the mean value of the adjacency function gradually approached 0. A total of 26 modules were identified by average linkage hierarchical clustering based on the expression values of 16 239 genes in the training set and are shown in C. The cluster diagram and heatmap in D show the correlation between different modules. Meanwhile, 1 000 genes were randomly selected to draw the topological matrix cluster diagram to further illustrate the correlation between different modules (E). At a height cut of 0.75, 12 modules were eventually achieved (C, Supplementary Data S4). Based on the correlation between MEs and clinical traits shown in the heatmap, |cor| > 0.5 and P-value < 0.05 were used as the screening conditions, and we found that the tan module (|cor| = 0.64, P-value = 2e-27) was significantly positively associated with MM (F). The tan module contained 209 genes. For each gene, GS and mM were calculated to draw scatterplots (G). According to the |mM| > 0.8 and |GS| > 0.2 conditions, a total of 29 candidate genes were obtained (Supplementary Data S5).
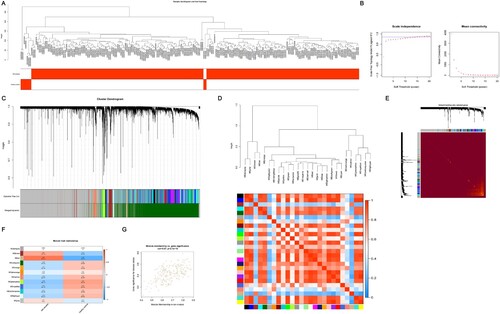
Figure 5. The process of WGCNA. (A) Sample clustering to detect outliers and the trait heatmap to display the sample traits. (B) Analysis of the network topology for various soft thresholding powers; the left panel shows the scale-free fit index (y-axis) as a function of the soft-thresholding power (x-axis); the right panel displays the mean connectivity (degree, y-axis) as a function of the soft-thresholding power (x-axis); the power was set as 15 for further analysis. (C) Clustering dendrograms for the 16 239 genes with dissimilarity based on the topological overlap together with the assigned module colors; twenty-six co-expression modules were constructed with various colors; the relationship between gene dendrogram and gene modules was up and down of the image. (D) The eigengene dendrogram and heatmap identify groups of correlated eigengenes termed meta-modules; the dendrogram indicated that the tan module was highly related to the MM; the heatmap in the panel shows the eigengene adjacency. (E) Visualizing 1 000 random genes from the network using a heatmap plot to depict the TOM among the genes in the analysis; the depth of the red color is positively correlated with the strength of the correlation between the pairs of modules on a linear scale; the gene dendrogram and module assignment are shown along the left side and the top. (F) Module-trait relationships; each row corresponds to a module eigengene, each column corresponds to a trait, and each cell consists of the corresponding correlation and P-value, which are color-coded by correlated according to the color legend. Among them, the tan module was the most relevant module to the MM. (G) Scatterplot of 209 genes in the tan module; the correlation and P-value are under the title. WGCNA, weighted gene coexpression network analysis; MM, multiple myeloma; TOM, topological overlap matrix.
3.5. Candidate Hub Gene Identification
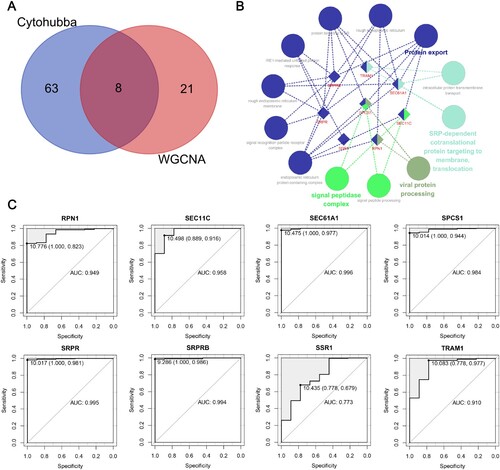
By intersecting the abovementioned 29 WGCNA module genes and 71 PPI protein-coding genes, a total of 8 candidate hub genes were obtained: RPN1, SEC11C, SEC61A1, SPCS1, SRPR, SRPRB, SSR1 and TRAM1 (A). Subsequently, the ClueGo (version 2.5.8) plug-ins of Cytoscape (version 3.8.0) were used for pathway interrelation analysis of the candidate hub genes (B). The functions of candidate hub genes are mainly enriched in the process of protein anabolism and catabolism, which involves the coregulation of one or more genes. Among them, SPCS1 was involved in several stages of this process. At the same time, ROC curves of candidate hub genes were drawn using the R package ‘pROC (version 1.12.1)’ to analyse the ability of these genes to distinguish MM samples from healthy controls. According to the obtained results, the areas under the curve (AUCs) of candidate hub genes were all greater than 0.7 (C).
Figure 6. Identification and evaluation of candidate hub genes. (A) Venn diagram shows the shared candidate hub genes based on WGCNA and PPI analysis. (B) The interrelation between enriched pathways of candidate hub genes. The rhombus represents candidate hub genes; the circles represent enriched pathways. (C) ROC curves of candidate hub genes in diagnosing MM in the training set. Data are presented as cut-off values (sensitivity, specificity). WGCNA, weighted gene coexpression network analysis; MM, multiple myeloma; PPI, protein–protein interaction; ROC, receiver operator characteristic; AUC, area under the curve.
3.6. Hub genes in validation set
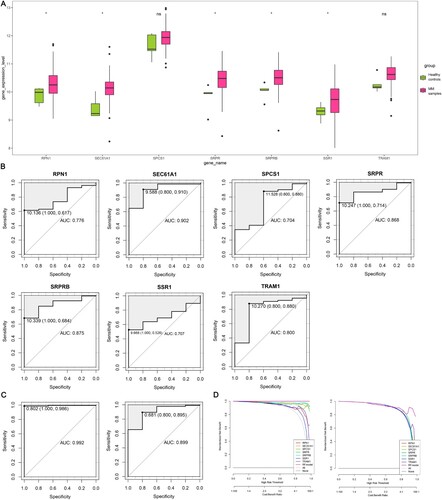
The ability of the candidate hub genes to diagnose MM was further evaluated in the GSE13591 dataset (the SEC11C gene was excluded due to missing data in the validation set). First, a boxplot was used to visualize the expression level of genes (A). The expression levels of RPN1, SEC61A1, SRPR, SRPRB, and SSR1 were increased in MM samples versus healthy controls (P-value < 0.05). Subsequently, the ROC curves of these genes in the validation set were plotted. As shown in B, the AUCs of 7 candidate hub genes (RPN1, SEC61A1, SPCS1, SRPR, SRPRB, SSR1 and TRAM1) were all greater than 0.7. The constructed diagnostic model including the 7 genes exhibited efficient discrimination and specificity between MM samples and healthy controls in both the training and validation sets, indicating that the combined diagnostic accuracy of the hub gene set was superior to the single diagnosis of some hub genes (C). Furthermore, we evaluated the clinical gains of the individual diagnostic genes and the diagnostic model in the training and validation sets by DCA curves. The obtained results demonstrated that the clinical gains of the diagnostic models were higher than those of the individual diagnostic markers (D), indicating that the constructed diagnostic models had considerable clinical application.
Figure 7. Validation of candidate hub genes. (A) Expression level of candidate hub genes in the validation set. (B) ROC curves of candidate hub genes in diagnosing MM in the validation set. (C) ROC curves of the RF model in diagnosing MM of the training set (left) and validation set (right). Data are presented as cut-off values (sensitivity, specificity). (D) DCA for the clinical practicability of the RF model of the training set (left) and validation set (right). ROC, receiver operator characteristic; AUC, area under the curve; MM, multiple myeloma; RF, random forest; DCA, decision curve analysis; *, P-value ≤ 0.05; ns, not significant.
3.7. Hub genes in GSEA
The GSEA method was selected to investigate the biological functions and pathways associated with hub genes in MM. shows the top 1 enrichment results of GO related to each hub gene (see Supplementary Data S6 for details). Most of the genes are positively correlated with protein synthesis and transport processes, such as protein exit from the ER, response to topologically incorrect protein, IRE1-mediated unfolded protein response (UPR) and others. Meanwhile, these genes are negatively correlated with functions such as aromatic amino acid family catabolic processes, DNA methylation involved in gamete generation or positive regulation of the G-protein coupled receptor signaling pathway. The enrichment results of the KEGG pathway with the greatest correlation with hub genes are shown in (see Supplementary Data S7 for details). Among them, the pathways with a significant positive correlation were mainly concentrated in N-glycan biosynthesis and ubiquitin-mediated proteolysis. However, cell biochemical metabolism, neuroactive ligand receptor interaction and olfactory transduction were the main pathways with a significant negative correlation.
Table 1. GSEA of the hub genes (GO analysis).
Table 2. GSEA of the hub genes (KEGG pathway analysis).
4. Discussion
Despite decades of research, the genetic changes that make MM pathogenic and relapses remain largely unknown. Abnormal levels of cell cycle pathway genes [Citation13], cell adhesion genes [Citation12], and DNA methylation [Citation24] in MM patients have been reported in recent studies with encouraging prospects. However, existing studies failed to provide enough information to explain the gene regulatory mechanism of oncoprotein production. It is well-known that a common type of M protein, immunoglobulin G (IgG), has been demonstrated to be present in more than 50% of patients with MM [Citation25]. Therefore, an in-depth study of the DEGs in MM patients is helpful to elucidate the molecular mechanism of the disease and is expected to provide potential targets for diagnosis and treatment. Here, by comprehensive bioinformatics analyses of 3 public gene expression datasets, GSE125364, GSE39754 and GSE13591, we screened the DEGs between MM samples and healthy controls and verified the diagnostic ability of hub genes as biomarkers for disease. Moreover, the biological functions of these hub genes and their significantly related signaling pathways were further explored. The obtained results showed that the expression levels of RPN1, SEC61A1, SPCS1, SRPR, SRPRB, SSR1 and TRAM1 were significantly upregulated in MM samples compared with healthy controls and could be used as candidate diagnostic biomarkers for MM. The enrichment results from GO analysis, KEGG analysis and GSEA suggested that the hub genes were widely involved in the different phases of protein biosynthesis, targeted transport and catabolism and affected the functions of ER and ribosomes. Our study provides evidence to support the regulation of these protein-coding genes in the pathological process of MM and offers a theoretical basis for further studies based on these specific targets.
RPN1 encodes proteins that form the regulatory subunit of the 26S proteasome. Phosphorylation of RPN1 is a prerequisite for proper assembly of the 26S proteasome and facilitates assembly of the 19S base. Blockage of RPN1 phosphorylation results in reduced cell proliferation and mitochondrial dysfunction [Citation26]. As a proteasome ubiquitin-associating subunit, RPN1 participates in proteasomal-mediated substrate degradation by providing T1 and T2 receptor sites for substrate binding and deubiquitination [Citation27,Citation28]. Meanwhile, its stronger binding affinity with branched K11/K48-linked polyubiquitins enhances proteasomal degradation during mitosis [Citation29]. RPN1 has also been reported to be involved in selective autophagy of the ER. The failed UFMylation of RPN1 would cause the suspension of ER autophagy and the accumulation of ER stress, which will eventually disrupt cell differentiation and homeostasis maintenance [Citation30]. A recent review by Zheng et al. detailed the dual role of autophagy in myeloma cells [Citation31]. Combined with our current study, we believe that RPN1-mediated abnormal ER autophagy may be involved in the genesis and progression of myeloma as a cause or consequence.
SEC61A1 encodes the α-subunit of the heteropolymeric SEC61 complex, which is essential in the process of secretion and insertion of polypeptides into the ER [Citation32]. Abnormalities in SEC61A1 have been linked to the progression of kidney disease and liver cancer in humans [Citation33–35]. In a B cell inactivation study, a decrease in the expression of SEC61A1 and the production of IgM and IgG were simultaneously observed, suggesting that the variation in SEC61 may be related to plasma cell deficiency [Citation36]. Further research by Schubert et al. confirmed that B cells of SEC61A1 mutation carriers have an intrinsic deficiency to develop into plasma cells. At the same time, less immunoglobulin secretion was observed in EBV-transformed B cell lines carrying SEC61A1 mutations [Citation37]. In our study, 7 protein-related pathways were enriched in the pathway interrelation analysis of SEC61A1, which indicated that the important regulatory role of SEC61A1 participates in protein metabolism (B). Therefore, further studies are necessary and urgent to clarify the roles of SEC61A1 in the pathogenic mechanism of MM.
SPCS1 encodes a microsomal signal peptidase complex subunit, which plays an important role in protein processing, localization, and secretion [Citation38]. When new proteins are translocated into the ER, SPCS1 may assist in removing signal peptides from them. According to the existing literature, SPCS1 focuses on some viral infectious diseases [Citation39,Citation40]. The detailed relationship between it and the development of MM has not been investigated. The GO analysis of GSEA showed that BP of SPCS1 was significantly enriched in the process of protein exit from ER and sperm capacitation. Of note, SPCS1 is involved in more protein regulatory processes than other hub genes in pathway interrelation analysis (B), which indicates the indispensable role it may play in oncoprotein metabolism.
High expression levels of SRPR and SRPRB in patients with MM were also found in our study. SRPR and SRPRB are genes that encode signal recognition receptors (SRPs) and participate in the targeting and translocation of nascent secretory and membrane proteins to the ER [Citation41]. Abnormal expression of these proteins has been observed in haematological and other tumors [Citation42–45]. Ma et al. pointed out that overexpression of SRPRB significantly reduced the expression and phosphorylation of NF-κB [Citation44]. Although this pathological process may be indirectly involved in immune regulation in MM [Citation1,Citation46], direct evidence of the relationship between SRPR/SRPRB and MM is still lacking and needs to be further clarified.
SSR1 (also known as SSR-Alpha/TRAP Alpha/TRAPA) is a glycosylated membrane receptor related to protein translocation and can be induced by the IRE1α/XBP1 pathway in response to ER stress [Citation47,Citation48]. SSR1 is thought to be involved in the dysfunction process of β cells, affects insulin secretion and ultimately leads to the occurrence of type 2 diabetes [Citation49]. Yan et al. found that the expression level of SSR1 in hypopharyngeal squamous cell carcinoma tumor tissues was higher than that in normal tissues [Citation50]. In a patient with congenital disorder of glycosylation, Ng et al. found a mutation in the SSR subunit of the translocation-related protein complex [Citation51]. In our study, the expression level of SSR1 was significantly increased in MM samples, suggesting that it may serve as a potential biomarker for MM.
TRAM1, a protein involved in the translocation of nascent polypeptides, was localized in the mammalian ER [Citation52]. TRAM1 supports the import of ER protein by modulating the phospholipid bilayer near the lateral gate of the SEC61 channel and participates in the stability of ER membrane degradation substrates [Citation53,Citation54]. The decreased expression of TRAM1 not only enhanced the UPR during acute ER stress but also promoted the induction of NF-κB, a protein reported to participate in the immunoregulation of MM and the development of bortezomib resistance [Citation1,Citation46,Citation54,Citation55]. The enrichment of the ubiquitin-mediated proteolysis pathway and drug metabolism cytochrome P450 pathway in GSEA in this study further supports and strengthens the understanding of the biological functions of TRAM1.
The relationship between N-glycosylation and MM was also the focus of our work. In the KEGG pathway enrichment analysis of GSEA, 5 of the 7 hub genes were enriched in a significantly positive correlation with N-glycan biosynthesis (). As the most prevalent co – and posttranslational protein modification, glycosylation is involved in many biological processes, such as protein folding, stability or degradation [Citation56,Citation57]. N-glycan is a type of protein glycosylated substrate that modifies approximately half of the proteins in serum [Citation57,Citation58]. Dysregulation of glycosylation is involved in a variety of diseases, including the progression of malignancies [Citation59,Citation60]. There is an indisputable relationship between N-glycosylation and MM. Zhang et al. found that the N-glycosylation levels of serum protein in patients with MM were different from those in healthy controls, suggesting that the N-glycosylation levels of serum protein are a potential biomarker of the disease [Citation60]. IgG consists of two heavy chains and two light chains. Each heavy chain of IgG carries a single covalently attached biantennary N-glycan at the highly conserved asparagine 297 residue in each of the CH2 domains of the Fc region of the molecule. This N-glycan structure maintains the stability and function of IgG [Citation61]. Moreover, the modification of B cell maturation antigen by N-glycan improves its binding ability with ligands, which is of great significance for the normal functioning of plasma cells [Citation62]. More direct evidence comes from the work of Mittermayr et al. They found similar N-glycan profiles between MGUS patients and normal controls and considerable N-glycomic heterogeneity in the malignant phase. This result provided a theoretical basis for the clinical stratification of disease degree based on N-glycan profiles [Citation63]. Our current study confirmed the results of previous studies and proposed for the first time that RPN1, SEC61A1, SPCS1, SRPR and SRPRB may mediate the N-glycosylation process of proteins in MM.
Despite these meaningful findings, our study has several potential limitations. First, although there was rigorous quality control of samples from the different datasets, it is undeniable that the effects of inherent heterogeneity may not have been completely eliminated. Second, due to the limitations of the available data, it was not possible to study changes in the expression of these genes during disease progression. Further in vitro and in vivo experimental evidence is necessary to validate the clinical value of the hub genes obtained in this study.
5. Conclusion
Based on comprehensive bioinformatics methods, we identified the hub genes significantly associated with MM and explored their biological functions. We found that RPN1, SEC61A1, SPCS1, SRPR, SRPRB, SSR1 and TRAM1 were highly expressed in MM samples and can be used as potential biomarkers for diagnosis. Further studies indicated that the hub genes play important roles in the regulation of protein biosynthesis, transport or catabolism. These findings provide valuable supplements for the aetiological mechanism of MM, especially the possible existence of abnormal protein metabolism processes.
Supplemental Material
Download MS Excel (327 KB)Supplemental Material
Download MS Excel (5.2 MB)Supplemental Material
Download Comma-Separated Values File (109.5 KB)Supplemental Material
Download MS Excel (237.5 KB)Supplemental Material
Download Comma-Separated Values File (100.7 KB)Supplemental Material
Download Text (168.9 KB)Supplemental Material
Download Comma-Separated Values File (205.3 KB)Supplemental Material
Download MS Word (23 KB)Disclosure statement
No potential conflict of interest was reported by the author(s).
Related Research Data
References
- Roy P, Sarkar UA, Basak S. The NF-κB Activating Pathways in Multiple Myeloma. Biomedicines. 2018;6(2):59, doi: 10.3390/biomedicines6020059.
- Cowan AJ, Allen C, Barac A, et al. Global Burden of Multiple Myeloma: A Systematic Analysis for the Global Burden of Disease Study 2016. JAMA Oncol. 2018;4(9):1221–1227. doi: 10.1001/jamaoncol.2018.2128.
- Zhou L, Yu Q, Wei G, et al. Measuring the global, regional, and national burden of multiple myeloma from 1990 to 2019. BMC Cancer. 2021;21(1):606, doi: 10.1186/s12885-021-08280-y.
- Burks JD, Elarjani T, Jamshidi AM, et al. Vertebral multiple myeloma with pathological fracture: the most common etiology for emergency spine surgery in patients with no cancer diagnosis on admission. Neurosurg Focus. 2021;50(5):E2, doi: 10.3171/2021.2.FOCUS201038.
- Giannakoulas N, Ntanasis-Stathopoulos I, Terpos E. The Role of Marrow Microenvironment in the Growth and Development of Malignant Plasma Cells in Multiple Myeloma. Int J Mol Sci. 2021;22(9):4462, doi: 10.3390/ijms22094462.
- Samur MK, Fulciniti M, Aktas Samur A, et al. Biallelic loss of BCMA as a resistance mechanism to CAR T cell therapy in a patient with multiple myeloma. Nat Commun. 2021;12(1):868, doi: 10.1038/s41467-021-21177-5.
- Rajkumar SV, Dimopoulos MA, Palumbo A, et al. International Myeloma Working Group updated criteria for the diagnosis of multiple myeloma. Lancet Oncol. 2014;15(12):e538–e548. doi: 10.1016/S1470-2045(14)70442-5.
- Ho M, Patel A, Goh CY, et al. Changing paradigms in diagnosis and treatment of monoclonal gammopathy of undetermined significance (MGUS) and smoldering multiple myeloma (SMM). Leukemia. 2020;34(12):3111–3125. doi: 10.1038/s41375-020-01051-x.
- Pawlyn C, Davies FE. Toward personalized treatment in multiple myeloma based on molecular characteristics. Blood. 2019;133(7):660–675. doi: 10.1182/blood-2018-09-825331.
- Jia NY, Liu XZ, Zhang Z, et al. Weighted Gene Co-expression Network Analysis Reveals Different Immunity but Shared Renal Pathology Between IgA Nephropathy and Lupus Nephritis. Front Genet. 2021;12(634171). doi: 10.3389/fgene.2021.634171.
- Yang J, Wang F, Chen B. HLA-DPA1 gene is a potential predictor with prognostic values in multiple myeloma. BMC Cancer. 2020;20(1):915, doi: 10.1186/s12885-020-07393-0.
- Peng Y, Wu D, Li F, et al. Identification of key biomarkers associated with cell adhesion in multiple myeloma by integrated bioinformatics analysis. Cancer Cell Int. 2020;20(262). doi: 10.1186/s12935-020-01355-z.
- Choudhury SR, Ashby C, Tytarenko R, et al. The functional epigenetic landscape of aberrant gene expression in molecular subgroups of newly diagnosed multiple myeloma. J Hematol Oncol. 2020;13(1):108, doi: 10.1186/s13045-020-00933-y.
- Carroll HD, Kann MG, Sheetlin SL, et al. Threshold Average Precision (TAP-k): a measure of retrieval designed for bioinformatics. Bioinformatics. 2010;26(14):1708–1713. doi: 10.1093/bioinformatics/btq270.
- Ritchie ME, Phipson B, Wu D, et al. Limma powers differential expression analyses for RNA-sequencing and microarray studies. Nucleic Acids Res. 2015;43(7):e47, doi: 10.1093/nar/gkv007.
- Ito K, Murphy D. Application of ggplot2 to Pharmacometric graphics. CPT Pharmacometrics Syst Pharmacol. 2013;2(10):e79), doi: 10.1038/psp.2013.56.
- Dennis G, Sherman BT, Hosack DA, et al. David: Database for Annotation, Visualization, and Integrated Discovery. Genome Biol. 2003;4(5):P3. doi: 10.1186/gb-2003-4-5-p3.
- van Gastel J, Hendrickx JO, Leysen H, et al. β-Arrestin Based Receptor Signaling Paradigms: Potential Therapeutic Targets for Complex Age-Related Disorders. Front Pharmacol. 2018;9:1369. doi: 10.3389/fphar.2018.01369.
- Li X, Liu Z, Mi M, et al. Identification of hub genes and key pathways associated with angioimmunoblastic T-cell lymphoma using weighted gene co-expression network analysis. Cancer Manag Res. 2019;11:5209–5220. doi: 10.2147/CMAR.S185030.
- Langfelder P, Horvath S. WGCNA: an R package for weighted correlation network analysis. BMC Bioinformatics. 2008;9(559). doi: 10.1186/1471-2105-9-559.
- Shannon P, Markiel A, Ozier O, et al. Cytoscape: a software environment for integrated models of biomolecular interaction networks. Genome Res. 2003;13(11):2498–2504. doi: 10.1101/gr.1239303.
- Grau J, Grosse I, Keilwagen J. PRROC: computing and visualizing precision-recall and receiver operating characteristic curves in R. Bioinformatics. 2015;31(15):2595–2597. doi:10.1093/bioinformatics/btv153.
- Subramanian A, Kuehn H, Gould J, et al. GSEA-P: a desktop application for gene set enrichment analysis. Bioinformatics. 2007;23(23):3251–3253. doi:10.1093/bioinformatics/btm369.
- Garcia-Gomez A, Li T, de la Calle-Fabregat C, et al. Targeting aberrant DNA methylation in mesenchymal stromal cells as a treatment for myeloma bone disease. Nat Commun. 2021;12(1):421), doi: 10.1038/s41467-020-20715-x.
- Palumbo A, Anderson K. Multiple myeloma. N Engl J Med. 2011;364(11):1046–1060. doi: 10.1056/NEJMra1011442.
- Liu X, Xiao W, Zhang Y, et al. Reversible phosphorylation of Rpn1 regulates 26S proteasome assembly and function. Proc Natl Acad Sci USA. 2020;117(1):328–336. doi: 10.1073/pnas.1912531117.
- Chojnacki M, Mansour W, Hameed DS, et al. Polyubiquitin-Photoactivatable Crosslinking Reagents for Mapping Ubiquitin Interactome Identify Rpn1 as a Proteasome Ubiquitin-Associating Subunit. Cell Chem Biol. 2017;24(4):443–457. doi: 10.1016/j.chembiol.2017.02.013.
- Shi Y, Chen X, Elsasser S, et al. Rpn1 provides adjacent receptor sites for substrate binding and deubiquitination by the proteasome. Science. 2016;351(6275) 10.1126/science.aad9421 aad9421. doi: 10.1126/science.aad9421.
- Boughton AJ, Krueger S, Fushman D. Branching via K11 and K48 Bestows Ubiquitin Chains with a Unique Interdomain Interface and Enhanced Affinity for Proteasomal Subunit Rpn1. Structure. 2020;28(1):29–43. doi: 10.1016/j.str.2019.10.008.
- Liang JR, Lingeman E, Luong T, et al. A Genome-wide ER-phagy Screen Highlights Key Roles of Mitochondrial Metabolism and ER-Resident UFMylation. Cell. 2020;180(6):1160–1177. doi: 10.1016/j.cell.2020.02.017.
- Zheng Z, Wang L, Cheng S, et al. Autophagy and Myeloma. Adv Exp Med Biol. 2020;1207:625–631. doi: 10.1007/978-981-15-4272-5_45.
- Van den Berg B, Clemons WM Jr, Collinson I, et al. X-ray structure of a protein-conducting channel. Nature. 2004;427(6969):36–44. doi: 10.1038/nature02218.
- Bolar NA, Golzio C, Živná M, et al. Heterozygous Loss-of-Function SEC61A1 Mutations Cause Autosomal-Dominant Tubulo-Interstitial and Glomerulocystic Kidney Disease with Anemia. Am J Hum Genet. 2016;99(1):174–187. doi: 10.1016/j.ajhg.2016.05.028.
- Devuyst O, Olinger E, Weber S, et al. Autosomal dominant tubulointerstitial kidney disease. Nat Rev Dis Primers. 2019;5(1):60, doi: 10.1038/s41572-019-0109-9.
- Fa X, Song P, Fu Y, et al. Long non-coding RNA VPS9D1-AS1 facilitates cell proliferation, migration and stemness in hepatocellular carcinoma. Cancer Cell Int. 2021;21(1):131, doi: 10.1186/s12935-020-01741-7.
- Todd DJ, McHeyzer-Williams LJ, Kowal C, et al. XBP1 governs late events in plasma cell differentiation and is not required for antigen-specific memory B cell development. J Exp Med. 2009;206(10):2151–2159. doi: 10.1084/jem.20090738.
- Schubert D, Klein MC, Hassdenteufel S, et al. Plasma cell deficiency in human subjects with heterozygous mutations in Sec61 translocon alpha 1 subunit (SEC61A1). J Allergy Clin Immunol. 2018;141(4):1427–1438. doi: 10.1016/j.jaci.2017.06.042.
- Kalies KU, Hartmann E. Membrane topology of the 12- and the 25-kDa subunits of the mammalian signal peptidase complex. J Biol Chem. 1996;271(7):3925–3929. doi: 10.1074/jbc.271.7.3925.
- Banerjee A, Tripathi A. Recent advances in understanding Japanese encephalitis. F1000Res. 2019;8 F1000 Faculty Rev-1915. doi: 10.12688/f1000research.19693.1.
- Mohd Ropidi MI, Khazali AS, Nor Rashid N, et al. Endoplasmic reticulum: a focal point of Zika virus infection. J Biomed Sci. 2020;27(1):27, doi: 10.1186/s12929-020-0618-6.
- Schwartz T, Blobel G. Structural basis for the function of the beta subunit of the eukaryotic signal recognition particle receptor. Cell. 2003;112(6):793–803. doi: 10.1016/s0092-8674(03)00161-2.
- Rowley JD, Diaz MO, Espinosa R 3rd, et al. Mapping chromosome band 11q23 in human acute leukemia with biotinylated probes: identification of 11q23 translocation breakpoints with a yeast artificial chromosome. Proc Natl Acad Sci USA. 1990;87(23):9358–9362. doi: 10.1073/pnas.87.23.9358.
- Crossen PE, Morrison MJ, Rodley P, et al. Identification of amplified genes in a patient with acute myeloid leukemia and double minute chromosomes. Cancer Genet Cytogenet. 1999;113(2):126–133. doi: 10.1016/s0165-4608(99)00018-7.
- Ma Q, Wu X, Wu J, et al. SERP1 is a novel marker of poor prognosis in pancreatic ductal adenocarcinoma patients via anti-apoptosis and regulating SRPRB/NF-κB axis. Int J Oncol. 2017;51(4):1104–1114. doi: 10.3892/ijo.2017.4111.
- Kim BK, Yoo HI, Choi K, et al. Regulation of Srpr Expression by miR-330-5p Controls Proliferation of Mouse Epidermal Keratinocyte. PLoS One. 2016;11(10):e0164896. doi: 10.1371/journal.pone.0164896.
- Markovina S, Callander NS, O'Connor SL, et al. Bone marrow stromal cells from multiple myeloma patients uniquely induce bortezomib resistant NF-kappaB activity in myeloma cells. Mol Cancer. 2010;9(176). doi: 10.1186/1476-4598-9-176.
- Vogel F, Hartmann E, Görlich D, et al. Segregation of the signal sequence receptor protein in the rough endoplasmic reticulum membrane. Eur J Cell Biol. 1990;53(2):197–202.
- Kajimoto K, Minami Y, Harashima H. Cytoprotective role of the fatty acid binding protein 4 against oxidative and endoplasmic reticulum stress in 3T3-L1 adipocytes. FEBS Open Bio. 2014;4:602–610. doi: 10.1016/j.fob.2014.06.008.
- Huang Y, Xu X, Arvan P, et al. Deficient endoplasmic reticulum translocon-associated protein complex limits the biosynthesis of proinsulin and insulin. FASEB J. 2021;35(5):e21515, doi: 10.1096/fj.202002774R.
- Yan J, Wang ZH, Yan Y, et al. RP11-156L14.1 regulates SSR1 expression by competitively binding to miR-548ao-3p in hypopharyngeal squamous cell carcinoma. Oncol Rep. 2020;44(5):2080–2092. doi: 10.3892/or.2020.7762.
- Ng BG, Lourenço CM, Losfeld ME, et al. Mutations in the translocon-associated protein complex subunit SSR3 cause a novel congenital disorder of glycosylation. J Inherit Metab Dis. 2019;42(5):993–997. doi: 10.1002/jimd.12091.
- Rapoport TA, Goder V, Heinrich SU, et al. Membrane-protein integration and the role of the translocation channel. Trends Cell Biol. 2004;14(10):568–575. doi: 10.1016/j.tcb.2004.09.002.
- Klein MC, Lerner M, Nguyen D, et al. TRAM1 protein may support ER protein import by modulating the phospholipid bilayer near the lateral gate of the Sec61-channel. Channels (Austin). 2020;14(1):28–44. doi: 10.1080/19336950.2020.1724759.
- Ng CL, Oresic K, Tortorella D. TRAM1 is involved in disposal of ER membrane degradation substrates. Exp Cell Res. 2010;316(13):2113–2122. doi: 10.1016/j.yexcr.2010.04.010.
- Akhtar S, Ali TA, Faiyaz A, et al. Cytokine-Mediated Dysregulation of Signaling Pathways in the Pathogenesis of Multiple Myeloma. Int J Mol Sci. 2020;21(14):5002, doi: 10.3390/ijms21145002.
- Wormald MR, Dwek RA. Glycoproteins: glycan presentation and protein-fold stability. Structure. 1999;7(7):R155–R160. doi: 10.1016/s0969-2126(99)80095-1.
- Kim CH. N-Glycan and O-Glycan Glycosylation in Eukaryotes. In: Kim CH, editor. The Ganglioside Biochemistry. Singapore: Springer Press; 2020. p. 15–31.
- Apweiler R, Hermjakob H, Sharon N. On the frequency of protein glycosylation, as deduced from analysis of the SWISS-PROT database. Biochim Biophys Acta. 1999;1473(1):4–8. doi: 10.1016/s0304-4165(99)00165-8.
- Péanne R, de Lonlay P, Foulquier F, et al. Congenital disorders of glycosylation (CDG): Quo vadis? Eur J Med Genet. 2018;61(11):643–663. doi: 10.1016/j.ejmg.2017.10.012.
- Zhang Z, Westhrin M, Bondt A, et al. Serum protein N-glycosylation changes in multiple myeloma. Biochim Biophys Acta Gen Subj. 2019;1863(5):960–970. doi: 10.1016/j.bbagen.2019.03.001.
- Lauc G, Huffman JE, Pučić M, et al. Loci associated with N-glycosylation of human immunoglobulin G show pleiotropy with autoimmune diseases and haematological cancers. PLoS Genet. 2013;9(1):e1003225), doi: 10.1371/journal.pgen.1003225.
- Huang HW, Chen CH, Lin CH, et al. B-cell maturation antigen is modified by a single N-glycan chain that modulates ligand binding and surface retention. Proc Natl Acad Sci USA. 2013;110(27):10928–10933. doi: 10.1073/pnas.1309417110.
- Mittermayr S, Lê GN, Clarke C, et al. Polyclonal Immunoglobulin G N-Glycosylation in the Pathogenesis of Plasma Cell Disorders. J Proteome Res. 2017;16(2):748–762. doi: 10.1021/acs.jproteome.6b00768.