
ABSTRACT
Background
Multiple myeloma is an incurable hematologic malignancy, its early diagnosis is important. However, the biomarker for early diagnosis is limited; hence more need to be identified. The present study aimed to explore the easily tested new biomarker in multiple myeloma by weighted gene co-expression network analysis (WGCNA).
Methods
Differentially expressed genes (DEGs) were screened using GSE47552. WGCNA was used to screen hub genes. Subsequently. Hub genes of multiple myeloma were obtained by intersection of DEGs and WGCNA. We used the T-test to screen highly expressed genes. Then, the diagnostic value of key genes was evaluated by the receiver operating characteristic (ROC) curve. Finally, expression levels of key genes were tested and proved by RT-PCR.
Results
278 DEGs were screened by Limma package. Three modules were most significantly correlated with multiple myeloma. 238 key genes were screened after the intersection of WGCNA with DEGs. In addition, SNORNA is rarely studied in multiple myeloma, and ROC curve analysis in our prediction model showed that SNORA71A had a good prediction effect (p = 0.07). The expression of SNORA71A was increased in samples of multiple myeloma (P = 0.05). RT-PCR results showed that SNORA71A was upregulated in 51 patient specimens compared to the healthy group (P < 0.05). Linear correlation analysis showed that creatinine was positively correlated with SNORA71A (r = 0.49 P = 0.0002).
Conclusions
This study found that SNORA71A was up-regulated and associated with the clinical stages in multiple myeloma; it suggests that SNORA71A could be used as a novel biomarker for early diagnosis and a potential therapeutic target in multiple myeloma.
1. Introduction
Multiple myeloma, a terminally differentiated plasma cell malignancy, is the second most common hematologic malignancy after lymphoma [Citation1]. It usually presents with hypercalcemia, renal insufficiency, anemia, and bone lesions [Citation2]. Although the development of new drugs has improved patient outcomes, the treatment response and survival of newly diagnosed multiple myeloma patients vary, with a median survival of two to more than 10 years [Citation3]. At present, the pathogenesis of multiple myeloma is still complex. Therefore, identifying biomarkers and mechanisms are crucial for early diagnosis, prevention, and personalized treatment.
The typical diagnostic criteria for multiple myeloma are ≥2 criteria, including tumor plasma cells in bone marrow or tissue, dissolved bone lesions, and clonal immunoglobulin para-protein (M protein) produced by tumor cells, which can be either complete immunoglobulin or free light chain (FLC) [Citation4]. This diagnostic model is still used today. However, if multiple myeloma can be detected early, it can greatly help the treatment and improve the outcomes. Weighted gene co-expression network analysis (WGCNA) is a systems biology approach to describe the correlation patterns among multiple native genes [Citation5]. In addition, WGCNA can not only be used to construct co-expression networks based on coding RNA expression data but also can be used to construct non-coding RNA co-expression networks, such as miRNA co-expression networks and lncRNA co-expression networks [Citation6]. WGCNA converts gene expression data into networks, or modules, containing a group of genes that share a common biological relationship or function and behave similarly, thereby providing modules that may be responsible for the phenotypic characteristics of interest [Citation7]. It is widely used to promote the screening or identification of candidate biomarkers or therapeutic targets [Citation8]. However, WGCNA is very rarely used in multiple myeloma.
This study aimed to use the WGCNA approach to identify co-expression networks associated with multiple myeloma and to discover and construct the biomarkers of potential diagnostic value. Our data showed that SNORA71A was upregulated in multiple myeloma samples and was positively correlated with creatinine in patients with multiple myeloma.
2. Materials and methods
2.1. Data collection
Gene expression profile GSE47552(https://www.ncbi.nlm.nih.gov/ geo/query/acc. cgi?acc = GSE47522) was from NCBI-GEO. The GSE47552 microarray data was based on the GPL6244 platform (Hugene-1_0-ST Affymetrix Human Gene 1.0 ST Array). Bone marrow samples from 5 healthy controls, 20 monoclonal immunoglobulinemia of unknown significance (MGUS) patients, 33 high-risk smoldering multiple myeloma (SMM) patients, and 41 newly diagnosed multiple myeloma patients were included. GEO2R is an interactive online tool that could be used to identify DEGs by comparing samples from the GEO series. This study's cutoff criteria for investigating the DEGs were P < 0.05 and [log FC]>1.
2.2. Patients and samples
Bone marrow and peripheral blood samples from 51 patients with multiple myeloma and 50 healthy people were collected from the Hematology Department of the Second Affiliated Hospital of Anhui Medical University from July 2020 to July 2021. Bone marrow and peripheral blood samples from multiple myeloma patients were 32 and 19 cases, respectively. Bone marrow and peripheral blood samples from healthy subjects were 13 and 37, respectively. All Trizol treated specimens were stored at −80◦C until RNA isolation. The diagnosis and classification criteria of multiple myeloma were based on the International Myeloma Working Group (IMWG). The study was approved by the Medical Ethics Committee of the Second Affiliated Hospital of Anhui Medical University and all participants gave informed consent. The clinical characteristics of the patients are shown in Table S1. PCR primers, Trizol, and qRT-PCR kits were purchased from Sangon Biotech.
2.3. Differential gene expression and principal component analysis
We used the limma R software package to identify differentially expressed genes (DEGs) in bone marrow samples from 41 newly diagnosed multiple myeloma patients and 20 MGUS patients. A |log2 fold change (FC)| > 1 and a P adjust < 0.05 were set as the cut-off thresholds for the GSE47552 dataset. We processed DEGs data on Clusterfuture. A volcanic map and heat map of differentially expressed genes were mapped in bone marrow samples from 20 patients with MGUS and 41 patients with multiple myeloma.
2.4. Coexpression network construction
The coexpression network for 41 newly diagnosed multiple myeloma patients and 20 MGUS patients was constructed using the WGCNA R package (version: 3.6.3). The process of network construction mainly included the following steps:(1) defining the similarity matrix; (2) the weight coefficient β was selected to transform the similarity matrix into the adjacencies matrix; (3) transform the adjacencies matrix into topological overlap matrix (TOM); (4) the hierarchical clustering of Tom-based dissTOM is carried out to obtain the hierarchical clustering tree. (5) Dynamic tree cutting method was used to identify modules from hierarchical clustering tree, and (6) we calculate the eigengene for each module(ME). ME represented the overall expression level of the module. Pearson correlation coefficient between MEs of each module was calculated, and 1-Pearson correlation coefficient was defined as the average distance between MEs of each module. The MEs of all modules were clustered using the mean linkage hierarchical clustering method with the minimum size (gene group) of 30. The modules with high similarity were combined to obtain the co-expression network.
2.5. Establishment of clinical trait relationships of modules
The correlation between module characteristic genes and clinical traits was used to evaluate the relationship between module and clinical traits. The modules related to external traits were considered the most significant correlation. For each module, module membership was the correlation between a given gene expression profile and the characteristic genes of a given model. Gene Significance (GS) was defined as the absolute value of the correlation between a gene and a clinical trait. We identified genes with high clinical trait significance and high module membership (MM) using GS and MM measurements. The set parameters were | MM | > 0.8 and | GS | > 0.2 for screening gene.
2.6. Identification of clinically significant modules
We used two approaches to identify the key modules of the network. In the first approach, Pearson correlation coefficients between MEs of each module and each clinical trait were calculated to identify modules that were significantly correlated with that trait (P < 0.05). The second method calculated Pearson correlation coefficients [GS] between the expression levels of each gene and each clinical trait. Then, the average value of GS absolute values of all genes in the module was calculated [Citation9]. The larger the mean absolute value was, the stronger the correlation between the module and clinical features is.
2.7. Identification of hub genes
Hub gene screening requires the determination of MM to measure the correlation between a gene and a given module [Citation9]. For each gene, we defined MM by the correlation between the gene expression profile and the ME of a given module. For example, MMblue(I) = COR (xi, Eblue) measures the correlation between gene I and the blue module ME. When the value of MMblue(I) approaches 1 or −1, it indicates that MMblue(I) is highly connected to the ME of the blue module. On the other hand, if MMblue(I) is close to 0, then the i-th gene is not part of the blue module. MM measurements are highly correlated with the in-module connections [Citation9]. Hub genes in highly connected modules tend to have higher MM values for their respective modules. In all, the higher the MM value of a gene, the higher the correlation between the gene and a given module. In this study, we used the network screening function based on GS (indicating the correlation between a gene and a given clinical trait) and MM (indicating the correlation between a gene and a given module) in the WGCNA package to directly identify hub genes [Citation9]. We used q-weighted cutoff values <0.001 to get hub genes. Central genes (genes that are highly connected to module nodes) have a significant role in functions.
2.8. Enrichment analysis
In order to explore the potential biological role of modular genes, the clusterProfile R software package (version: 3.6.3) was used to analyze the enrichment of gene ontology (GO) and Kyoto encyclopedia of genes and genomes (KEGG) pathways. P < 0.05 was considered statistically significant.
2.9. Hub genes validation
The receiver operating characteristic (ROC) curve was used to analyze the diagnostic performance, and the area under the curve (AUC) represented the sensitivity and specificity [Citation10]. We plotted the ROC curve and calculated the corresponding AUC using the subject operating characteristic R package (version: 3.6.3). When the AUC exceeded 0.7, the hub genes were regarded as being effective for distinguishing multiple myeloma from normal controls, and these genes had remarkable specificity and sensitivity. A t-test was used for normally distributed data; otherwise, the Wilcox test was used to evaluate whether a gene was differentially expressed between multiple myeloma and MGUS.
2.10. RNA isolation and qRT-PCR experiment
To further validate the above screened differentially expressed genes in samples between multiple myeloma patients and healthy people, total RNA was isolated from samples using TRIzol (Sangon Biotech) according to the manufacturer’s instructions. For the quantitative polymerase chain reaction assay, the primers were obtained from Primer-BLAST (https://www.ncbi.nlm.nih.gov/tools/primer-blast/ index.cgi? ORGANISM = 9606 &INPUT_SEQUENCE), and are shown in . GAPDH was used as an internal control. Quantitative PCR analysis was performed with SYBR® Green (Roche Diagnostics) on a LightCycler480 (Roche Diagnostics) in accordance with the manufacturer's manual. The relative expression of different genes was calculated using the 2−△△CT method relative to GAPDH.
Table 1. The primer sequence for genes.
2.11. Statistical analysis
SPSS (Windows version 16.0, SPSS Inc, Chicago, IL, USA) and R software 3.6.3. were used for statistical analysis. Graphics were generated using GraphPad Prism 8.0 (GraphPad 8.0, San Diego, CA, USA). Student t-test was used to evaluate statistical differences among groups. ROC curve was used to evaluate the diagnostic accuracy of key genes, and AUC was used to evaluate sensitivity and specificity. Pearson was used for linear correlation analysis. All P values were bidirectional, and P < 0.05 was statistically significant.
3. Results
3.1. Identification of DEGs in multiple myeloma
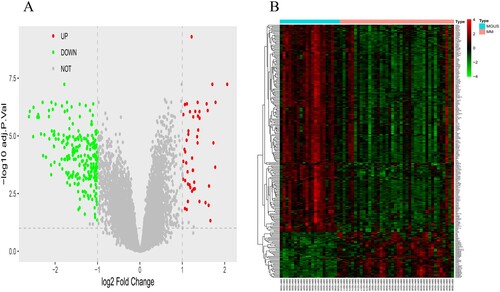
Multiple myeloma and MGUS bone marrow specimens in the GSE47552 cohort were analyzed by R software and its extension package. By setting | log2FC | > 1 and P < 0.05, 278 differentially expressed genes (Table S1) were obtained, among which 50 genes were up-regulated, and 228 genes were down-regulated. Differentially expressed genes were used to construct a volcano map and heatmap (A, B).
Figure 1. The volcano figure and heatmap of DEGs and sample clustering and soft threshold screening. (A and B) Volcano and heatmap of DEGs between in the multiple myaloma and MGUS. 50 upregulated DEGs are shown in red; 228 downregulated DEGs are shown in green; non-DEGs are shown in gray.
3.2. Construction of weighted gene coexpression module
The coexpression network has the characteristics of a scale-free network, i.e. P (k) ∼ k−1, where k denotes the degree of connection of the nodes. Therefore, according to the rules of a scale-free network, the weighted coefficient β must satisfy the condition of negative correlation between log (k) and log [P (k)]. The larger the correlation coefficient is, the more significant the characteristics of the scale-free network are. Considering the complexity and running time of the calculation, when the correlation coefficient was greater than 0.95, it was reasonable to choose β = 7 to construct the public expression network (A, B). The gene expression profiles of the 278 DEGs were transformed into an adjacency matrix, and the co-expression network of TOM, and dissTOM for the DEGs were constructed. The connectivity of each gene in the network was calculated to obtain the distribution of genes (C). When β = 7, Log(k) is negatively correlated with Log [P(k)] (D). According to A to C, when β = 7, the co-expression network is scale-free. After the weighting coefficient β was determined, dissTOM for 278 DEGs were obtained (E). A hierarchical clustering tree was obtained by conducting hierarchical clustering for dissTOM (F). According to the dynamic tree cut method, the minimum number of genes per module was defined as 30. Then, the genes that were not divided into any cluster in the previous step were assigned to different clusters according to the correlations, resulting in eighteen modules. Moreover, the corresponding clinical traits data set was downloaded from NCBI database, and the associations between them and the modules were identified according to the correlation between module eigengene and clinical traits (G). The results showed that 18 modules were significantly correlated with clinical characteristics of multiple myeloma. 10 of them (Edarkturquois, Darkgreen, Darkred, Greenyellow, Grey60, Purp, Darkorange, Green, Darkgrey, Grey) were positively correlated with clinical characteristics. So it includes most of the genes that are overexpressed in multiple myeloma. In contrast, eight modules (Blue, Midnightblue, Lightgreen, Lightyellow, Orange, Turquoise, Black, and Cyan) were found to be negatively associated with multiple myeloma traits. GS > 0.2 and MM > 0.8 were set to screen key genes in Darkgreen, Greenyellow, and Turquoise modules, and 1963 key genes (Table S1) were finally included for further screening. Moreover, the eigengene dendrogram and heatmap usually quantify module similarity through eigengene correlation. The results indicated that the Darkgreen module, Greenyellow module, Turquoise module were most significantly associated with tumor evolution (H). Therefore, the Darkgreen module, Greenyellow module, Turquoise module were treated as tumor evolution modules in subsequent analyses.
Figure 2. Construction of weighted gene co-expression module: (A) Analysis of network topology for various soft-thresholding powers (weighting coefficient, β). The x-axis represents different soft-thresholding powers. The y-axis represents the correlation coefficient between log (k) and log [P(k)]. The red line indicates a correlation coefficient of 0.9. (B) Average network connectivity under different weighting coefficients. (C) Histogram of connectivity distribution at β = 7. (D) Validation of scale-free topology at β = 7. DEGs: differentially expressed genes, MGUS: monoclonal immunoglobulinemia of unknown significance. (E) The heatmap depicts the TOM among all DEGs in the analysis, darker yellow indicates greater overlap, and light color indicates low overlap. Modules are dark blocks along the diagonal. Module assignment genes and trees are also shown at the top and left, respectively. (F) Clustering dendrogram of all DEGs with different similarities based on topological overlap, with assigned module colors. A total of 18 coexpression modules were constructed and shown in different colors. Relationship between modules and clinical features. (G) Module-trait associations. (H) Hierarchical clustering dendrogram of MEs (labeled with the corresponding colors). In the heatmap, red indicates high adjacency (positive correlation), whereas blue indicates low adjacency (negative correlation).
![Figure 2. Construction of weighted gene co-expression module: (A) Analysis of network topology for various soft-thresholding powers (weighting coefficient, β). The x-axis represents different soft-thresholding powers. The y-axis represents the correlation coefficient between log (k) and log [P(k)]. The red line indicates a correlation coefficient of 0.9. (B) Average network connectivity under different weighting coefficients. (C) Histogram of connectivity distribution at β = 7. (D) Validation of scale-free topology at β = 7. DEGs: differentially expressed genes, MGUS: monoclonal immunoglobulinemia of unknown significance. (E) The heatmap depicts the TOM among all DEGs in the analysis, darker yellow indicates greater overlap, and light color indicates low overlap. Modules are dark blocks along the diagonal. Module assignment genes and trees are also shown at the top and left, respectively. (F) Clustering dendrogram of all DEGs with different similarities based on topological overlap, with assigned module colors. A total of 18 coexpression modules were constructed and shown in different colors. Relationship between modules and clinical features. (G) Module-trait associations. (H) Hierarchical clustering dendrogram of MEs (labeled with the corresponding colors). In the heatmap, red indicates high adjacency (positive correlation), whereas blue indicates low adjacency (negative correlation).](/cms/asset/c5ff8c32-c23a-4d3e-9a40-31f189a7719d/yhem_a_2046326_f0002_oc.jpg)
3.3. Identification of tumor evolution hub genes and functional enrichment analysis of tumor evolution hub genes
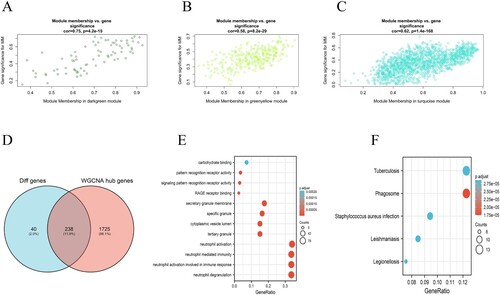
To ensure the reliability of the identification results for the tumor evolution modules, these modules were identified again by calculating the mean absolute GS value of the genes for tumor differentiation in each module. The mean absolute GS values for tumor evolution were the largest for the darkgreen module. The MM value for each gene was calculated to identify hub genes in the module. Correlation analysis between GS for tumor evolution and MM for genes in each module was performed to test whether the MM value was closely related to tumor evolution. The results showed that the correlation coefficient between GS for tumor evolution and MM was highest in the darkgreen modules (A) (correlation coefficient = 0.75, P = 4.2E-15). That is to say, the darkgreen modules exhibited the greatest positive correlation with tumor evolution, consistent with the above conclusions. It has been demonstrated that the MM value can reflect the correlation between genes and tumor evolution. In greenyellow and turquoise modules, the correlation coefficients of GS and MM in tumor evolution were 0.58, 0.62, respectively (B, C) (P = 8.2e-29, P = 1.4e-168, respectively). The larger the MM value of a gene is, the higher the correlation between the gene and a given module, and the more relevant the gene is to tumor evolution. In this study, we identified hub genes using the ‘networkScreening’ function based on GS for tumor evolution and MM. Each gene has its own q-weighted value, and we employed a q-weighted cut-off <0.001 to obtain 1963 hub genes (Table S2) that were highly correlated with tumor evolution. Hub genes screening was required to meet two conditions. The first was that the hub genes were in the modules (darkgreen modules, greenyellow modules, and turquoise modules) that were significantly positively related to tumor evolution. The second was that the hub genes met the screening criteria (q-weighted < 0.001) of the ‘networkScreening’’ function of the WGCNA method. Once a gene met these two screening conditions at the same time, it was defined as a hub gene. As a result, a total of 238 hub genes (Table S1) were screened out (D). To explore the biological functions of the 238 hub genes, we performed GO and KEGG. GO functional enrichment analysis showed that the 238 hub genes were mainly concentrated in neutrophils activation, neutrophils degranulation, neutrophils activation involved in immune response, and neutrophil-mediated immunity (E). KEGG enrichment analysis (F) was mainly concentrated in phagosome, tuberculosis, and staphylococcus aureus infection signaling pathways.
Figure 3. Module and eigengene network plots the flowchart for screening hub genes. (A)–(C) Scatterplots of GS for tumor differentiation (y-axis) versus MM (x-axis) in three modules. (D) Venn diagrams of hub genes in WGCNA and DEGs. Analysis of key genes and biological functions and signaling pathways enriched by 238 key genes: (E) The main biological processes of genes enriched in 238 key genes (F)The main KEGG pathway of genes enriched in 238 key genes.
3.4. ROC curve analysis
Among the 238 key genes, we found few studies on multiple myeloma by SNORNA through literature review and made ROC curves of SNORA71A, SNORA68, and SNORA49 for multiple myeloma and normal healthy people. ROC curve analysis was used to evaluate the diagnostic and predictive value of key genes in multiple myeloma. As shown in , the area under the ROC curve of SNORA71A was 0.75. The sensitivity and specificity were 88% and 96%, respectively. Results of SNORA68 and SNOR49 are shown in and . Obviously, the ROC curve area of SNORA71A was the highest in the ROC curve area of these three genes. We found that SNORA71A was very good at differentiating between multiple myeloma and healthy people, so we conducted further studies.
Figure 4. Four ROC curves with different areas under the ROC curve values. The chance diagonal (Reference line, the line segment from 0, 0 to1, 1) has an area under the ROC curve of 0.5. Tested SNORA71A with the highest area under the ROC curve had the best overall diagnostic performance in the tested SNORA49, SNORA68, and SNORA71A.
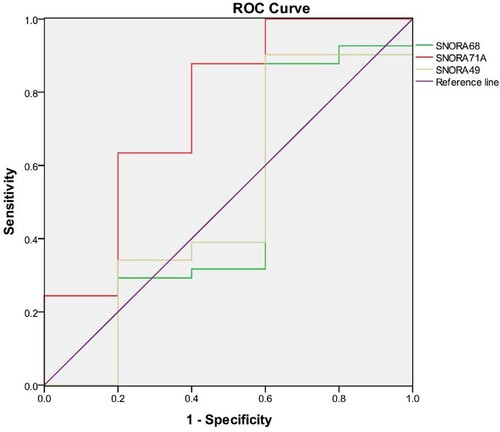
Table 2. ROC area, P-value, cut-off value, specificity, and sensitivity for SNORA49, SNORA68, and SNORA71.
3.5. Hub gene expression verification and the correlation analysis between clinical characteristics and SNORA71A in clinical multiple myeloma patients
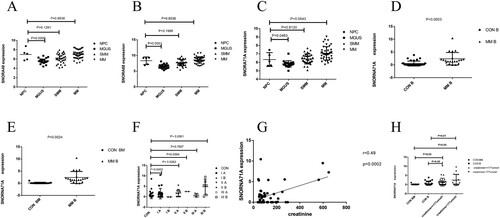
Subsequently, hub gene expression was analyzed in bone marrow samples from 5 healthy controls, 20 MGUS patients, 33 high-risk SMM patients, and 41 multiple myeloma patients. The results are shown in A, B, and C. We found that the expressions of SNORA49, SNORA68, and SNORA71A in the bone marrow of 41 patients with multiple myeloma were higher than those in 5 healthy controls bone marrow samples (P = 0.9536, P = 0.6536, P = 0.0543, respectively). The preliminary results of the expression levels of SNORNA49 and SNORNA68 are shown in Figure S2. Combined with the qRT-PCR results of the three key genes mentioned above, the expression level of SNORA71A in multiple myeloma was higher than that in healthy people, so we chose SNORA71A as the key gene in the subsequent experiments to continue the research. Considering the small number of normal controls in our data set, its P value is not less than 0.05, but it was very close to 0.05. Therefore, peripheral blood and bone marrow of patients with multiple myeloma were collected, RT–PCR was used to identify the expression level of SNORA71A between multiple myeloma and healthy people so as to analyze whether there was any difference in the expression level of SNORA71A between multiple myeloma and healthy people. The basic information on multiple myeloma and healthy populations are shown in Tables S2 and S3. RT–PCR data showed that the expression level of SNORA71A in peripheral blood of multiple myeloma was also significantly higher than that in peripheral blood samples of healthy people. The same results were also found in bone marrow specimens of multiple myeloma and healthy donors (D, E) (P = 0.0003, P = 0.0024, respectively). According to the International Staging System (ISS) of multiple myeloma, the patients were divided into Stage I A, Stage I B, Stage II A, Stage II B, Stage III A, and Stage III B groups. It was found that the expression levels of SNORA71A in stage I A, Stage II A, and Stage III B groups were significantly higher than those in healthy people (P = 0.0453, P = 0.0262, P < 0.0001, respectively) and presented an increasing trend from stage IA to Stage IIIB (F). The remaining stages were not statistically significant, possibly due to the limited number of patients. Since there was only 1 patient in stage I group B, the P value for the good difference in SNORA71A expression between the patient and healthy people could not be calculated. These results showed that SNORA71A was over-expressed in clinical multiple myeloma and associated with the ISS stages. We collected the clinical data of 51 cases of multiple myeloma and performed correlation regression analysis, and it was concluded that there was a positive correlation between creatinine and the expression level of SNORA71A, with r = 0.49, P = 0.0002 (as shown in G). In addition, multiple myeloma was then divided into two groups; the first group was creatinine ≤177umol/L (It was based on the blood creatinine threshold), the second group was creatinine >177umol/L. Difference analysis was conducted (as shown in H); we found that the expression level of SNORA71A in peripheral blood and bone marrow samples of multiple myeloma patients was significantly higher than that in the normal people and higher in the group with creatinine >177umol/L than that in creatinine ≤177umol/L group (P = 0.0548, P = 0.0496, P = 0.0015, P = 0.0098, respectively). These data showed that SNORA71A might be an early biomarker in multiple myeloma.
Figure 5. Analysis of key genes. NPC: normal plasma cell, MGUS: monoclonal immunoglobulinemia of unknown significance, SMM: smoking multiple myeloma, MM: multiple myeloma, B: blood, BM: T bone marrow. (A)–(C) Expression of SNORA49, SNORA68 and SNORA71A in the GSE47552 data set, P < 0.05 is considered statistically significant. (D) SNORA71A relative expression in 21 patients with peripheral blood samples from multiple myeloma and 13 healthy people with bone marrow were analyzed by RT-PCR. (E) SNORA71A relative expression in 21 patients with peripheral blood samples from multiple myeloma and 37 healthy people with peripheral blood were analyzed by RT-PCR. (F) The expression level of SNORA71A was analyzed according to ISS stage of multiple myeloma. (G) Pearson's correlation analysis of the positive correlations with SNORA71A in patients with multiple myeloma (H) Analysis of SNORA71A expression levels in creatinine value of patients with multiple myeloma <177umol/L and ≤ 177umol/ L groups.
4. Discussion
As a gene screening method, WGCNA plays an important role in exploring the relationship between genes and sample characteristics [Citation9]. The main advantage of this method is that genes can be clustered into co-expression modules, and a bridge can be built between gene expression changes and sample characteristics. Therefore, WGCNA has been widely used in various malignant and non-malignant diseases [Citation11–13].
More and more researchers are using WGCNA to develop new diagnostic biomarkers in cancers [Citation14,Citation15]. To our knowledge, our work is the first to use the combined analysis of WGCNA and DEGs to screen potential biomarkers associated with multiple myeloma in the GEO database. Multiple myeloma is a hematological malignancy characterized by the proliferation of bone marrow plasma cells [Citation16]. The precancerous stage, MGUS can be identified in almost all patients who develop multiple myeloma [Citation17]. Through a series of sequential genetic and epigenetic events accumulating in malignant plasma cells, normal plasma cells are transformed into a pre-malignant MGUS/SMM state, which eventually develops into symptomatic multiple myeloma. Survival rates in the general population with multiple myeloma have improved significantly over the past decade, possibly due to effective treatment with autologous stem cell transplantation (ASCT) [Citation18]. Multiple myeloma is still an incurable disease, despite the many advanced therapies available, particularly immunoregulatory drugs and proteasome inhibitors. In addition to being a key feature in the diagnosis of multiple myeloma, the concentration of serum immunoglobulin is a reliable marker of tumor mass and serves as a measure to assess treatment response and disease progression [Citation19]. Light chain myeloma accounts for 13% to 15% of all plasma cell myeloma, and monoclonal light chains need to be identified in urine or serum [Citation20,Citation21]. Therefore, we would like to explore a new biological marker for the early diagnosis of multiple myeloma, and it can be used to evaluate the prognosis of patients like free light chains in serum or urine, which can play a certain role in guiding diagnosis and the treatment of multiple myeloma.
In this study, the GSE47552 dataset was downloaded from the GEO database, and differentially expressed genes were screened by the LIMMA package of the R language. Then module genes with high clinical phenotypic correlation were screened by the WGCNA package, and 238 key genes related to multiple myeloma were screened out. GO functional enrichment analysis showed that the 238 hub genes were mainly concentrated in neutrophils activation, neutrophils degranulation, neutrophils activation involved in immune response, and neutrophil-mediated immunity. KEGG analysis showed that the above 238 hub genes were involved in phagosome, tuberculosis, and staphylococcus aureus infection signaling pathways. Combined with related literature [Citation22] and GO and KEGG results, we speculated that hub genes play a very important role in infection and immunity. Studies by Balmaceda et al. have shown that multiple myeloma patients are at significant risk for severe infection, pneumonia, and neutropenia [Citation23,Citation24]. Infection is known to be the leading cause of morbidity and mortality in patients with multiple myeloma. Through reviewing relevant literature, we learned that there were almost no relevant reports on small nucleolar RNAs (snoRNAs) which are a group of regulatory RNAs and associated with cancers in the study of multiple myeloma. Therefore, through bioinformatics and ROC curves, we concluded that SNORAs, including SNORA71A, SNORA68, and SNORA49, had a good identification effect in multiple myeloma and healthy people. Therefore, combining our research results with related reports, we also speculated that key genes such as SNORA49, SNORA68, and SNORA71A might be involved in the phagosome pathway, thus playing a certain role in the infection and immunity of multiple myeloma patients.
The pathogenesis of most hematologic malignancies is multifactorial. In several hematological malignancies, the properties of the hematopoietic stem cells (HCSs) are determined by the bone marrow milieu [Citation25]. The interaction between multiple myeloma cells and the bone marrow microenvironment is one of the most critical factors in the development, progression, and treatment of multiple myeloma. The cellular portion of the bone marrow microenvironment consists of different types of hematopoietic and non-hematopoietic cells, including fibroblasts, bone marrow stromal cells, endothelial cells, osteoblasts, and osteoclasts. The acellular part consists of an extracellular matrix and molecules produced by existing cells, including cytokines, chemokines, and growth factors [Citation26]. The adherence of multiple myeloma cells to bone marrow mesenchymal cells and extracellular matrix initiates a circuit that subsequently activates many pathways leading to alterations in the expression of different genes that enable tumor growth. One of the important pathways is NF-κB. With the continuous development of treatment regimens for patients with multiple myeloma, there are currently many promising strategies for treating multiple myeloma, including immunoregulatory drugs (IMIDs), proteasome inhibitors (PI), or histone deacetylase inhibitors. There are also novel strategies, such as small molecule inhibitors, monoclonal antibodies, or chimeric antigen receptor (CAR) T cells [Citation27,Citation28]. Therefore, it is not surprising that patients with multiple myeloma who have been treated with various therapies have a weakened immune system that can lead to infection. In this study, the results of KEGG analysis suggested that SNORA49, SNORA68, and SNORA71A might be related to the phagosome pathway. Finally, we speculated that SNORA49, SNORA68, and SNORA71A might play a role in the immunity and infection of multiple myeloma through the phagosome pathway. Subsequently, ROC curves of three key genes, SNORA49, SNORA68, and SNORA71A, were plotted, and SNORA71A could be used as a new diagnostic marker for multiple myeloma. Our bioinformatics and validation results found that the expression level of SNORA71A for MGUS was lower compared with that of multiple myeloma. Meanwhile, we found that the expression level of SNORA71A of multiple myeloma also was higher compared with that of normal people.
In addition, 51 patients with multiple myeloma and 50 healthy people samples in our hospital were collected. Through RT–PCR verification, we found that the expression of SNORNA71 in peripheral blood samples of multiple myeloma was significantly higher than that in the bone marrow and peripheral blood samples of healthy people and presented an increasing trend from stage IA to stage IIIB. Because of the limited number of cases included in our cohort, there was no statistical significance at the other stages of the disease. Our data not only showed that SNORA71A was over-expressed in clinical multiple myeloma but also associated with its ISS stages.
We also analyzed the association between clinical characteristics and SNORA71A. We found a positive correlation between blood creatinine, and SNORA71A, even higher in multiple myeloma cases with blood creatinine less than or equal to 177umol/L. These data suggested that SNORA71A may be an early biomarker in multiple myeloma.
SnoRNAs are a group of regulatory RNAs that mainly reside in the nucleolus and post-transcriptionally modify ribosomal RNA (rRNA) and small nuclear RNA (snRNA), which are associated with malignancy by mediating gene expression and cancer signaling pathways [Citation29]. Currently, more and more evidence shows that SNORNA also plays an important role in the regulation of oncogenesis and as a biomarker of cancers [Citation30], including liver cancer [Citation31], colorectal cancer (CRC) [Citation32], but few studies focused on its mechanisms. However, to the best of our knowledge, to date, limited information is available on the expression and function of SNORNA in multiple myeloma. Because SNORNA is abundant and easily detectable in solid tumors and blood and may be functionally relevant in tumorigenesis, they could become a biomarker and major target for cancer therapy. In our study, the expression of SNORA71A in multiple myeloma was significantly higher and increased with disease progression and could be used as a new diagnostic marker for multiple myeloma. Our results suggest that we can assess patients’ condition by detecting the expression level of SNORA71A in peripheral blood, thereby reducing the pain and medical costs of bone marrow puncture in patients. However, its mechanism of action and clinical value need further exploration in lumber samples of multiple myeloma patients in the future.
5. Conclusion
In conclusion, our study found for the first time that SNORA71A was upregulated and associated with the clinical stage in multiple myeloma. Our results also suggest that SNORA71A could be used as a potential novel biomarker for early diagnosis and therapeutic target in multiple myeloma. Thus, more studies are needed to explore the specific mechanism and the clinical value in the real world of multiple myeloma in the future.
Supplemental Material
Download MS Word (364.7 KB)Disclosure statement
No potential conflict of interest was reported by the author(s).
Additional information
Funding
References
- Kumar SK, Rajkumar V, Kyle RA, et al. Multiple myeloma. Nat Rev Dis Primers. 2017;3:17046.
- Palumbo A, Anderson K. Multiple myeloma. N Engl J Med. 2011;364(11):1046–1060.
- Sonneveld P, Avet-Loiseau H, Lonial S, et al. Treatment of multiple myeloma with high-risk cytogenetics: a consensus of the International myeloma working group. Blood. 2016;127(24):2955–2962.
- Rajkumar SV, Dimopoulos MA, Palumbo A, et al. International myeloma working group updated criteria for the diagnosis of multiple myeloma. Lancet Oncol. 2014;15(12):e538–e548.
- Niu J, Huang Y, Liu X, et al. Single-cell RNA-seq reveals different subsets of non-specific cytotoxic cells in teleost. Genomics. 2020;112(6):5170–5179.
- Hu Z, Yang D, Tang Y, et al. Five-long non-coding RNA risk score system for the effective prediction of gastric cancer patient survival. Oncol Lett. 2019;17(5):4474–4486.
- Liu Z, Li M, Fang X, et al. Identification of surrogate prognostic biomarkers for allergic asthma in nasal epithelial brushing samples by WGCNA. J Cell Biochem 2019;120(4):5137–5150.
- Li S, Liu X, Liu T, et al. Identification of biomarkers correlated with the TNM staging and overall survival of patients with bladder cancer. Front Physiol. 2017;8:947.
- Langfelder P, Horvath S. Wgcna: an R package for weighted correlation network analysis. BMC Bioinf. 2008;9:559.
- Feng J, Bian Q, He X, et al. A LncRNA-miRNA-mRNA ceRNA regulatory network based tuberculosis prediction model. Microb Pathog 2021;158:105069.
- Zhou X, Wang Y, Chen J, et al. Constructing a 10-core genes panel for diagnosis of pediatric sepsis. J Clin Lab Anal. 2021;35(3):e23680.
- Zhao C. Identifying the hub gene and immune infiltration of osteoarthritis by bioinformatical methods. Clin Rheumatol 2021;40(3):1027–1037.
- Song Z-Y, Chao F, Zhuo Z, et al. Identification of hub genes in prostate cancer using robust rank aggregation and weighted gene co-expression network analysis. Aging (Albany NY). 2019;11(13):4736–4756.
- Hu X, Bao M, Huang J, et al. Identification and validation of novel biomarkers for diagnosis and prognosis of hepatocellular carcinoma. Front Oncol. 2020;10:541479.
- Gao M, Kong W, Huang Z, et al. Identification of Key genes related to lung squamous cell carcinoma using bioinformatics analysis. Int J Mol Sci. 2020;21(8.
- Siegel RL, Miller KD, Jemal A. Cancer statistics, 2019. CA Cancer J Clin. 2019;69(1):7–34.
- Mouhieddine TH, Weeks LD, Ghobrial IM. Monoclonal gammopathy of undetermined significance. Blood. 2019;133(23):2484–2494.
- Kazandjian D. Multiple myeloma epidemiology and survival: A unique malignancy. Semin Oncol 2016;43(6):676–681.
- Clavijo A, Ryan N, Xu H, et al. Measurement of monoclonal immunoglobulin protein concentration in serum protein electrophoresis: comparison of automated vs manual/human readings. Lab Med. 2020;51(3):252–258.
- Singh G. Concentrations of serum free light chains in kappa and lambda lesions in light-chain myelomas. Lab Med. 2019;50(2):189–193.
- Singh G. Serum free light chain assay and κ/λ ratio: Performance in patients With monoclonal gammopathy-high false negative rate for κ/λ ratio. J Clin Med Res. 2017;9(1):46–57.
- Tan JMJ, Garner ME, Regeimbal JM, et al. Listeria exploits IFITM3 to suppress antibacterial activity in phagocytes. Nat Commun. 2021;12(1):4999.
- Balmaceda N, Aziz M, Chandrasekar VT, et al. Infection risks in multiple myeloma: a systematic review and meta-analysis of randomized trials from 2015 to 2019. BMC Cancer. 2021;21(1):730.
- Blimark C, Holmberg E, Mellqvist U-H, et al. Multiple myeloma and infections: a population-based study on 9253 multiple myeloma patients. Haematologica. 2015;100(1):107–113.
- Méndez-Ferrer S, Bonnet D, Steensma DP, et al. Bone marrow niches in haematological malignancies. Nat Rev Cancer. 2020;20(5):285–298.
- Manier S, Sacco A, Leleu X, et al. Bone marrow microenvironment in multiple myeloma progression. J Biomed Biotechnol. 2012;2012:157496.
- Köhler M, Greil C, Hudecek M, et al. Current developments in immunotherapy in the treatment of multiple myeloma. Cancer. 2018;124(10):2075–2085.
- Cavo M, Terpos E, Bargay J, et al. The multiple myeloma treatment landscape: international guideline recommendations and clinical practice in Europe. Expert Rev Hematol. 2018;11(3):219–237.
- Wong CM, Tsang FH, Ng IO. Non-coding RNAs in hepatocellular carcinoma: molecular functions and pathological implications. Nat Rev Gastroenterol Hepatol. 2018;15(3):137–151.
- Su H, Xu T, Ganapathy S, et al. Elevated snoRNA biogenesis is essential in breast cancer. Oncogene. 2014;33(11):1348–1358.
- Xu G, Yang F, Ding C-L, et al. Small nucleolar RNA 113-1 suppresses tumorigenesis in hepatocellular carcinoma. Mol Cancer. 2014;13:216.
- Okugawa Y, Toiyama Y, Toden S, et al. Clinical significance of SNORA42 as an oncogene and a prognostic biomarker in colorectal cancer. Gut. 2017;66(1):107–117.