
ABSTRACT
The deregulation of microRNAs (miRNAs) and genes in the bone marrow microenvironment have been involved with the pathogenesis of multiple myeloma (MM). However, the exploration of miRNA-mRNA regulatory networks in MM remains lacking. We used GSE125363, GSE125361, GSE47552, GSE2658, GSE136324, GSE16558, and GSE13591 datasets for this bioinformatics study. We identified 156 downregulated and 13 upregulated differentially expressed miRNAs (DEmiRs) in MM. The DEmiRs are associated with the enrichment of pathways mainly involved with cancers, cellular signaling, and immune regulations. We identified 112 hub genes associated with five significant clusters in MM. Moreover, we identified 9 upregulated hub genes (such as IGF1, RPS28, UBA52, CDKN1A, and CDKN2A) and 52 downregulated hub genes (such as TP53, PCNA, BRCA1, CCNB1, and MSH2) in MM that is targeted by DEmiRs. The expression of DEmiRs targeted two hub genes (CDKN2A and TP53) are correlated with the survival prognosis of MM patients. Furthermore, the expression level of CDKN2A is correlated with immune signatures, including CD4+ Regulatory T cells, T cell exhaustion, MHC Class I, immune checkpoint genes, macrophages, neutrophils, and TH2 cells in the TME of MM. Finally, we revealed the consistently deregulated expression level of key gene CDKN2A and its co-regulatory DEmiRs, including hsa-mir-192, hsa-mir-10b, hsa-mir-492, and hsa-mir-24 in the independent cohorts of MM. Identifying key genes and miRNA-mRNA regulatory networks may provide new molecular insights into the tumor immune microenvironment in MM.
1. Background
Multiple myeloma (MM) is an incurable hematological malignancy of B lymphocytes characterized by the accumulation of malignant plasma cells in the bone marrow [Citation1]. MM includes 10% of all hematological cancers and is comprised of anemia, hypercalcemia, renal failure, and bone lesions that are ultimately associated with the fatal conditions [Citation2]. The stages of MM included monoclonal gammopathy of undetermined significance, smoldering myeloma, myeloma, and plasma cell leukemia and the end-stage disease is associated with resistance to treatments, increased cellular proliferation, evasion of apoptosis, and an ability to grow independently of the bone marrow microenvironment [Citation2]. The bone marrow microenvironment has a crucial impact on MM. The interaction of plasma cells and bone marrow microenvironments can substantially regulate the disease's cellular proliferation, drug resistance, and prognosis [Citation3]. In MM, the bone marrow niche comprises cellular components including stromal cells, osteoblasts, osteoclasts, endothelial cells, immune cells, and noncellular components including extracellular matrix, cytokines, chemokines, and growth factors [Citation4]. The bone marrow tumor microenvironment influences the expression of MM-related genes associated with the angiogenesis, migration, and metastasis of cancer cells [Citation5]. In the bone marrow microenvironment, targeting the plasma cells and their interaction with other components is a crucial strategy in MM [Citation6].
MiRNAs are novel crossroads between the plasma cells and bone marrow microenvironment [Citation7]. These regulatory miRNAs transfer between the components of the bone marrow microenvironment to establish their oncogenic functions [Citation8]. The aberrant expression levels of miRNAs are found in the bone marrow microenvironment and blood of MM patients. These aberrantly expressed miRNAs are associated with the progression of MM [Citation9]. M Fulciniti et al discovered that the miR-23b targeted Sp1 3'UTR and significantly reduced Sp1-driven nuclear factor-κB activity in MM cells [Citation10]. MiRNAs and their predicted targets are associated with the development and malignancy of MM cells [Citation11]. In response to IL-6, STAT3 is recruited to the miR-21 upstream region in human myeloma cells for contribution to the antiapoptotic function [Citation12]. These studies indicate that the interactions of miRNA-mRNA are associated with the pathogenesis of MM.
Herein, we aimed to identify the differentially expressed genes (DEGs) and differentially expressed miRNAs (DEmiRs) in MM by using two gene expression datasets and a miRNA expression dataset. For these DEmiRs, we identified their associated pathways and target genes. For the hub genes in MM, we identified the significant modular functions in the MM. Furthermore, we investigated the correlations between the expression levels of the significant prognostic hub genes targeted by DEmiRs and antitumor immune signatures in the MM microenvironment. Finally, we identified the miRNA-mRNA interactions associated with immunosuppression in MM.
2. Materials and methods
2.1. Acquisition and preprocessing of microarray data
GSE125363, miRNA expression signatures in multiple myeloma, was downloaded from the NCBI. GSE125363 is based on GPL18044 (Agilent 046064 Unrestricted Human miRNA V19.0 Microarray) that included 44 myeloma samples (plasma cells) and 4 controls [Citation13]. GSE125361, based on GPL20844, is a gene expression signatures database in multiple myeloma (n = 48) [Citation13]. GSE47552 is also gene expression data based on GPL6244, including 41 multiple myeloma samples and 5 controls [Citation14]. We included the plasma cells of multiple myeloma patients and excluded the other samples from the same dataset. Besides, we used the clinical information of the GSE2658 (n = 559) dataset for the survival analysis [Citation15]. Furthermore, we utilized the dataset GSE136324 from 436 newly diagnosed MM patients related to the multiple myeloma (MM) whole tumor microenvironment [Citation16]. Finally, we used the GSE16558 (n = 65, 60 MM patients and 5 control) [Citation17] and GSE13591(n = 138, 133 MM patients and 5 control) [Citation18] for validating the expression level of key genes and miRNAs.
2.2. Identification of differentially expressed miRNAs (DEmiRs) in multiple myeloma and target genes of DEmiRs in bone marrow
The differential expression of miRNAs was carried out using GEO2R (http://www.ncbi.nlm.nih.gov/geo/geo2r), an interactive web tool. We utilized the GEO2R tool based on the GEOquery and limma R packages from the Bioconductor project (http://www.bioconductor.org/). The thresholds of adjusted P-value < 0.05 and |logFC| > 2.0 were set to find out the significant level. We used miRNet [Citation19] (miRTarBase v8 and TarBase v8.0 were selected for the prediction of target genes) to identify the target genes of DEmiRs in the bone marrow. The online tool ‘Calculate and draw custom Venn diagrams’ (http://bioinformatics.psb.ugent.be/webtools/Venn/) was utilized for identifying common genes between the target genes of DEmiRs and the hub genes identified in multiple myeloma.
2.3. KEGG pathway enrichment analysis of DEmiRs in multiple myeloma
We identified significant KEGG [Citation20] pathways that were associated with the DEmiRs by using the DIANA-mirPath (version 3) [Citation21]. In this tool, we chose to analyze the validated miRNA-gene interactions using an archive in microT web server v5.0 [Citation22] and DIANA-TarBase v7.0 [Citation23] and identified KEGG pathways. We uploaded 100 downregulated and all upregulated miRNAs into the DIANA-mirPath (version 3). A threshold of adjusted P-value < 0.05 (Fisher's exact test) was used to define the statistical significance. Finally, we identified the common significant pathways enriched between both tools (microT web server v5.0 and DIANA-TarBase v7.0).
2.4. Identification of DEGs in multiple myeloma
We used Network Analyst [Citation24] to identify the DEGs between multiple myeloma and normal samples by a meta-analysis of two multiple myeloma gene expression profiling datasets (GSE125361 and GSE47552). Datasets were normalized by quantile normalization, and the batch effects of multiple datasets were removed using the ComBat method [Citation25]. We used the R package ‘limma’ to identify the DEGs between multiple myeloma and normal samples, and Cochran's combination test performed the meta-analysis [Citation26]. The false discovery rate (FDR) [Citation27] was used to adjust for multiple tests. We identified the DEGs using a threshold of absolute combined effect size (ES) >1.50 and FDR < 0.05.
2.5. Construction of protein–protein interaction (PPI) network of the DEGs and identification of hub genes-associated clusters
We constructed a PPI network of the identified DEGs by search tool for the retrieval of interacting genes (STRING) database (https://string-db.org/cgi/input.pl; STRING-DB v11.0)[Citation24]. The rank of the target proteins based on the degree of interactions in the PPI network was identified using the Cytoscape plugin cytoHubba[Citation25]. The obtained protein–protein interaction data were imported into Cytoscape 3.6.1 software to construct a PPI network[Citation26]. A hub gene was defined as a gene connected to no less than 20 other DEGs in the PPI. We used Cytoscape plugin molecular complex detection (MCODE) to identify the associated modules with hub genes. We identified the significant modules based on the MCODE score and node number. The threshold of the MCODE was Node Score Cutoff: 0.2, Haircut: true, K-Core: 2, and maximum depth from Seed: 100.
2.6. Gene-set enrichment analysis of significant modules
We performed gene-set enrichment analysis of the cluster-specific hub genes by GSEA [Citation27]. We inputted the hub genes associated with a specific cluster into the GSEA. The KEGG pathways significantly associated with the hub genes in an individual cluster were identified (FDR < 0.05).
2.7. Survival analysis of hub genes in multiple myeloma by using the PrognoScan
The prognostic roles of DEmiRs targeted hub genes in multiple myeloma patients were analyzed using the PrognoScan database (http://www.abren.net/ PrognoScan/) [Citation28]. We used the dataset GSE2658 (n = 559) for the survival analysis [Citation15]. Cox P < 0.05 was considered a significant level.
2.8. Evaluation of the immune signature enrichment levels with prognostic hub genes
We used dataset GSE136324 from 436 MM patients for analyzing the correlation of immune infiltrations with prognostic hub genes in the multiple myeloma (MM) tumor microenvironment [Citation16]. We calculated the immune scores, stromal scores, and tumor microenvironment scores using the xCell tool [Citation29]. Also, we identified the enrichment level of various immune signatures in a tumor sample as the single-sample gene-set enrichment analysis (ssGSEA) score [Citation30]. The gene set contains the collection of all marker genes of an individual immune signature. We included 20 immune signatures: B cell, CD8+ T cells, CD4 + regulatory T cells, NK cells, macrophages, neutrophils, pDCs, MHC Class I, HLA genes, Tregs, T cell exhaustion, immune checkpoint genes, T cell activation, cytolytic activity, MDSCs, TH1, TH2, monocyte, CAFs, and Tfh. The marker genes set of individual immune signatures are displayed in Supplementary Table S1. Then, we identified Spearman's correlation between the ssGSEA score and the expression levels of selected hub genes (absolute value of R is not less than 0.20, P < 0.05).
2.9. Statistical and computational analysis
We evaluated Pearson's or Spearman's correlation test to verify the significant levels between the two variables. For analyzing the correlations between the expression levels of hub genes and the enrichment levels (ssGSEA scores) of immune signatures, we used Spearman's correlation test because these data were not normally distributed. For analyzing the correlations between the expression levels of hub genes with the expression levels of other marker genes, we utilized Pearson's correlation test because these data were normally distributed. We employed the Wilcoxon rank-sum test for the expression validation of key genes and miRNAs between the tumor and control groups (P < 0.05). We utilized the NetworkAnalyst [Citation31] tool to calculate the average expression of a gene with multiple probes in the same expression dataset. We used the R package ‘ggplot2’ for plotting the graphs in this study.
3. Results
3.1. Identification of DEmiRs in multiple myeloma
We identified the upregulated and downregulated DEmiRs between the multiple myeloma and control samples. We identified 13 upregulated DEmiRs such as hsa-miR-4301, hsa-miR-548al, hsa-miR-4693-3p, hsa-miR-711, and hsa-miR-4799-3p (Supplementary Table S2). In addition, 156 downregulated DEmiRs were identified in the plasma cells of MM patients (Supplementary Table S2). The top ten (the absolute value of the highest LogFC) upregulated and downregulated DEmiRs are presented in . Previous studies showed that the DEmiRs obtained from the MM are associated with cancers. For example, hsa-miR-4301 is upregulated in gastric cancer treated with cisplatin [Citation32]. Hsa-miR-299-5p, another upregulated DEmiRs, is associated with the epithelial–mesenchymal transition, proliferation, and tumorigenicity of colorectal cancer cells [Citation33]. Downregulation of miR-23a-5p levels in leukemic cells is associated with their protection of them from chemotherapy-induced apoptosis [Citation34]. In tumors, miR-378a is considered a part of an angiogenic network [Citation35]. Altogether, DEmiRs are associated with the pathogenesis of cancers, including hematological disorders.
Table 1. Top 10 upregulated and top 10 downregulated DEmiRs in multiple myeloma.
3.2. Identification of pathways significantly associated with DEmiRs
We used microT web server v5.0 [Citation22] and DIANA-TarBase v7.0 [Citation23], which are built-in DIANA-miRPath [Citation21] to identify the KEGG [Citation20] pathways. We identified common significant 48 KEGG [Citation20] pathways associated with the downregulated DEmiRs in MM (). These pathways are mainly involved in cancers, immune-regulation, stromal regulations, metabolisms, cellular signaling, and cellular developments (). Previous studies revealed that the enriched pathways are associated with hematological cancers. For example, it was reported that proteoglycans are required for multiple myeloma cell adhesion, in vivo growth, and vascularization [Citation36]. The hippo pathway is associated with resistance in MM and other hematologic malignancies [Citation37]. In MM, the TGF-beta signaling pathway can control proliferation, differentiation, migration, and cell survival [Citation38]. In addition, we also identified 27 KEGG pathways associated with upregulated DEmiRs in MM (Supplementary Table S3).
Table 2. Downregulated DemiRs are associated with the enrichment of KEGG pathways. MicroT web server v5.0 [Citation22], and DIANA-TarBase v7.0 [Citation23] are used for identifying common pathways.
3.3. Identification of differentially expressed hub genes and their modular analysis
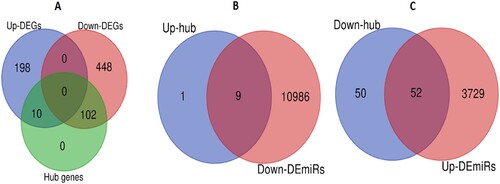
We identified 208 upregulated and 550 downregulated genes (Supplementary Table S4) by a meta-analysis of two GEO datasets (GSE125361and GSE47552) (absolute value of combined ES > 1.5, P < 0.05). The top ten upregulated genes (the highest combined ES) are ARPC5L, CDKN1A, IGF1, UBALD2, RPS28, RABAC1, SURF1, PELI1, TBCC, and YBEY in MM. It was stated that the expression of ARPC5 was significantly higher in relapsed MM cells than in baseline MM cells [Citation39]. IGF1, one of the top upregulated genes, is a major growth factor for MM cell lines and is associated with prognostic relevance in MM [Citation40]. In addition, NCAPD2, BORA, MSH2, TF, CLUAP1, CTPS2, ZNF382, ZMYM1, DDIAS, and SF3B3 are the top ten (the lowest combined ES) downregulated genes in MM. In MM, MSH2 has interacted with RECQ1 helicase, which is ultimately associated with DNA repair pathways [Citation41]. A study has reported that a transcription inhibitor ZNF382 is downregulated in MM due to hypermethylation in the promoter region[Citation42].
We inputted all DEGs into the STRING v11 to construct protein–protein interaction networks for identifying hub genes in MM. We identified 112 hub genes (degree of interaction ≥ 20) in MM that included 10 upregulated DEGs, and 102 downregulated DEGs (A and Supplementary Table S5). The upregulated hub genes in MM included IGF1, IRF1, RPS28, UBA52, RPL32, RPS19, CDKN1A, RNF7, PSMB8, and CDKN2A. Some of the downregulated hub genes in MM are TP53, BRCA1, CCNB1, CDC20, PCNA, CDC6, BPTF, POLR2B, HDAC2, SMC1A, and MSH2. Furthermore, we identified the significant clusters of identified hub genes by using the Cytoscape plugin MCODE. The hub gene-associated five significant clusters in MM (, (A, C, E, G, and H)). The functional enrichment analysis revealed that cluster 1 (A) is associated with the enrichment of 20 KEGG pathways, including cell cycle, pathways in cancer, p53 signaling pathway, mismatch repair, DNA replication, bladder cancer, glioma, melanoma, chronic myeloid leukemia, small cell lung cancer, prostate cancer, homologous recombination, nucleotide excision repair, non-small cell lung cancer, pancreatic cancer, and TGF-beta signaling pathway (B). Hub gene-associated cluster 2 (C) is associated with the enrichment of 3 KEGG pathways (ubiquitin-mediated proteolysis, oocyte meiosis, and proteasome (D)), and cluster 3 (E) is related to the enrichment of 3 other KEGG pathways (cell cycle, nucleotide excision repair, and pancreatic cancer (F)). It indicated that the hub genes-associated clusters are associated with the enrichment of cancer-related pathways in MM.
Figure 1. Construction of cluster-specific PPI of hub genes and cluster-specific pathway enrichment analysis. A. Hub genes of cluster 1 involved with PPI. B. KEGG pathways that are significantly associated with hub genes of cluster 1. C. Hub genes of cluster 2 involved with PPI. D. Three KEGG pathways are enriched in Cluster 2. E. PPI of hub genes in cluster 3. F. Three KEGG pathways are enriched associated with the hub genes of cluster 3. G-H. PPI of hub genes in cluster 4 and cluster 5.
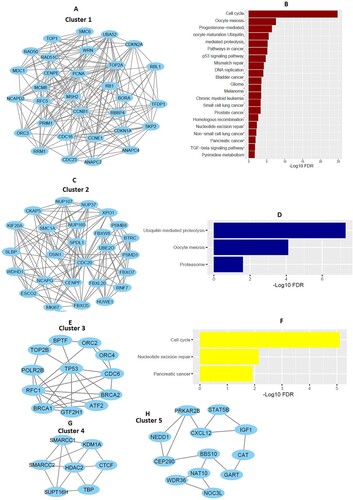
Table 3. MCODE identified hub gene-associated five significant clusters in MM.
3.4. DEmiRs target the differentially expressed hub genes in MM
We predicted the target genes of DEmiRs in bone marrow by using the miRNet [Citation19] (miRTarBase v8 and TarBase v8.0 were selected for predicting the genes). We predicted 10,995 genes for downregulated DEmiRs (B) and 3781 genes for upregulated DEmiRs (C) using miRNet, respectively. We found that the upregulated IGF1, IRF1, RPS28, UBA52, RPS19, CDKN1A, RNF7, PSMB8, and CDKN2A hub genes interact with the downregulated DEmiRs and the downregulated 52 hub genes (such as TP53, PCNA, BRCA1, CCNB1, POLR2B, TOP2A, MSH2, CDC6, BPTF, and CDC20) are interacted with the upregulated DEmiRs in bone marrow (Supplementary Table S6). Haimeng Yan et al. revealed that UBA52 and RPS19 are differentially expressed in MM and associated with the enrichment of signaling pathways [Citation43]. It was reported that TP53-inducible miRNAs are related to the development of MM [Citation44].
Figure 2. Differentially expressed hub genes were targeted by DEmiRs. A. Identification of upregulated and downregulated hub genes. B. The upregulated 9 hub genes interact with downregulated DEmiRs. C. The downregulated 52 hub genes interact with upregulated DEmiRs.
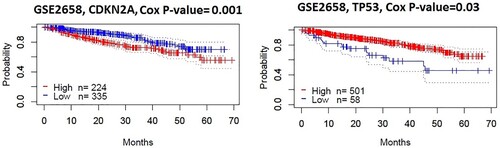
3.5. DEmiRs targeting hubs genes are associated with survival in MM
We investigated the survival of DEmiRs targeted all hub genes (9 upregulated and 52 downregulated). We used the Prognoscan [Citation28] for survival analysis and found that two hub genes (CDKN2A and TP53) had a negative expression correlation with survival prognosis (Disease-specific survival) in MM (GSE2658, n = 559). We found that the elevated level of upregulated hub gene CDKN2A is associated with poor prognosis, and the lower level of downregulated hub gene TP53 is correlated with a poor survival prognosis in MM patients ().
Figure 3. DEmiRs targeting hubs genes are associated with survival prognosis in multiple myeloma patients. Kaplan-Meier curves show that the expression of two hub genes (CDKN2A and TP53) correlates with survival prognosis (Disease-specific survival) in MM patients (log-rank test, P < 0.05).
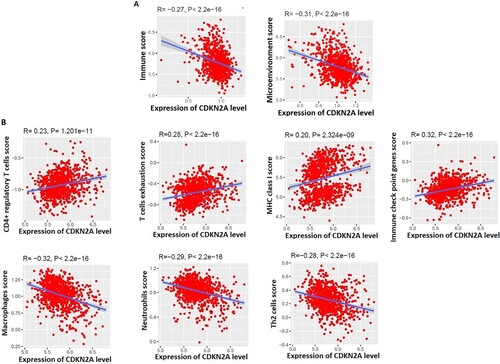
3.6. CDKN2A is associated with the regulation of tumor microenvironment in MM
The level of tumor-infiltrating lymphocytes (TILs) is an independent predictor of survival in cancer [Citation45]. We investigated the correlations between the expression levels of two hub genes (CDKN2A and TP53) and the levels of immune signatures in the TME of MM. Interestingly, we found that the expression level of CDKN2A is negatively correlated with immune scores (R = −0.27, P < 2.2e-16) and microenvironment scores (R = −0.31, P < 2.2e-16) (A), but TP53 is not correlated with immune scores and tumor microenvironment scores. Furthermore, the expression level of CDKN2A is positively correlated with CD4+ Regulatory T cells, T cell exhaustion, MHC Class I, and immune checkpoint genes (B) and negatively correlated with the macrophages, Neutrophils, and TH2 cells in the TME of MM (B). It was indicated that the CD4 T cells are responsible for controlling autoimmune phenomena in MM [Citation46]. T cell exhaustion in multiple myeloma is associated with the relapse of the disease [Citation47]. Immune checkpoint pathways are associated with impeding antitumor immune responses and contributing to malignancy's persistence and/or relapse [Citation48]. Macrophages and neutrophils are now considered critical regulatory components of the hematopoietic niche [Citation49]. Altogether, these results indicate that the expression level of CDKN2A is associated with the immunosuppressive TME in MM.
Figure 4. The expression level of CDKN2A is associated with the regulation of the tumor microenvironment in MM. A. Immune scores and microenvironment scores are negatively correlated with the expression levels of CDKN2A. B. Immune signatures are significantly correlated with the expression levels of CDKN2A.
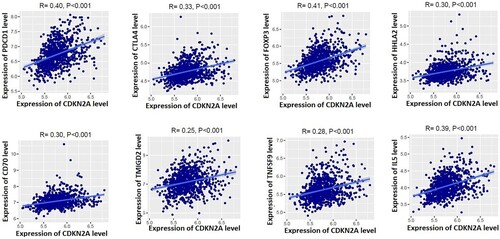
3.7. CDKN2A is positively correlated with immunosuppressive markers in MM
Since CD4+ Regulatory T cells, T cell exhaustion, and immune checkpoint genes are positively correlated with the expression levels of CDKN2A (Figure B), we calculated the correlation of marker genes with the expression of CDKN2A. Interestingly, we found that the immunosuppressive markers including PDCD1 (PD-1), CTLA4, FOXP3, HHLA2, CD70, TMIGD2, TNFSF9, and IL5 are positively correlated with the expression levels of CDKN2A in the TME of MM (). The Akt pathway is activated in MM through PD-1-bound PD-L1, which ultimately plays a substantial role in the progression of MM disease [Citation50]. Walter et al. discovered that the expression levels of FOXP3 and CTLA4 presented a sixfold and 30-fold higher, respectively, in MM patients than in controls [Citation51]. Another immunosuppressive marker, HHLA2, significantly reduces cytokine production by T cells that ultimately inhibit the functions of CD8 T-cells [Citation52]. It suggests that the expression level of CDKN2A is associated with the immunosuppressive TME in MM.
Figure 5. Positive correlation of CDKN2A with immunosuppressive markers in MM microenvironment. Immunosuppressive markers PDCD1 (PD-1), CTLA4, FOXP3, HHLA2, CD70, TMIGD2, TNFSF9, and IL5 are positively correlated with the expression levels of CDKN2A in the microenvironment of MM.
3.8. The expression validation of CDKN2A and its co-regulatory DEmiRs in the independent MM cohorts
Since CDKN2A is associated with the survival prognosis and immune infiltrations in MM, we validated the expression level of CDKN2A and its co-regulatory miRNAs (). We utilized the GSE16558 [Citation17] and GSE13591[Citation18] for the expression level validation of CDKN2A and its co-regulatory miRNAs, including hsa-mir-492, hsa-mir-24, hsa-mir-192, and hsa-mir-10b (). Interestingly, we found that these four co-regulatory miRNAs (hsa-mir-492, hsa-mir-24, hsa-mir-192, and hsa-mir-10b) are consistently downregulated in the GPL8695 of GSE16558 (Wilcoxon rank-sum test, P < 0.05) (A). Moreover, we revealed that the expression level of CDKN2A is consistently upregulated in the GSE16558 and GSE13591 (Wilcoxon rank-sum test, P < 0.05) (B). It indicates that the expression level CDKN2A and its co-regulatory miRNAs are consistently deregulated in MM patients.
Figure 6. The expression validation of CDKN2A and its co-regulatory DEmiRs in the independent MM cohorts. A. The expression level of CDKN2A co-regulatory miRNAs: hsa-mir-492, hsa-mir-24, hsa-mir-192, and hsa-mir-10b are consistently downregulated in the GSE16558. B. The expression level of CDKN2A is consistently upregulated in the GSE16558 [Citation17] and GSE13591[Citation18].
![Figure 6. The expression validation of CDKN2A and its co-regulatory DEmiRs in the independent MM cohorts. A. The expression level of CDKN2A co-regulatory miRNAs: hsa-mir-492, hsa-mir-24, hsa-mir-192, and hsa-mir-10b are consistently downregulated in the GSE16558. B. The expression level of CDKN2A is consistently upregulated in the GSE16558 [Citation17] and GSE13591[Citation18].](/cms/asset/198fe93d-f48c-4f8b-baaa-4ed99303980d/yhem_a_2068873_f0006_oc.jpg)
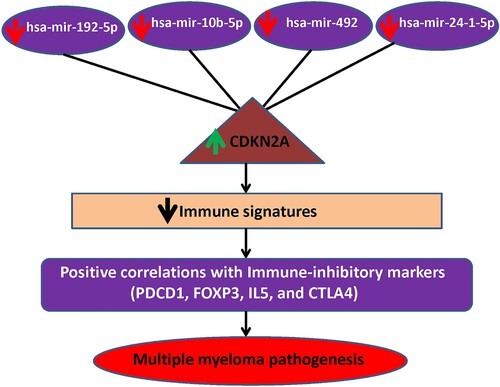
Figure 7. MiRNA-CDKN2A interactions in MM. The downregulation of miRNAs interacts with the upregulation of CDKN2A. This co-regulatory network is associated with the immunosuppressive TME of MM.
4. Discussion
We identified DEGs in MM by a meta-analysis of two gene expression datasets. In addition, DEmiRs were identified in MM relative to normal cells. We found that several enriched pathways are associated with DEmiRs (). The pathways mainly involved cancers, cellular signaling, and immune regulations. PPI-based analysis revealed that the hub genes are involved in significant clusters associated with KEGG pathway enrichments (). Based on the differentially expressed genes and miRNA, we build mRNA-miRNA regulatory networks in MM. Two DEmiRs targeting hub genes (CDKN2A and TP53) are linked with the survival prognosis of MM patients (). The CDKN2A is upregulated (LogFC = 2.0529 and adjusted P value = 7.82E-05) in MM patients, and the survival probability of the upregulated-CDKN2A group is lower in MM patients. In contrast, the lower expression group of downregulated-TP53 group (LogFC = −1.7835and adjusted P value = 0.0005) is correlated with a shorter survival time in MM patients. It indicates that the higher expression group of CDKN2A and the lower expression group of TP53 are associated with poor survival prognosis in MM. Since the level of immune infiltration is an independent predictor of survival in cancer [Citation45], we investigated the correlation of CDKN2A and TP53 with the immune infiltration levels in the bone marrow microenvironment of MM. First, the expression level of CDKN2A is negatively correlated with immune scores and microenvironment scores (A), indicating that the higher expression level of CDKN2A is associated with lowering the immunity in MM patients. Second, the expression level of CDKN2A is positively correlated with various cells, including CD4+ Regulatory T cells, T cell exhaustion, MHC Class I, and immune checkpoint genes, and negatively correlated with macrophages, neutrophils, and TH2 cells in the TME of MM (B). Third, the immunosuppressive markers including PDCD1, CTLA4, FOXP3, and IL5 are positively correlated with the expression levels of CDKN2A (). It suggests that the higher expression level of CDKN2A is associated with the suppression of TME by depressing the immune-modulatory cellular components and activating the immunosuppressive markers and immune-inhibitory cellular components. Altogether, CDKN2A mediated the MM pathogenesis by regulating the bone immune microenvironment.
Based on the hub genes and their regulatory DEmiRs, we constructed miRNA-mRNA regulatory networks in MM that may be associated with the regulation of the bone microenvironment. These networks included the hsa-mir-192-5p-CDKN2A, hsa-mir-10b-5p-CDKN2A, hsa-mir-492-CDKN2A, and hsa-mir-24-1-5p-CDKN2A (). In newly diagnosed MM patients, the overexpression of CDKN2A is associated with a shorter survival time [Citation53]. In the human tumor, a lower expression level of miR-192 could predict poor clinical outcomes in several cancer types [Citation54]. The deregulated expression level of hsa-mir-10b is a fundamental miRNA in various metastatic cancer [Citation55]. The aberrant expression of miR-24 contributes to tumorigenesis, tumor progression, and poor clinical outcomes in multiple cancers [Citation56]. Moreover, our validation results revealed that the expression of the level of CDKN2A, hsa-mir-492, hsa-mir-24, hsa-mir-192, and hsa-mir-10b is consistently deregulated in the MM cohorts (). This result suggests that the hsa-mir-192-5p-CDKN2A, hsa-mir-10b-5p-CDKN2A, hsa-mir-492-CDKN2A, and hsa-mir-24-1-5p-CDKN2A networks may be contribute to the immunosuppression in MM ().
Some previous studies tried to identify the microRNA-mRNA regulatory networks in multiple myeloma. For example, Hongyu Gao et al. identified the miR-135b-GADD45A and miR-148a-USPL1 pairs in MM [Citation57]. Yang Yang et al. identified DEmRs and predicted their targets [Citation58]. Also, Marta Lionetti et al. identified microRNA expression patterns and predicted microRNA/mRNA regulatory networks in distinct molecular groups of multiple myeloma[Citation59]. However, these authors did not discover how these co-regulatory networks are associated with the regulation of TME in MM. For the first time, we identified the hsa-mir-192-5p-CDKN2A, hsa-mir-10b-5p-CDKN2A, hsa-mir-492-CDKN2A, and hsa-mir-24-1-5p-CDKN2A pairs in MM, which ultimately associated with immunosuppressive TME (). The major drawback of this study is that the MM-associated miRNA–mRNA regulatory network identified by bioinformatics analysis has not been validated by experimental research. Thus, although our findings could provide potential biomarkers for multiple myeloma diagnosis and therapeutic targets, further experimental and clinical validation is necessary to transform these results into practical application in MM treatments.
5. Conclusions
Identifying key genes and miRNA-mRNA regulatory networks in MM may provide new molecular insights into the miRNA-mRNA regulatory networks mediated mechanism of the bone marrow tumor immune microenvironment in the MM.
Authors’ contributions
All authors have contributed to the research concept, design, and interpretation of the data. All authors reviewed and approved the final version of the document.
Supplemental Material
Download MS Word (12.1 KB)Supplemental Material
Download MS Word (13.8 KB)Supplemental Material
Download MS Word (40.2 KB)Supplemental Material
Download MS Word (13 KB)Supplemental Material
Download MS Word (21.8 KB)Supplemental Material
Download MS Word (21 KB)Data availability
The GEO datasets GSE125363, GSE125361, GSE47552, GSE2658, GSE136324, GSE16558, and GSE13591 used in this study are available in The National Biotechnology Information Center Gene (NCBI-Gene) database (https://www.ncbi.nlm.nih.gov/gene).
Disclosure statement
No potential conflict of interest was reported by the author(s).
Additional information
Funding
Related Research Data
References
- Contributors MM, Firth J. Haematology: Multiple myeloma. Clin. Med. 2019;19:58–60. doi:10.7861/clinmedicine.19-1-58.
- Pawlyn C, Morgan GJ. Evolutionary Biology of high-risk Multiple myeloma. Nat Rev Cancer. 2017;17:543–556. doi:10.1038/nrc.2017.63.
- Hou J, Wei R, Qian J, et al. The impact of the bone marrow microenvironment on Multiple Myeloma (review). Oncol. Rep. 2019;42:1272–1282. doi:10.3892/or.2019.7261.
- Manier S, Sacco A, Leleu X, et al. Bone marrow microenvironment in Multiple Myeloma progression. J. Biomed. Biotechnol. 2012;2012:e157496), doi:10.1155/2012/157496.
- Ribatti D, Nico B, Vacca A. Importance of the bone marrow microenvironment in inducing the Angiogenic response in Multiple myeloma. Oncogene. 2006;25:4257–4266. doi:10.1038/sj.onc.1209456.
- Kawano Y, Moschetta M, Manier S, et al. Targeting the bone marrow microenvironment in Multiple myeloma. Immunol. Rev. 2015;263:160–172. doi:10.1111/imr.12233.
- Raimondi L, De Luca A, Morelli E, et al. MicroRNAs: novel crossroads between Myeloma Cells and the bone marrow microenvironment. BioMed Res. Int. 2016;2016:e6504593), doi:10.1155/2016/6504593.
- Soley L, Falank C, Reagan MR. MicroRNA transfer between bone marrow adipose and Multiple Myeloma cells. Curr. Osteoporos. Rep. 2017;15:162–170. doi:10.1007/s11914-017-0360-5.
- Wang W, Corrigan-Cummins M, Barber EA, et al. Aberrant levels of MiRNAs in bone marrow microenvironment and peripheral Blood of Myeloma patients and disease progression. J. Mol. Diagn. JMD. 2015;17:669–678. doi:10.1016/j.jmoldx.2015.06.006.
- Fulciniti M, Amodio N, Bandi RL, et al. MiR-23b/SP1/c-Myc forms a feed-forward Loop Supporting Multiple Myeloma cell growth. Blood Cancer J. 2016;6:e380), doi:10.1038/bcj.2015.106.
- Bong IPN, Ng CC, Baharuddin P, et al. MicroRNA Expression Patterns and target prediction in Multiple Myeloma Development and malignancy. Genes Genomics. 2017;39:533–540. doi:10.1007/s13258-017-0518-7.
- Löffler D, Brocke-Heidrich K, Pfeifer G, et al. Interleukin-6 dependent survival of Multiple Myeloma cells involves the Stat3-mediated induction of MicroRNA-21 through a highly conserved enhancer. Blood. 2007;110:1330–1333. doi:10.1182/blood-2007-03-081133.
- Farswan A, Gupta A, Gupta R, et al. Imputation of gene expression data in Blood Cancer and Its Significance in inferring biological pathways. Front. Oncol. 2020;9:1–14. doi:10.3389/fonc.2019.01442.
- López-Corral L, Corchete LA, Sarasquete ME, et al. Transcriptome analysis Reveals molecular Profiles associated with evolving steps of monoclonal gammopathies. Haematologica. 2014;99:1365–1372. doi:10.3324/haematol.2013.087809.
- Hanamura I, Huang Y, Zhan F, et al. Prognostic Value of cyclin D2 MRNA expression in Newly Diagnosed Multiple Myeloma treated with high-dose chemotherapy and tandem autologous stem cell transplantations. Leukemia. 2006;20:1288–1290. doi:10.1038/sj.leu.2404253.
- Danziger SA, McConnell M, Gockley J, et al. Bone marrow microenvironments that contribute to patient outcomes in Newly Diagnosed Multiple Myeloma: A cohort study of patients in the total therapy clinical trials. PLoS Med. 2020;17:e1003323), doi:10.1371/journal.pmed.1003323.
- Gutiérrez NC, Sarasquete ME, Misiewicz-Krzeminska I, et al. Deregulation of MicroRNA expression in the different genetic subtypes of Multiple Myeloma and correlation with gene expression profiling. Leukemia. 2010;24:629–637. doi:10.1038/leu.2009.274.
- Agnelli L, Mosca L, Fabris S, et al. A SNP Microarray and FISH-based procedure to detect allelic imbalances in Multiple myeloma: An Integrated Genomics Approach Reveals a Wide gene dosage effect. Genes. Chromosomes Cancer. 2009;48:603–614. doi:10.1002/gcc.20668.
- Fan Y, Siklenka K, Arora SK, et al. MiRNet - dissecting MiRNA-target interactions and Functional associations through Network-Based Visual analysis. Nucleic Acids Res. 2016;44:W135–W141. doi:10.1093/nar/gkw288.
- Kanehisa M, Furumichi M, Tanabe M, et al. KEGG: New perspectives on genomes, pathways, diseases and drugs. Nucleic Acids Res. 2017;45:D353–D361. doi:10.1093/nar/gkw1092.
- Vlachos IS, Zagganas K, Paraskevopoulou MD, et al. DIANA-MiRPath v3.0: deciphering MicroRNA function with Experimental support. Nucleic Acids Res. 2015;43:W460–W466. doi:10.1093/nar/gkv403.
- Paraskevopoulou MD, Georgakilas G, Kostoulas N, et al. DIANA-MicroT Web server v5.0: service integration into MiRNA Functional analysis workflows. Nucleic Acids Res. 2013;41:W169–W173. doi:10.1093/nar/gkt393.
- Vlachos IS, Paraskevopoulou MD, Karagkouni D, et al. DIANA-TarBase v7.0: indexing more than half a million experimentally supported MiRNA:MRNA interactions. Nucleic Acids Res. 2015;43:D153–D159. doi:10.1093/nar/gku1215.
- Szklarczyk D, Gable AL, Lyon D, et al. STRING v11: protein–protein Association networks with increased coverage, Supporting Functional discovery in Genome-Wide Experimental datasets. Nucleic Acids Res. 2019;47:D607–D613. doi:10.1093/nar/gky1131.
- Chin C-H, Chen S-H, Wu H-H, et al. Cytohubba: identifying Hub objects and Sub-networks from Complex interactome. BMC Syst. Biol. 2014;8:S11), doi:10.1186/1752-0509-8-S4-S11.
- Shannon P, Markiel A, Ozier O, et al. Cytoscape: A software environment for Integrated models of biomolecular interaction networks. Genome Res. 2003;13:2498–2504. doi:10.1101/gr.1239303.
- Subramanian A, Tamayo P, Mootha VK, et al. Gene Set enrichment analysis: A knowledge-based Approach for interpreting Genome-Wide expression profiles. Proc. Natl. Acad. Sci. U. S. A. 2005;102:15545–15550. doi:10.1073/pnas.0506580102.
- Mizuno H, Kitada K, Nakai K, et al. Prognoscan: A New database for meta-analysis of the Prognostic Value of genes. BMC Med. Genomics. 2009;2:18), doi:10.1186/1755-8794-2-18.
- Aran D, Hu Z, Butte AJ. XCell: digitally portraying the tissue cellular heterogeneity landscape. Genome Biol. 2017;18:220. doi:10.1186/s13059-017-1349-1.
- Hänzelmann S, Castelo R, Guinney J. GSVA: Gene Set variation analysis for Microarray and RNA-Seq data. BMC Bioinformatics. 2013;14:7), doi:10.1186/1471-2105-14-7.
- Xia J, Gill EE, Hancock REW. NetworkAnalyst for statistical, Visual and Network-Based meta-analysis of gene expression data. Nat. Protoc. 2015;10:823–844. doi:10.1038/nprot.2015.052.
- Yin C, Zheng X, Xiang H, et al. Differential expression Profile analysis of cisplatin-regulated MiRNAs in a Human gastric cancer cell line. Mol. Med. Rep. 2019;20:1966–1976. doi:10.3892/mmr.2019.10430.
- Fateh A, Feizi MAH, Safaralizadeh R, et al. Importance of MiR-299-5p in Colorectal cancer. Ann. Gastroenterol. 2017;30:322–326. doi:10.20524/aog.2017.0139.
- Ganesan S, Palani HK, Lakshmanan V, et al. Stromal cells downregulate MiR-23a-5p to activate protective autophagy in Acute myeloid leukemia. Cell Death Dis. 2019;10:736. doi:10.1038/s41419-019-1964-8.
- Krist B, Florczyk U, Pietraszek-Gremplewicz K, et al. The Role of MiR-378a in metabolism, angiogenesis, and muscle biology. Int. J. Endocrinol. 2015;2015:e281756), doi:10.1155/2015/281756.
- Purushothaman A, Toole BP. Serglycin Proteoglycan Is required for Multiple Myeloma cell adhesion, in vivo growth, and vascularization. J. Biol. Chem. 2014;289:5499–5509. doi:10.1074/jbc.M113.532143.
- Kyriazoglou A, Ntanasis-Stathopoulos I, Terpos E, et al. Emerging insights into the Role of the Hippo pathway in Multiple Myeloma and associated bone disease. Clin. Lymphoma Myeloma Leuk. 2020;20:57–62. doi:10.1016/j.clml.2019.09.620.
- Dong M, Blobe GC. Role of transforming Growth factor-β in hematologic malignancies. Blood. 2006;107:4589–4596. doi:10.1182/blood-2005-10-4169.
- Xiong T, Luo Z. The expression of actin-related protein 2/3 Complex subunit 5 (ARPC5) expression in Multiple Myeloma and Its prognostic significance. Med. Sci. Monit. Int. Med. J. Exp. Clin. Res. 2018;24:6340–6348. doi:10.12659/MSM.908944.
- Sprynski AC, Hose D, Caillot L, et al. The Role of IGF-1 as a major Growth factor for Myeloma cell lines and the prognostic relevance of the expression of Its receptor. Blood. 2009;113:4614–4626. doi:10.1182/blood-2008-07-170464.
- Viziteu E, Klein B, Basbous J, et al. RECQ1 helicase Is involved in replication stress survival and Drug resistance in Multiple myeloma. Leukemia. 2017;31:2104–2113. doi:10.1038/leu.2017.54.
- Chen S, Xiao Z, Zhou J, et al. ZNF382: a Transcription inhibitor down-regulated in Multiple tumors Due to promoter methylation. Clin. Chim. Acta Int. J. Clin. Chem. 2020;500:220–225. doi:10.1016/j.cca.2019.10.021.
- Yan H, Zheng G, Qu J, et al. Identification of Key Candidate genes and pathways in Multiple Myeloma by Integrated bioinformatics analysis. J. Cell. Physiol. 2019;234:23785–23797. doi:10.1002/jcp.28947.
- Pichiorri F, Suh S-S, Rocci A, et al. Downregulation of P53-inducible MicroRNAs 192, 194, and 215 impairs the P53/MDM2 autoregulatory Loop in Multiple Myeloma development. Cancer Cell. 2010;18:367–381. doi:10.1016/j.ccr.2010.09.005.
- Ohtani H. Focus on TILs: Prognostic Significance of tumor infiltrating lymphocytes in Human Colorectal cancer. Cancer Immun. 2007;7:4.
- Joshua DE, Brown RD, Ho PJ, et al. Regulatory T cells and Multiple myeloma. Clin Lymphoma Myeloma. 2008;8:283–286. doi:10.3816/CLM.2008.n.039.
- Chung DJ, Pronschinske KB, Shyer JA, et al. T cell exhaustion in Multiple Myeloma relapse after autotransplant: optimal timing of immunotherapy. Cancer Immunol. Res. 2016;4:61–71. doi:10.1158/2326-6066.CIR-15-0055.
- Kim H-J, Cantor H. The path to reactivation of antitumor immunity and checkpoint immunotherapy. Cancer Immunol. Res. 2014;2:926–936. doi:10.1158/2326-6066.CIR-14-0153.
- Cossío I, Lucas D, Hidalgo A. Neutrophils as regulators of the hematopoietic niche. Blood. 2019;133:2140–2148. doi:10.1182/blood-2018-10-844571.
- Tamura H, Ishibashi M, Sunakawa-Kii M, et al. PD-L1–PD-1 pathway in the pathophysiology of Multiple myeloma. Cancers (Basel). 2020;12:1–14. doi:10.3390/cancers12040924.
- Braga WMT, da Silva BR, de Carvalho AC, et al. FOXP3 and CTLA4 overexpression in Multiple Myeloma bone marrow as a sign of accumulation of CD4(+) T regulatory cells. Cancer Immunol. Immunother. CII. 2014;63:1189–1197. doi:10.1007/s00262-014-1589-9.
- Zhao R, Chinai JM, Buhl S, et al. HHLA2 is a member of the B7 family and inhibits Human CD4 and CD8 T-cell function. Proc. Natl. Acad. Sci. U. S. A. 2013;110:9879–9884. doi:10.1073/pnas.1303524110.
- Kryukov F, Dementyeva E, Kubiczkova L, et al. Cell cycle genes Co-expression in Multiple Myeloma and plasma cell leukemia. Genomics. 2013;102:243–249. doi:10.1016/j.ygeno.2013.06.007.
- Wu SY, Rupaimoole R, Shen F, et al. A MiR-192-EGR1-HOXB9 regulatory network controls the Angiogenic switch in cancer. Nat. Commun. 2016;7:11169), doi:10.1038/ncomms11169.
- Sheedy P, Medarova Z. The fundamental Role of MiR-10b in metastatic cancer. Am. J. Cancer Res. 2018;8:1674–1688.
- Wang S, Liu N, Tang Q, et al. MicroRNA-24 in cancer: A double side medal With opposite properties. Front. Oncol. 2020;10:1–9. doi:10.3389/fonc.2020.553714.
- Gao H, Wang H, Yang W. Identification of Key genes and Construction of MicroRNA-MRNA regulatory networks in Multiple Myeloma by Integrated Multiple GEO datasets using bioinformatics analysis. Int. J. Hematol. 2017;106:99–107. doi:10.1007/s12185-017-2216-2.
- Yang Y, Ding R, Wang R. Identification of Candidate targets and mechanisms involved in MiRNA regulation in Multiple myeloma. World J. Surg. Oncol. 2022;20:23), doi:10.1186/s12957-021-02482-1.
- Lionetti M, Biasiolo M, Agnelli L, et al. Identification of MicroRNA Expression Patterns and definition of a MicroRNA/MRNA regulatory network in distinct molecular groups of Multiple myeloma. Blood. 2009;114:e20–e26. doi:10.1182/blood-2009-08-237495.