
ABSTRACT
Objective: Long non-coding RNA ANGPTL1-3 (lnc-ANGPTL1-3) is previously observed to induce bortezomib resistance via targeting microRNA-30a (miR-30a) in multiple myeloma (MM). Hence, this study aimed to further explore the relationship between lnc-ANGPTL1-3 and miR-30a and their linkage with disease properties and prognosis in bortezomib-treated MM patients.
Methods: Fifty-nine MM patients underwent treatment with the bortezomib-based regimen, and 30 healthy donors were consecutively enrolled. Bone marrow samples were collected from MM patients (before therapy) and healthy donors; then, plasma cells were separated for lnc-ANGPTL1-3 and miR-30a detection by RT-qPCR. Then treatment response, progression-free survival (PFS), and overall survival (OS) of MM patients were assessed.
Results: Lnc-ANGPTL1-3 was upregulated while miR-30a was downregulated in MM patients compared to healthy donors (both P < 0.001), then a negative correlation between lnc-ANGPTL1-3 and miR-30a was found in MM patients (P < 0.001) instead of in health donors (P = 0.188). In MM patients, lnc-ANGPTL1-3 correlated with increased t (4;14) (P = 0.033), Del (17p) (P = 0.018), ISS stage (P = 0.020), R-ISS stage (P = 0.025) but not t (14;16) (P = 0.255) or Durie-Salmon stage (P = 0.186); while miR-30a only related to decreased t (14;16) (P = 0.025) and R-ISS stage (P = 0.006). Besides, lnc-ANGPTL1-3 predicted lower complete response (CR) (P = 0.034), poor PFS (P = 0.016) and OS (P = 0.041) but not objective response rate (ORR) (P = 0.128). However, miR-30a forecasted higher CR (P = 0.013), prolonged PFS (P = 0.014), and OS (P = 0.045) but not ORR (P = 0.407).
Conclusion: Lnc-ANGPTL1-3 negative correlates with miR-30a, which links with key cytogenetic features, ISS/R-ISS stage, and prognosis in MM patients who underwent treatment of bortezomib-based regimen.
Introduction
Multiple myeloma (MM), a currently incurable hematological malignancy, ranks second in the prevalence of hematological cancers, with an estimated worldwide 5-year prevalence of 230,000 patients [Citation1–3]. As a disease derived from uncontrolled proliferation of plasma cells in the bone marrow and featured by the hypercalcemia, renal insufficiency, anemia, and bone lesions (CRAB) syndrome, MM patients have to suffer from multiple systemic symptoms and a decrease in life span that is presented as a median survival of about 24 months and a 5-year survival rate of roughly 50% [Citation4–7]. Although specific progress has been made in MM therapies, such as introducing novel drugs, various unsolved issues remain. For example, the patients participating in clinical trials for novel drugs are far from enough, and assistant biomarkers for MM patients are insufficient.
Long non-coding RNA (lncRNA) is a class of small molecules with almost no coding function; however, these small molecules are essential in many human diseases [Citation8–11]. In an aspect of MM, only a minimal number of functional lncRNAs are uncovered to engage in MM pathogenesis and treatment resistance, such as lncRNA DANCR, MALAT1, and LINC01003 [Citation12–14]. Inspiringly, a recent study observes a novel lncRNA, named ANGPTL1-3, which induces bortezomib resistance via targeting microRNA-30a (miR-30a) in MM [Citation15]. Besides, miR-30a is reported to be an essential gene involved in drug resistance to hematological malignancies [Citation16–18]. However, their clinical implication in MM is still obscure.
Therefore, the present study aimed to further explore the relationship between lncRNA ANGPTL1-3 (lnc-ANGPTL1-3) and miR-30a and their linkage with disease properties and prognosis in bortezomib-treated MM patients.
Methods
Patients and controls
In this prospective study, 59 patients with untreated MM admitted to the hospital between April 2017 and September 2020 were consecutively enrolled. All enrolled patients were diagnosed as MM by International Myeloma Working Group (IMWG) diagnostic criteria [Citation19], were older than 18 years old, and underwent treatment with the bortezomib-based regimen. While patients were ineligible for enrollment if they were diagnosed with asymptomatic myeloma or monoclonal gammopathy of undetermined significance (MGUS), complicated with other cancers/malignancies, infected with human immunodeficiency virus, received therapy for MM before enrollment, or were in pregnancy. Besides, 30 healthy bone marrow donors who underwent bone marrow donation in our hospital were recruited and served as healthy controls in the study analysis. Ethics approval was obtained from the Institutional Review Board. After fully understanding the study contents, all subjects agreed to use their bone marrow samples for this study, and all subjects signed the informed consent.
Clinical feature documentation
The following crucial clinical features of MM patients were documented for study analysis: age, gender, immunoglobulin subtype, bone lesion, renal impairment, hemoglobin, calcium, serum creatinine, albumin, Beta-2-microglobulin, lactate dehydrogenase, cytogenetics abnormality, Durie-Salmon (DS) stage, International Staging System (ISS) stage and revised ISS (R-ISS) stage. The threshold for the cytogenetic abnormality was set referring to the mean ± three times of standard deviation of abnormal cell number (with cytogenetic abnormality) in total cell number (100 cells at least per analysis) observed from 20 normal bone marrow specimens. In detail, the cut-off value for cytogenetic abnormality was set as 6.5% for 1R, 2G, and 5.5% for 1R, 1G.
Plasma cell separation
Bone marrow samples were collected from MM patients (before therapy) and health controls. CD138 MicroBeads (Miltenyi Biotec, Cologne, Bergischladbach, Germany) were used for the positive selection of plasma cells from the bone marrow samples. All the experiment procedures of plasma cell isolation were performed as described on the product’s official website (available at www.miltenyibiotec.com). After separating plasma cells, a reverse transcription-quantitative polymerase chain reaction (RT-qPCR) assay was carried out to determine the expression of lnc-ANGPTL1-3 and miR-30a.
RT-qPCR procedure
First of all, the total RNA was extracted from the plasma cells using TRIzol™ Reagent (Thermo Fisher Scientific, Waltham, Massachusetts, USA), then reverse transcription of the RNA was performed by iScript™ cDNA Synthesis Kit (with random primer) (Bio-Rad, Hercules, California, USA). Subsequently, the qPCR was conducted using KOD SYBR® qPCR Mix (Toyobo, Osaka, Kansai, Japan). Afterward, lncRNA and mRNA relative expression was detected using GAPDH as an internal reference, and miRNA relative expression was assessed using U6 as an internal reference. The method used for relative expression calculation was 2-ΔΔCt. In addition, the sequences of primers were designed referring to previous studies [Citation15, Citation16].
Treatment and follow-up
All MM patients received induction therapy based on bortezomib for four 21-day cycles with the regimen of BD (bortezomib and dexamethasone) or BTD (bortezomib, thalidomide, and dexamethasone). The detailed administration was as follows: bortezomib 1.3/m2 on days 1, 4, 8, and 11 intravenously; dexamethasone 40 mg on days 1–4 (all cycles) and on days 9–12 (cycle 1–2) intravenously; thalidomide 100 mg/day orally; then the response to induction treatment (such as complete response (CR), very good partial response (VGPR) and partial response (PR)) was evaluated by the IMWG criteria [Citation20]. The objective response rate (ORR) was calculated as ORR = CR + VGPR + PR. After that, if the CR were achieved, the patients would receive the hematopoietic stem cell transplantation (HSCT) if a suitable donor was available (in this study, a total of 12 (20.3%) patients received the HSCT). Then, patients received the bortezomib or thalidomide as the maintenance treatment. In the present study, continuous follow-up for MM patients was administered until 31 September 2021. Progression-free survival (PFS) and overall survival (OS) were estimated for study analysis according to the IMWG guideline [Citation20].
Statistical analysis
SPSS 20.0 (IBM Corp., Armonk, New York, USA) was applied for data analysis. Mean values with standard deviation (SD), median value with interquartile range (IQR), and count (percentage) were calculated to characterize the variables. Difference analysis of lnc-ANGPTL1-3 and miR-30a expression between groups was determined by the Mann–Whitney U test. Association analysis between variables was completed by Spearman’s rank correlation test. Kaplan-Meier curve was used to show the profiles of PFS and OS, which were determined by a log-rank test. Statistical significance was concluded if a P-value <0.05 was presented in the corresponding analysis.
Results
Mm patients’ characteristics at baseline
The MM patients in our study presented with a mean age of 54.5 ± 8.3 years and a median age of 55.0 (48.0–61.0) years (). The number of males was 35 (59.3%). In addition, the numbers of patients with immunoglobulin subtypes of immunoglobulin G, immunoglobulin A, and others were 30 (50.8%), 12 (20.3%), and 17 (28.8%), respectively. 44 (74.6%) patients with the bone lesion and 24 (40.7%) patients with renal impairment. The mean and median Calcium levels were 9.8 ± 2.1 mg/dL and 9.7 (8.5–11.3) mg/dL, respectively. The numbers of patients who had t (4; 14), t (14; 16) and Del (17p) were 7 (11.9%), 3 (5.1%) and 5 (8.5%), respectively. The numbers of patients in DS stage I, II, and III were 0 (0.0%), 6 (10.2%), and 53 (89.8%), respectively. The numbers of patients in ISS stage I, II, and III were 6 (10.2%), 24 (40.7%), and 29 (49.2%), respectively. Besides, there were 3 (5.1%) patients in R-ISS stage I, 29 (49.2%) patients in R-ISS stage II, and 27 (45.8%) in R-ISS stage III, respectively. The information on other baseline characteristics was listed in .
Table 1. Baseline characteristics of MM patients
Lnc-ANGPTL1-3, miR-30a and their correlation in MM patients and controls
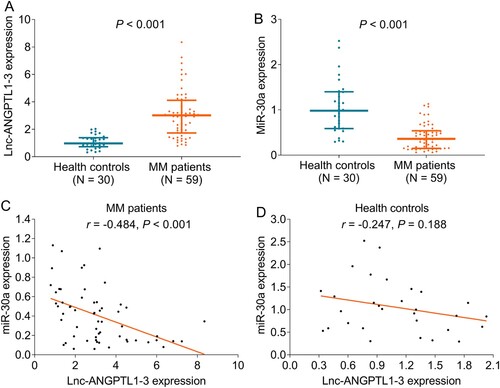
The lnc-ANGPTL1-3 expression was increased in MM patients compared to healthy donors (P < 0.001) (A), while the miR-30a expression was decreased in MM patients compared to healthy donors (P < 0.001) (B). In terms of the relationship between lnc-ANGPTL1-3 expression and miR-30a expression, they were negatively correlated in MM patients (P < 0.001) (C) but not in healthy donors (P = 0.188) (D).
Figure 1. Lnc-ANGPTL1-3 and miR-30a expressions in MM patients and healthy donors. The comparison of lnc-ANGPTL1-3 expression (A) and miR-30a expression (B) between MM patients and healthy donors and the correlation between lnc-ANGPTL1-3 expression and miR-30a expression in MM patients (C) and health donors (D).
Correlation of lnc-ANGPTL1-3 and miR-30a with cytogenetics or disease stages in MM patients
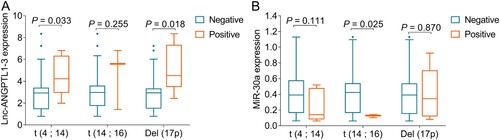
Lnc-ANGPTL1-3 expression was upregulated in patients with t (4;14) compared to patients without t (4;14) (P = 0.033), and was also elevated in patients with Del (17p) compared to patients without Del (17p) (P = 0.018) (A). However, it was of no difference between patients with t (14;16) and patients without t (14;16) (P = 0.255). As for miR-30a, its expression was downregulated in patients with t (14;16) compared to patients without t (14;16) (P = 0.025); however, miR-30a expression was not correlated with the t (4;14) (P = 0.111) or Del (17p) (P = 0.870) in MM patients (B).
Figure 2. Associations of lnc-ANGPTL1-3 and miR-30a with cytogenetics in MM patients. The associations of lnc-ANGPTL1-3 expression (A) and miR-30a expression (B) with t (4; 14), t (14; 16), and Del (17p) in MM patients.
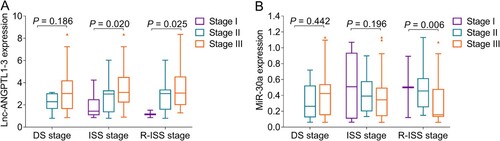
It was noteworthy that lnc-ANGPTL1-3 expression positively associated with ISS stage (P = 0.020) and R-ISS stage (P = 0.025) but not DS stage (P = 0.186) in MM patients (A); while, miR-30a expression negatively associated with R-ISS (P = 0.006) stage but not DS stage (P = 0.442) or ISS stage (P = 0.196) in MM patients (B).
Figure 3. Associations of lnc-ANGPTL1-3 and miR-30a with disease stages in MM patients. The associations of lnc-ANGPTL1-3 expression (A) and miR-30a expression (B) with DS stage, ISS stage, and R-ISS stage in MM patients.
Correlation of lnc-ANGPTL1-3 and miR-30a with treatment response in MM patients
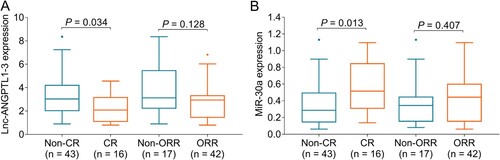
Lnc-ANGPTL1-3 expression was reduced in CR patients compared to non-CR patients (P = 0.034), while it was similar between ORR patients and non-ORR patients (P = 0.128) (A). In addition, miR-30a expression was upregulated in CR patients compared to non-CR patients (P = 0.013), while was no difference between ORR patients and non-ORR patients (P = 0.407) (B).
Figure 4. Associations of lnc-ANGPTL1-3 and miR-30a with treatment response in MM patients. The associations of lnc-ANGPTL1-3 expression (A) and miR-30a expression (B) with CR or ORR in MM patients.
Correlation of lnc-ANGPTL1-3 and miR-30a with survival profile in MM patients
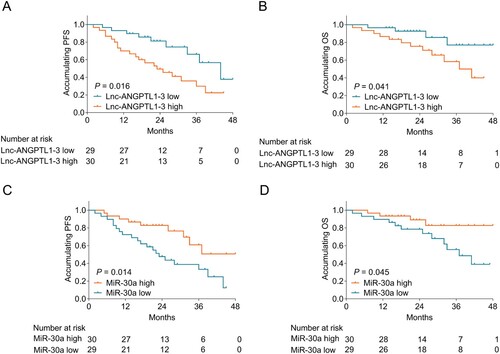
Lnc-ANGPTL1-3 expression negatively associated with PFS (P = 0.016) (A) and OS (P = 0.041) (B) in MM patients. As to miR-30a expression, it positively correlated with PFS (P = 0.014) (C) and OS (P = 0.045) (D) in MM patients.
Figure 5. Associations of lnc-ANGPTL1-3 and miR-30a with PFS and OS in MM patients. The association of lnc-ANGPTL1-3 expression with PFS (A) and OS (B) in MM patients and the association of miR-30a expression with PFS (C) and OS (D) in MM patients.
Correlation of c-Maf and Beclin1 with lnc-ANGPTL1-3, miR-30a, and survival profile in MM patients
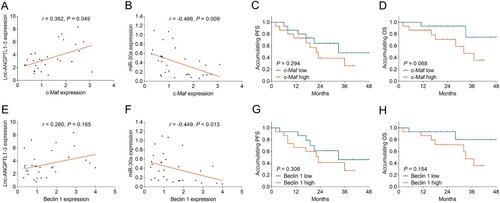
The miR-30a target genes (c-Maf and Beclin1) expressions were further detected in 30 MM patients. It showed that c-Maf was positively correlated with lnc-ANGPTL1-3 (P = 0.049) (A), while negatively related to miR-30a (P = 0.009) (B) in MM patients. Besides, c-Maf only showed a correlation trend with PFS and OS (without statistical significance) (Both P > 0.05) (C-D). In terms of Beclin1, it was negatively linked with miR-30a (P = 0.013) (F); while it only showed an association trend with lnc-ANGPTL1-3, PFS, and OS (without statistical significance) (All P > 0.05) (E, G-H).
Figure 6. Associations of c-Maf and Beclin1 with lnc-ANGPTL1-3, miR-30a, PFS, and OS in MM patients. The association of c-Maf with lnc-ANGPTL1-3 (A), miR-30a (B), PFS (C), and OS (D); The association of Beclin1 with lnc-ANGPTL1-3 (E), miR-30a (F), PFS (G), and OS (H) in MM patients.
Discussion
Although MM represents one of the most malignant hematological cancers, a technique developed for genetic analysis has fueled a move towards the understanding of molecular changes in MM, which consequently enhances patient management. Nevertheless, the improvement of MM management is far from sufficient because most of the benefits are only applicable to low-risk patients. Besides, these patients’ survival needs further improvement [Citation21–24]. Therefore, the present study was conducted based on the previous finding of a lncRNA related to carcinogenicity, lnc-ANGPTL1-3, and its target miRNA, miR-30a. Then we found that: (1) lnc-ANGPTL1-3 was upregulated while miR-30a was downregulated in MM patients compared to controls, and lnc-ANGPTL1-3 was negatively associated with miR-30a in MM patients. (2) Lnc-ANGPTL1-3 correlated with t (4; 14) and Del (17p), and miR-30a correlated with t (14; 16) in MM patients. (3) Lnc-ANGPTL1-3 positively correlated with ISS and R-ISS stage, and miR-30a negatively correlated with R-ISS stage in MM patients. (4) Lnc-ANGPTL1-3 predicted worse CR, PFS, and OS, while miR-30a forecasted better CR, PFS, and OS in MM patients who underwent treatment with the bortezomib-based regimen.
Several specific lncRNAs are identified to function in MM pathology and show potency as biomarkers reflecting MM features or prognosis [Citation25–29]. In the aspect of lnc-ANGPTL1-3, a previous study discloses that it binds to miR-30a and then regulates c-Maf, to promote MM resistance to bortezomib [Citation15]. Therefore, we hypothesized that lnc- ANGPTL1-3 may predict bortezomib response in MM patients. Thus, the present study explored whether lnc-ANGPTL1-3 could serve as an assistant biomarker in MM patient management. Then our results disclosed that lnc-ANGPTL1-3 was increased and correlated with t (4; 14) and Del (17p), increased ISS stage and R-ISS stage, not achieving CR and worse PFS as well as OS in MM patients. The possible explanations are as follows: Although the mechanistic role of lnc-ANGPTL1-3 should be further evaluated, it could still be deducted that lnc-ANGPTL1-3 probably promotes the progression of MM and bortezomib resistance as reported by the previous study, through targeting miR-30a and modifying c-Maf [Citation15].
Moreover, we also found that lnc-ANGPTL1-3 negatively correlated with miR-30a in MM patients. In addition, miR-30a was downregulated and correlated with t (14; 16), R-ISS stage, CR, PFS, and OS in MM patients. These may result from: (1) miR-30a has been revealed as a target of lnc-ANGPTL1-3 in MM cells; this might explain the negative correlation between them in MM patients [Citation15]. (2) miR-30a improves bortezomib resistance via c-Maf, contributing to better CR and prolonged survival [Citation15]. (3) miR-30a may also contribute to alleviated disease conditions of MM via regulating oncogenes or carcinogenic pathways like in other hematological malignancies, such as Beclin1, BCR/ABL, etc. [Citation16, Citation30].
Even though a previous study has discovered the value of lnc-ANGPTL1-3 in reflecting BTZ resistance, ISS stage, and correlation with OS. However, some innovations in our study are nonnegligible. In detail, (1) this study evaluates the clinical value of the downstream gene (miR-30a, c-Maf, and Beclin) in reflecting the clinical features as well as the prognosis; (2) this study analyzes the correlation of lncANGPTL1-3 with the downstream gene (miR-30a, c-Maf, and Beclin); (3) this study make analysis about the lncANGPTL1-3 with more clinical features of MM patients including t (4;14), t (14;16), Del (17p), DS stage, R-ISS stage; (4) this study also analyzes the correlation of lncANGPTL1-3 with treatment response of bortezomib based-induction therapy. (5) there are 59 MM patients in this study, which is numerically higher than that in the previous study (only 36 MM patients) [Citation15].
In the present study, several limitations should be discussed. First, the sample in our study consisted of 59 MM patients and 30 controls, which might be relatively insufficient. Second, since this was a cohort study, there might be recall bias. Third, lnc-ANGPTL1-3 was located in chromosome 1q, while the 1q gain/amplification was not collected in our research. Therefore, further study to detect the 1q information in MM patients was needed; Lastly, the majority of our patients were from the same area, and their median age was 55 years (relatively younger than that of the previous studies), which could cause selection bias.
Collectively, lnc-ANGPTL1-3 negative correlates with miR-30a, linking key cytogenetic features, ISS/R-ISS stage, and prognosis in bortezomib-treated MM patients. These indicate that lnc-ANGPTL1-3 and miR-30a may be potential biomarkers facilitating disease monitoring and prognostication in MM patients.
Author’s contribution
Fangfang Zhou analyzed the data and contributed to the writing. Liyin Guo drafted the manuscript and helped in shaping the manuscript. Fangfang Zhou and Liyin Guo designed the study, provided valuable suggestions, and reviewed the manuscript. All authors read and approved the final manuscript.
Disclosure statement
No potential conflict of interest was reported by the author(s).
Additional information
Funding
References
- Ruzafa JC, Merinopoulou E, Baggaley RF, et al. Patient population with multiple myeloma and transitions across different lines of therapy in the USA: an epidemiologic model. Pharmacoepidemiol Drug Saf. 2016;25(8):871–879.
- Padala SA, Barsouk A, Barsouk A, et al. Epidemiology, staging, and management of multiple myeloma. Med Sci (Basel). 2021;9(1):3.
- Albagoush SA, Azevedo AM. Multiple myeloma. Treasure Island (FL): StatPearls; 2021.
- Goldman-Mazur S, Kumar SK. Current approaches to management of high-risk multiple myeloma. Am J Hematol. 2021;96(7):854–871.
- Terpos E, Mikhael J, Hajek R, et al. Management of patients with multiple myeloma beyond the clinical-trial setting: understanding the balance between efficacy, safety and tolerability, and quality of life. Blood Cancer J. 2021;11(2):40.
- Landgren O, Rajkumar SV. New developments in diagnosis, prognosis, and assessment of response in multiple myeloma. Clin Cancer Res. 2016;22(22):5428–5433.
- Soh KT, Wallace PK. Evaluation of measurable residual disease in multiple myeloma by multiparametric flow cytometry: Current paradigm, guidelines, and future applications. Int J Lab Hematol. 2021;43(Suppl 1):43–53.
- Hudson QJ, Proestling K, Perricos A, et al. The role of long non-coding RNAs in endometriosis. Int J Mol Sci. 2021;22(21):11425.
- Ouyang J, Zhong Y, Zhang Y, et al. Long non-coding RNAs are involved in alternative splicing and promote cancer progression. Br J Cancer. 2021;126(8):1113–1124.
- Yao J, Du Y, Liu J, et al. Hypoxia related long non-coding RNAs in ischemic stroke. Noncoding RNA Res. 2021;6(4):153–158.
- Correia CCM, Rodrigues LF, de Avila Pelozin BR, et al. Long non-coding RNAs in cardiovascular diseases: potential function as biomarkers and therapeutic targets of exercise training. Noncoding RNA. 2021;7(4):65.
- Wu L, Xia L, Jiang H, et al. Long noncoding RNA DANCR represses the viability, migration and invasion of multiple myeloma cells by sponging miR135b5p to target KLF9. Mol Med Rep. 2021;24(3):649.
- Liu H, Chi Z, Jin H, et al. MicroRNA miR-188-5p as a mediator of long non-coding RNA MALAT1 regulates cell proliferation and apoptosis in multiple myeloma. Bioengineered. 2021;12(1):1611–1626.
- Wu L, Xia L, Chen X, et al. Long non-coding RNA LINC01003 suppresses the development of multiple myeloma by targeting miR-33a-5p/PIM1 axis. Leuk Res. 2021;106:106565.
- Nian F, Zhu J, Chang H. Long non-coding RNA ANGPTL1-3 promotes multiple myeloma bortezomib resistance by sponging miR-30a-3p to activate c-Maf expression. Biochem Biophys Res Commun. 2019;514(4):1140–1146.
- Khalil NA, Desouky MN, Diab IH, et al. Microrna 30a mediated autophagy and imatinib response in Egyptian chronic myeloid leukemia patients. Indian J Hematol Blood Transfus. 2020;36(3):491–497.
- Yu Y, Yang L, Zhao M, et al. Targeting microRNA-30a-mediated autophagy enhances imatinib activity against human chronic myeloid leukemia cells. Leukemia. 2012;26(8):1752–1760.
- Prieto-Dominguez N, Ordonez R, Fernandez A, et al. Modulation of autophagy by sorafenib: effects on treatment response. Front Pharmacol. 2016;7:151.
- Ludwig H, Miguel JS, Dimopoulos MA, et al. International myeloma working group recommendations for global myeloma care. Leukemia. 2014;28(5):981–992.
- Rajkumar SV, Harousseau JL, Durie B, et al. Consensus recommendations for the uniform reporting of clinical trials: report of the International Myeloma Workshop Consensus Panel 1. Blood. 2011;117(18):4691–4695.
- Heider M, Nickel K, Hogner M, et al. Multiple myeloma: molecular pathogenesis and disease evolution. Oncol Res Treat. 2021;44(12):672–681.
- Podar K, Leleu X. Relapsed/refractory multiple myeloma in 2020/2021 and beyond. Cancers (Basel). 2021;13(20)5154.
- Suzuki K, Nishiwaki K, Yano S. Treatment strategy for multiple myeloma to improve immunological environment and maintain MRD negativity. Cancers (Basel). 2021;13(19):4867.
- Rodriguez-Otero P, Paiva B, San-Miguel JF. Roadmap to cure multiple myeloma. Cancer Treat Rev. 2021;100:102284.
- Liu Z, Han M, Meng N, et al. Lncrna MSTRG.29039.1 promotes proliferation by sponging hsa-miR-12119 via JAK2/STAT3 pathway in multiple myeloma. Oxid Med Cell Longev. 2021;2021:9969449.
- Yang LH, Du P, Liu W, et al. Lncrna ANRIL promotes multiple myeloma progression and bortezomib resistance by EZH2-mediated epigenetically silencing of PTEN. Neoplasma. 2021;68(4):788–797.
- Zhang Y, Zhao D, Li S, et al. Long non-coding RNA TUG1 knockdown hinders the tumorigenesis of multiple myeloma by regulating the microRNA-34a-5p/NOTCH1 signaling pathway. Open Life Sci. 2020;15(1):284–295.
- Zhao P, Zhao X. Baseline lncRNA PCAT1 high expression and its longitude increment during induction therapy predict worse prognosis in multiple myeloma patients. J Clin Lab Anal. 2021;35(11):e23924.
- Ding T, Deng R, Huang T. Long non-coding RNA T cell factor 7 is associated with increased disease risk and poor prognosis, and promotes cell proliferation, attenuates cell apoptosis and miR-200c expression in multiple myeloma. Oncol Lett. 2020;21(2):129.
- Xu M, Gao WW, Luo YJ, et al. Overexpression of miR-30a promotes apoptosis of leukemia K562 cells. Zhongguo Shi Yan Xue Ye Xue Za Zhi. 2019;27(2):396-402.