
 ?Mathematical formulae have been encoded as MathML and are displayed in this HTML version using MathJax in order to improve their display. Uncheck the box to turn MathJax off. This feature requires Javascript. Click on a formula to zoom.
ABSTRACT
Background
Acute myeloid leukemia (AML) is the most common acute blood malignancy in adults. The complicated and dynamic genomic instability (GI) is the most prominent feature of AML. Our study aimed to explore the prognostic value of GI-related genes in AML patients.
Methods
The mRNA data and mutation data were downloaded from the TCGA and GEO databases. Differential expression analyses were completed in limma package. GO and KEGG functional enrichment was conducted using clusterProfiler function of R. Univariate Cox and LASSO Cox regression analyses were performed to screen key genes for Risk score model construction. Nomogram was built with rms package.
Results
We identified 114 DEGs between high TMB patients and low TMB AML patients, which were significantly enriched in 429 GO terms and 13 KEGG pathways. Based on the univariate Cox and LASSO Cox regression analyses, seven optimal genes were finally applied for Risk score model construction, including SELE, LGALS1, ITGAX, TMEM200A, SLC25A21, S100A4 and CRIP1. The Risk score could reliably predict the prognosis of AML patients. Age and Risk score were both independent prognostic indicators for AML, and the Nomogram based on them could also reliably predict the OS of AML patients.
Conclusions
A prognostic signature based on seven GI-related genes and a predictive Nomogram for AML patients are finally successfully constructed.
1. Introduction
Acute myeloid leukemia (AML) is the most common acute blood malignancy in adults [Citation1]. It usually leads to hematopoietic failure characterized by abnormally clonal expansion of myeloid progenitors both in the bone marrow and peripheral blood [Citation2,Citation3]. Recently, increasing pathobiology understanding of AML has been demonstrated, including chromosomal abnormalities, recurrent gene mutations, microRNA deregulations, and so on [Citation4,Citation5]. For instance, several recurrently mutated genes in AML are successfully identified with the help of sequencing techniques, such as FLT3 [Citation6], DNMT3A [Citation7], and IDH1 [Citation8]. Moreover, various cytogenetic abnormalities are associated with benign (e.g. t(8;21)(q22;q22), inv(p13.1;q22), etc. [Citation9]) or undesirable (alterations of chromosomes 5 and 7 [Citation10]) outcome of AML patients. With great therapeutic development, about 35–40% of young AML patients can be cured [Citation10], but the prognosis of the older patients remains undesirable [Citation11]. Accordingly, further genetic exploration is urgently needed to provide more reliable prognostic evaluation and targeted treatment strategies for AML patients.
Genomic instability (GI) generally implies the increasing tendency of accruing genomic alterations, driving heterogeneity of many human diseases [Citation12,Citation13]. It is closely associated with tumor initiation and development, and it is a hallmark of various cancers [Citation14,Citation15]. The complicated dynamic GI is the most prominent feature of AML [Citation16]. Recent evidence indicates the crucial role of GI in the pathogenesis of FLT3 ITD AML, which is correlated with a poor prognosis and high relapse rate in AML patients [Citation17]. Additionally, GI also exerts important role in driving the clonal evolution of myelodysplastic syndromes (MDS) to AML, involving aberrant PIGN expression [Citation18]. All the above evidence indicates the potential association between the GI and AML. The unique somatic mutational profiles are exhibited in various cancers, contributing to a better understanding of the cell specific carcinogenic mechanisms [Citation19,Citation20]. Tumor mutational burden (TMB) is an important factor affecting the GI, which generally refers to the total somatic mutations in a tumor [Citation21]. Higher TMB is reported to correlate with numerically worse overall survival (OS) in many cancers, such as lung cancer and breast cancer [Citation22]. Whereas, to the best of our knowledge, few reports have focused on the possible influence of GI on the prognosis of AML patients.
In the present work, we herein aimed to investigate the prognostic value of GI-related genes in AML patients via analyzing the mutation information and mRNA profile in TCGA and GEO databases, in order to provide more reference information for AML clinical treatment strategies.
2. Materials and methods
2.1. Research objects
The mRNA expression data of 151 AML patients were downloaded from The Cancer Genome Atlas (TCGA) (https://tcga-data.nci.nih.gov/tcga/) database. Among them, 132 patients’ corresponding clinical information was complete ().
Table 1. Clinicopathological characteristics of AML patients from TCGA database.
Then, the mutation data (maf file) of 143 AML patients were also downloaded. The sum of somatic mutations in each sample was calculated in maftools of R language. After analyzing the patients with the top 25% and the bottom 25% TMB value, there were 81 eligible samples, only 62 samples recorded RNA expression data.
In addition, dataset GSE71014 was obtained from the Gene Expression Omnibus (GEO) (https://www.ncbi.nlm.nih.gov/geo/) database, including 104 AML patients with complete survival information. The samples were analyzed in the Illumina HumanHT-12 V4.0 expression bead chip platform.
2.2. Differential expression analyses
All differentially expressed gene (DEG) analyses were conducted in limma package [Citation23] of R language (version 4.1.0, same below). The and P adjust ≤ .05 were taken as a threshold to screen significant DEGs among the 62 AML patients.
2.3. Functional enrichment analyses
The Gene Ontology (including Biological Process (BP), Molecular Function (MF), Cellular Component (CC)) and Kyoto Encyclopedia of Genes and Genomes (KEGG) pathways were analyzed in clusterProfiler function [Citation24] of R. The terms with P adjust ≤ .05 (based on Benjamini and Hochberg (BH)) were significantly enriched ones.
2.4. Cluster analyses
According to ‘K-mean’ method, the 132 AML patients with complete clinical survival information in the TCGA database were clustered based on the 114 DEGs using R language.
2.5. LASSO Cox regression analysis
Based on the expression levels of 114 DEGs, the univariate Cox regression analysis was performed on 132 AML samples. The genes significantly related to the prognosis of AML patients (P < .05) were selected to be further analyzed. Then the LASSO Cox regression analysis was conducted to screen the genes more related to the prognosis of AML patients, using glmnet package of R language [Citation25]. The Risk score of each sample was calculated according to the following formula.
In the formula, Coefi was the risk coefficient of each factor calculated by the LASSO-Cox model, and Xi referred to the expression level of each factor (mRNA expression here). Subsequently, the Risk score value was determined by survival of R, survminer, and two-sided log-rank test. AML patients were divided into two groups, the Low Risk group, and the High Risk group, according to the median value of the Risk score.
2.6. Survival analyses
The OS of various groups was estimated using the Kaplan-Meier method, utilizing the survival and survminer package of R. We used the log-rank test to determine the significance of the difference. The independent prognostic factors for AML patients were determined by the Multivariate Cox regression model.
2.7. Nomogram model construction
Nomogram is widely used to predict the survival of various cancers. Therefore, to predict the OS of AML patients at one, three, and five years, the Nomogram was built based on all independent prognostic factors using the R language rms package (https://CRAN.R-project.org/package=rms). The prognostic predictive performance of the Nomogram could be evaluated through calibration curve drawing. For each AML sample, three lines were drawn upwards to determine the Points based on the Nomogram, and these Points were located on the ‘Total Points axis. Then, a line was drawn downwards from the Total Points axis to determine the survival probability of AML patients in one, three, and five years.
3. Results
3.1. The differentially expressed genes between high and low TMB AML patients
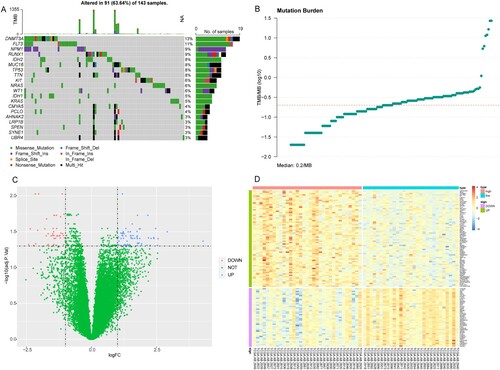
Firstly, we have analyzed the mutation information (maf file) of the 143 AML patients utilizing maftools package. The results suggested that DNMT3A, FLT3, and NPM1 showed the highest mutation rates ((A)). After analyzing the patients with the top 25% (0.10) and the bottom 25% (0.32) TMB value, there were 81 eligible samples, which were divided into two groups, high and low TMB groups ((B)). Among these 81 patients, only 62 AML patients had mRNA expression profiles. The differential expression analyses were conducted on their mRNA data. Compared with low TMB AML patients, a total of 114 DEGs were identified in the high TMB group, including 71 upregulated DEGs and 43 downgulated DEGs ((C)). The expression levels of these DEGs between high and low TMB groups were significantly different ((D)).
Figure 1. The results of mutation status and differential expression analyses in AML patients in TCGA database. (A) The top 20 genes with the highest mutation rates in AML patients. (B) TMB distribution value. X-axis: TMB value; Y-axis: log10(TMB). (C) Volcano plot of DEGs. X-axis: Log2FC; Y-axis: −log10(P adjust); blue: upregulated genes; red: downregulated genes. (D): Heat map of DEGs. X-axis: samples; Y-axis: various genes; red: highly expressed genes; blue: lowly expressed genes; green: upregulated genes; purple: downregulated genes.
3.2. Results of functional enrichment analyses
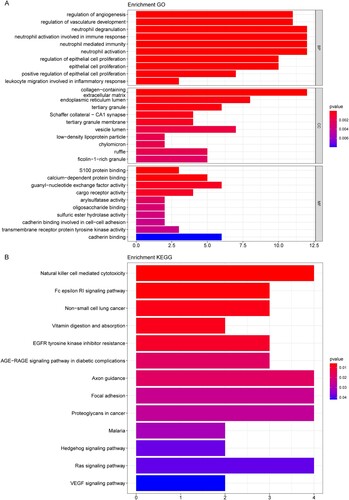
Enrichment analyses were performed to get more functional information about the 114 DEGs. Our data suggested that the 114 DEGs were significantly enriched in 429 GO terms (such as neutrophil degranulation, collagen-containing extracellular matrix, and guanyl-nucleotide exchange factor activity) and 13 KEGG pathways (such as Natural killer cell mediated cytotoxicity). The top 10 significant BP, CC, MF GO terms and all 13 KEGG pathways were shown in (A,B), respectively. Detailed enrichment results were summarized in Tables S1 and S2, separately.
Figure 2. Functional enrichment results. (A) The top 20 most significantly enriched GO terms. (B) The top 20 significantly enriched KEGG pathways. X-axis: the number of genes enriched; Y-axis: the names of the terms.
3.3. The AML patients with different prognoses could be separated based on the DEGs
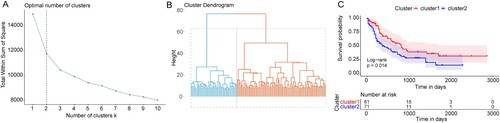
According to the ‘K-mean’ method, 132 AML patients with complete survival information were subjected to the cluster analyses based on the above 114 DEGs. On the basis of the SSE (sum of the squared errors), the results indicated optimal cluster number k = 2 ((A)), and all samples were clustered in two clusters ((B)). Then, the survival analysis revealed that there was a significant OS difference between these two clusters ((C)). Our findings indicated that the AML patients with different OS could be separated based on the DEGs obtained from distinct TMB status.
Figure 3. The AML patients cluster results based on the DEGs. (A) The ‘elbow diagram’ to determine the optimal number of clusters. X-axis: the number of clusters K; Y-axis: the sum of the squared errors (SSE). The optimal number k = 2. (B) The AML samples clustering. (C) Kaplan-Meier survival curve. X-axis: time; Y-axis: survival probability. P was determined by log-rank test.
3.4. Prognostic model construction and verification
In the 132 AML patients in TCGA database, the expression levels of the 114 DEGs were taken as the continuous variable of the univariate Cox regression analysis, and the Hazard ratio (HR) of each gene was calculated. The top 20 DEGs (P < .05) with the highest significance were displayed in (A).
Figure 4. Construction of the prognostic model for AML. (A) The top 20 genes most significantly related to the prognosis of AML. HR: Hazard ratio; 95% CI: 95% confidence interval. (B) The optimal lambda value in LASSO Cox regression analysis. X-axis: log (lambda); Y-axis: partial likelihood Deviance. (C and D) Survival curves of AML patients in TCGA and GEO databases. X-axis: time; Y-axis: survival probability. P was determined by log-rank test.
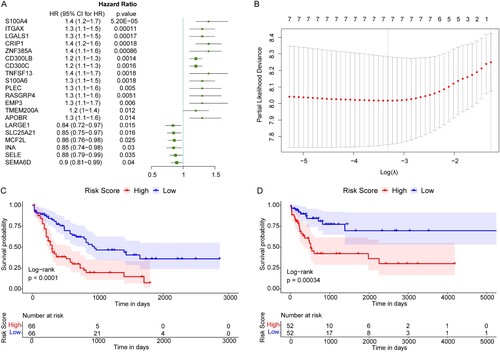
Then these 20 DEGs were subjected to the LASSO Cox regression analysis in the training set. According to the corresponding lambda value of the gene number, the optimal gene number was 7 ((B), lowest lambda value), including SELE, LGALS1, ITGAX, TMEM200A, SLC25A21, S100A4, and CRIP1. We then validated the expression levels of these seven genes in the Cancer Cell Line Encyclopedia (CCLE) database (https://sites.broadinstitute.org/ccle). We found that SLC25A21, ITGAX, LGALS1, and TMEM200A exhibited significantly differential expression levels between AML cell lines and normal cell lines (Figure S1(A–D)), whereas the rest of three genes had no significant difference (Figure S1(E–G)).
Subsequently, the expression levels of these seven genes were weighted with the regression coefficient of LASSO Cox regression analysis. The Risk score model was constructed as below: Risk score = [(−0.04612562) × SELE expression value] + [0.06862245 × LGALS1 expression value] + [0.05494352 × ITGAX expression value] + [0.20978102 × TMEM200A expression value] + [(−0.07618051) × SLC25A21 expression value] + [0.14862263 × S100A4 expression value] + [0.03722238 × CRIP1 expression value]. The Risk score of each patient in the TCGA database and GEO validation set was calculated, and all samples were divided into high and low risk groups according to the median of the Risk score. After survival analyses, we found that high risk AML patients had poorer OS compared with the low risk patients, in both the TCGA database and GEO validation set ((C,D)).
3.5. Risk score was an independent prognostic marker of AML
The multivariate Cox regression analysis, including age, sex, race, Fab type, Neoadjuvant_treatment, FLT3_mutation, and Risk score, was then performed to determine the independent prognostic factors ((A)). Our results indicated that Risk score, age, race, Fab type, and FLT3_mutation were still significantly correlated with OS of AML patients. The AML patients with a higher risk score had a higher risk for death (HR = 3.85, 95% CI: 2.30–6.4, P < .001), and it was an undesirable prognostic factor.
Figure 5. The Risk score was an independent prognostic marker of AML. (A) Multivariate Cox regression analysis results. Compared with reference samples, patients with HR >1 had a higher risk of death. (B and C) Survival curves of female and male AML patients. (D and E) Survival curves of AML patients of ≤55 years old and >55 years old. X-axis: time; Y-axis: survival probability. P was determined by log-rank test.
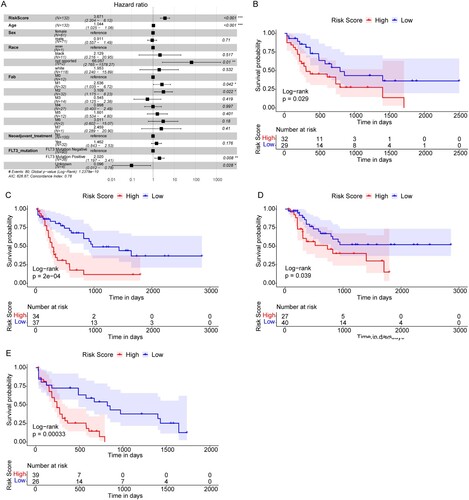
To further explore the prognostic value of risk scores in AML patients of different ages and sexes, we regrouped the AML patients based on ages and sexes and conducted Kaplan-Meier survival analyses. We found that the OS of AML patients with high risk scores was all significantly lower than that of patients with low risk scores in females ((B)), males ((C)), age ≤55 years ((D)), and age >55 years ((E)). The above findings indicated that Risk Score was an independent prognostic indicator for AML patients, and would not be affected by patient ages or sexes.
3.6. Nomogram model could reliably predict the survival probability of AML patients
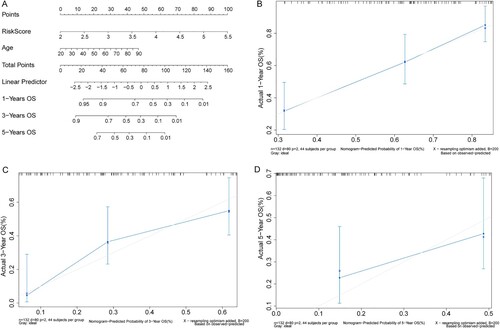
The Nomogram model was then constructed based on the age and Risk score ((A)). Three lines were drawn upwards to determine the Points for each patient obtained from the Nomogram. The sum of the Points was located on the ‘Total Points axis, and a line was drawn downwards from the ‘Total Points axis to determine the survival probability of the AML patients in one, three, and five years. The calibration curves (in one and three years) matched the ideal curve (45-degree line with a slope of 1 passing through the origin) well ((B–D)), indicating that the Nomogram’s predictive outcome was close to the practical situation.
Figure 6. Nomogram could predict the OS of AML patients. (A) Nomogram model. (B–D) The calibration curves of Nomogram predicting the OS of AML patients in one, three, and five years. X-axis: predicted probability; Y-axis: actual probability.
4. Discussion
In various cancers, the prognostic significance of GI is derived from mutations driving carcinogenesis, tumor development, and treatment resistance [Citation13,Citation26]. Accordingly, in this study, we mainly explored the prognostic value of GI-related genes in AML patients, utilizing bioinformatic tools to analyze the public AML data. A prognostic signature based on seven GI-related genes and the Nomogram for AML patients we constructed both exhibited good predictive performance.
To identify the DEGs among AML patients with differential GI status, the AML patients were divided into high and low TMB groups based on somatic mutation information in the TCGA database. A total of 114 DEGs were identified in the high TMB group compared with the low TMB group, which probably contributed to the GI in AML patients. DNMT3A and FLT3 showed the highest mutation rates, which were widely documented in previous studies, suggesting their associations with the poor outcome in AML patients [Citation27,Citation28]. The AML patients could be clustered into 2 clusters with significantly differential OS based on these 114 DEGs, further indicating that these DEGs were related to the outcome of AML patients. Furthermore, after conducting univariate Cox and LASSO Cox regression analysis, seven optimal genes were applied for Risk score model construction, including SELE, LGALS1, ITGAX, TMEM200A, SLC25A21, S100A4, and CRIP1. In both the TCGA training set and GEO validation set, high risk score AML patients all had poorer OS compared with the low risk patients. Moreover, the multivariate Cox regression analysis implied that Risk score was an independent prognostic factor for AML patients. Considering the important influence of age in AML patients [Citation29], the Nomogram based on age and risk score was built, and it could also reliably predict the OS of AML patients.
For the 114 DEGs identified, GO and KEGG enrichment analyses revealed more functional information related to AML patients with differential TMB. The 114 DEGs were significantly enriched in 429 GO terms and 13 KEGG pathways. Of note, some of the pathways have been revealed to involve AML in different ways. For instance, Natural killer (NK) cell mediated cytotoxicity pathway, a recent study showed that there was probably a positive correlation between NK cytotoxicity and OS of 5-azacytidine-treated AML patients [Citation30]. The roles of NK cell functions are increasingly studied regarding novel immunotherapy for AML patients [Citation31]. Besides, another prognostic research in AML revealed that the mRNAs in lncRNA-mRNA networks identified might regulate prognosis partly via the Fc epsilon RI signaling pathway [Citation32]. The combined inhibition of focal adhesion kinase was reported to partly enhance the antileukemia activity in AML patients [Citation33], which might be indirectly correlated with the Focal adhesion pathway. Ras signaling pathway has been suggested to contribute to various cancers’ predisposition, including AML, and somatic Ras pathway alterations have been observed in many pediatric malignancies [Citation34]. Hedgehog signaling pathway inhibition was evidenced to be a therapeutic target in AML patients recently [Citation35]. In short, the DEGs might indirectly or partly affect the prognosis of AML patients with differential TMB through multiple pathways involving immune, predisposition, and progression.
Abnormalities of several genes, such as PIGN [Citation18] and FLT3 [Citation17], have been revealed to be correlated with the GI in AML patients, via affecting chromosomal stability, acquired resistance, and various other ways. Among these seven crucial GI-related genes in the predictive signature, some genes have been reported singly in AML. SELE has been evidenced to involve in mediating AML chemo-resistance directly [Citation36,Citation37]. The role of LGALS1 in AML was probably related to the blast cell migration from the microenvironment to the peripheral blood [Citation38], whereas its specific mechanism still needs more exploration. Moreover, as the nuclear S100A4 overexpression was prevalent in AML samples while S100A4’s knockdown impacted the survival of AML cell lines, S100A4 has been demonstrated recently to be a promising target in AML [Citation39]. CRIP1 is associated with unfavorable prognosis and might be a potentially independent biomarker in AML patients [Citation40,Citation41]. Although accumulating studies revealed the different genes’ roles in AML, few reports of ITGAX, TMEM200A, and SLC25A21 were found. Together, the prognostic predictive performance of GI-related signatures in AML patients is satisfying, besides, our present results mined more potential genes associated with AML patients prognosis.
5. Conclusions
In conclusion, we have identified a prognostic predictive signature comprising seven GI-related genes (including SELE, LGALS1, ITGAX, TMEM200A, SLC25A21, S100A4, and CRIP1) in AML patients. The Risk score and the subsequent Nomogram both imply the reliability of the predictive performance. Our findings provide more candidate genes relating to AML patients’ prognosis.
Supplemental Material
Download Zip (68 KB)Disclosure statement
No potential conflict of interest was reported by the author(s).
Data availability statement
Our data and related clinical information were retrieved from The Cancer Genome Atlas (TCGA, https://tcga-data.nci.nih.gov/tcga/) and the Gene Expression Omnibus (GEO, https://www.ncbi.nlm.nih.gov/geo/, accession number: GSE71014).
Additional information
Funding
Related Research Data
References
- Roloff GW, Griffiths EA. When to obtain genomic data in acute myeloid leukemia (AML) and which mutations matter. Hematology Am Soc Hematol Educ Program. 2018;2018(1):35–44.
- Medinger M, Lengerke C, Passweg J. Novel prognostic and therapeutic mutations in acute myeloid leukemia. Cancer Genomics Proteomics. 2016;13(5):317–329.
- Lagunas-Rangel FA, Chavez-Valencia V, Gomez-Guijosa MA, et al. Acute myeloid leukemia-genetic alterations and their clinical prognosis. Int J Hematol Oncol Stem Cell Res. 2017;11(4):328–339.
- Dohner H, Estey E, Grimwade D, et al. Diagnosis and management of AML in adults: 2017 ELN recommendations from an international expert panel. Blood. 2017;129(4):424–447.
- Chen J, Odenike O, Rowley JD. Leukaemogenesis: more than mutant genes. Nat Rev Cancer. 2010;10(1):23–36.
- Ambinder AJ, Levis M. Potential targeting of FLT3 acute myeloid leukemia. Haematologica. 2021;106(3):671–681.
- Ley TJ, Ding L, Walter MJ, et al. DNMT3A mutations in acute myeloid leukemia. N Engl J Med. 2010;363(25):2424–2433.
- Roboz GJ, DiNardo CD, Stein EM, et al. Ivosidenib induces deep durable remissions in patients with newly diagnosed IDH1-mutant acute myeloid leukemia. Blood. 2020;135(7):463–471.
- Marcucci G, Haferlach T, Dohner H. Molecular genetics of adult acute myeloid leukemia: prognostic and therapeutic implications. J Clin Oncol. 2011;29(5):475–486.
- Dohner H, Weisdorf DJ, Bloomfield CD. Acute myeloid leukemia. N Engl J Med. 2015;373(12):1136–1152.
- Dombret H, Seymour JF, Butrym A, et al. International phase 3 study of azacitidine vs conventional care regimens in older patients with newly diagnosed AML with >30% blasts. Blood. 2015;126(3):291–299.
- Duijf PHG, Nanayakkara D, Nones K, et al. Mechanisms of genomic instability in breast cancer. Trends Mol Med. 2019;25(7):595–611.
- Andor N, Maley CC, Ji HP. Genomic instability in cancer: teetering on the limit of tolerance. Cancer Res. 2017;77(9):2179–2185.
- Hanahan D, Weinberg RA. Hallmarks of cancer: the next generation. Cell. 2011;144(5):646–674.
- Negrini S, Gorgoulis VG, Halazonetis TD. Genomic instability – an evolving hallmark of cancer. Nat Rev Mol Cell Biol. 2010;11(3):220–228.
- Panuzzo C, Signorino E, Calabrese C, et al. Landscape of tumor suppressor mutations in acute myeloid leukemia. J Clin Med. 2020;9(3).
- Rebechi MT, Pratz KW. Genomic instability is a principle pathologic feature of FLT3 ITD kinase activity in acute myeloid leukemia leading to clonal evolution and disease progression. Leuk Lymphoma. 2017;58(9):1–11.
- Teye EK, Sido A, Xin P, et al. PIGN gene expression aberration is associated with genomic instability and leukemic progression in acute myeloid leukemia with myelodysplastic features. Oncotarget. 2017;8(18):29887–29905.
- Lee JK, Choi YL, Kwon M, et al. Mechanisms and consequences of cancer genome instability: lessons from genome sequencing studies. Annu Rev Pathol. 2016;11:283–312.
- Anandakrishnan R, Varghese RT, Kinney NA, et al. Estimating the number of genetic mutations (hits) required for carcinogenesis based on the distribution of somatic mutations. PLoS Comput Biol. 2019;15(3):e1006881.
- Fancello L, Gandini S, Pelicci PG, et al. Tumor mutational burden quantification from targeted gene panels: major advancements and challenges. J Immunother Cancer. 2019;7(1):183.
- Valero C, Lee M, Hoen D, et al. The association between tumor mutational burden and prognosis is dependent on treatment context. Nat Genet. 2021;53(1):11–15.
- Ritchie ME, Phipson B, Wu D, et al. . limma powers differential expression analyses for RNA-sequencing and microarray studies. Nucleic Acids Res. 2015;43(7):e47.
- Yu G, Wang LG, Han Y, et al. Clusterprofiler: an R package for comparing biological themes among gene clusters. OMICS. 2012;16(5):284–287.
- Friedman J, Hastie T, Tibshirani R. Regularization paths for generalized linear models via coordinate descent. J Stat Softw. 2010;33(1):1–22.
- Mettu RK, Wan YW, Habermann JK, et al. A 12-gene genomic instability signature predicts clinical outcomes in multiple cancer types. Int J Biol Markers. 2010;25(4):219–228.
- Park DJ, Kwon A, Cho BS, et al. Characteristics of DNMT3A mutations in acute myeloid leukemia. Blood Res. 2020;55(1):17–26.
- Burchert A. Maintenance therapy for FLT3-ITD-mutated acute myeloid leukemia. Haematologica. 2021;106(3):664–670.
- Appelbaum FR, Gundacker H, Head DR, et al. Age and acute myeloid leukemia. Blood. 2006;107(9):3481–3485.
- Tsirogianni M, Grigoriou E, Kapsimalli V, et al. Natural killer cell cytotoxicity is a predictor of outcome for patients with high risk myelodysplastic syndrome and oligoblastic acute myeloid leukemia treated with azacytidine. Leuk Lymphoma. 2019;60(10):2457–2463.
- Romee R, Rosario M, Berrien-Elliott MM, et al. Cytokine-induced memory-like natural killer cells exhibit enhanced responses against myeloid leukemia. Sci Transl Med. 2016;8(357):357ra123.
- Zeng H, Wu H, Yan M, et al. Characterization of a 4 lncRNAs-based prognostic risk scoring system in adults with acute myeloid leukemia. Leuk Res. 2020;88:106261.
- Wang X, Mak PY, Mu H, et al. Combinatorial inhibition of focal adhesion kinase and BCL-2 enhances antileukemia activity of venetoclax in acute myeloid leukemia. Mol Cancer Ther. 2020;19(8):1636–1648.
- Ney GM, McKay L, Koschmann C, et al. The emerging role of Ras pathway signaling in pediatric cancer. Cancer Res. 2020;80(23):5155–5163.
- Shallis RM, Bewersdorf JP, Boddu PC, et al. Hedgehog pathway inhibition as a therapeutic target in acute myeloid leukemia. Expert Rev Anticancer Ther. 2019;19(8):717–729.
- Erbani J, Tay J, Barbier V, et al. Acute myeloid leukemia chemo-resistance is mediated by E-selectin receptor CD162 in bone marrow niches. Front Cell Dev Biol. 2020;8:668.
- Barbier V, Erbani J, Fiveash C, et al. Endothelial E-selectin inhibition improves acute myeloid leukaemia therapy by disrupting vascular niche-mediated chemoresistance. Nat Commun. 2020;11(1):2042.
- Ruvolo PP, Ma H, Ruvolo VR, et al. LGALS1 acts as a pro-survival molecule in AML. Biochim Biophys Acta Mol Cell Res. 2020;1867(10):118785.
- Alanazi B, Munje CR, Rastogi N, et al. Integrated nuclear proteomics and transcriptomics identifies S100A4 as a therapeutic target in acute myeloid leukemia. Leukemia. 2020;34(2):427–440.
- Ma BB, Zhang TJ, Wang CZ, et al. Methylation-independent CRIP1 expression is a potential biomarker affecting prognosis in cytogenetically normal acute myeloid leukemia. Am J Transl Res. 2020;12(9):4840–4852.
- Ye C, Ma S, Xia B, et al. Weighted gene coexpression network analysis identifies cysteine-rich intestinal protein 1 (CRIP1) as a prognostic gene associated with relapse in patients with acute myeloid leukemia. Med Sci Monit. 2019;25:7396–7406.