
ABSTRACT
Objectives
To determine the trends in anemia prevalence, treatment rates, and their associated demographic and socioeconomic status factors in the U.S. nationally representative population.
Methods
We extracted data from individuals ≥20-year-old from the NHANES from 2005 to 2018. The trends of anemia prevalence and treatment were assessed by Cochran–Armitage test. The association between two dependent variables (anemia status and treatment) and demographic were examined by multiple logistic regression.
Results
The general anemia prevalence has a significant increasing trend from 5.71% to 6.86% (P trend<.001) from 2005 to 2018, whereas the trend in general anemia treatment rate was not significant (p = .148). Logistic regression showed that age groups (OR: 2.15for 60 or older vs. 20–39 years old), sex (0.47 for male vs. female), race (0.22 for NHW vs. NHB), education (0.80for some college or AA degree vs. less than high school), PIR (0.60 for ≥3.5 vs.≤1.3), and birthplace (0.88 for U.S. vs. other) were significantly associated with anemia. The factors significantly associated with anemia treatment were age group (1.51 for 60 years and older vs. 20–39 years old), sex (0.53 male vs. female), birthplace (1.88 U.S. vs. other), and insurance (1.80 for Yes vs. No).
Conclusion
While there was no significant increase in anemia treatment between 2005 and 2018, the anemia prevalence increased significantly, particularly among individuals with lower income, less education, and born outside the U.S. Moreover, the high anemia prevalence among NHB compared to other races indicated that more resources are needed to reduce disparities.
Introduction
Anemia is associated with poor health outcomes, and the reduced oxygen-carrying capacity of anemia may lead to serious health problems and affect morbidity and mortality [Citation1,Citation2]. In 2016, there were over 1.2 billion cases of iron deficiency anemia worldwide [Citation3] and disproportionally affected about 42% of children less than 5 years of age and 40% of pregnant women worldwide [Citation4]. In older adults, anemia is associated with dynapenia [Citation5], frailty, polypharmacy, poor nutritional status, and falls [Citation6]. Anemia affects one-third of heart failure patients and was associated with worse symptoms, greater impairment in functional capacity, and higher mortality [Citation7]. Anemia in pregnancy may increase the risk of major hemorrhage and is considered a risk factor of maternal death [Citation8,Citation9,Citation10]. Anemia is a common complication in chronic kidney disease (CKD), and is associated with worse renal survival, a reduced quality of life, and an increase in mortality [Citation11].
With the adverse impact of anemia on physical and psychosocial function and quality of life, treatment and management of anemia often requires individualized approaches and should be evidence-based [Citation12]. Based on the causes, anemia treatment involves taking iron supplements and changing diet (iron deficiency anemia), dietary supplements (Vitamin deficiency anemia), blood transfusions (aplastic anemia), and treatment of underlying diseases [Citation13]. Guidelines and protocols of anemia treatment have been developed based on certain conditions such as cancer [Citation14], inflammatory bowel diseases [Citation15], surgery [Citation16], chronic kidney disease [Citation17], and pregnancy [Citation18].
Several studies have reported anemia’s prevalence and treatment rates in the U.S. A study using NHANES data from 2003 to 2012 reported an average of 5.6% of anemia prevalence in the U.S. population, and the anemia prevalence had an increasing trend [Citation19]. Anemia prevalence in females was twice as in males (7.6% vs. 3.5%). There was also a disparity in the anemia prevalence among different race groups, for example, African Americans is reported to be three times more likely to have anemia than Whites [Citation20]. The prevalence of anemia in people with CKD was 15.4%, which is about twice as in the general population in 2007–2010 [Citation21]. The anemia prevalence increased with the stage of CKD, from 8.4% at stage 1 CKD to 53.4% at the stage 5. The prevalence of iron deficiency anemia (IDA) was also significantly higher in blood donors compared to nondonors for both adolescents and adults (9.5 vs. 6.1% among adolescents; 7.9% vs. 6.1% among adults) [Citation22]. In a U.S. veteran population from 2011 to 2018, the incidence rate of anemia in the inflammatory bowel disease (IBD) was significantly higher than non-IBD group (92.75 vs.51.18 per 1000 person), and only 39.8% of patients received treatment during follow-up [Citation23]. Generally, the estimated anemia treatment rates were 38.4% among females and 27.5% among males [Citation24].
Although anemia remains a global health issue, the most updated general prevalence and prevalence in the U.S. population within subgroups were not available. Additionally, there is a lack of studies in the literature for assessing the anemia treatment rates. Due to the lack of relevant studies on trends of anemia and treatment rates, the negative impact of anemia and the low treatment rates might be ignored by policymakers when targeting public health problems. Therefore, accessing the anemia and treatment rates, particularly in the groups of lower socioeconomic status, is critical for reducing the severity of public health problems [Citation25]. Anemia remains a relevant health problem, and a comprehensive understanding of its impact on the U.S. populations requires updates of the current knowledge about the anemia epidemiology. In this study, we aim to: (1) evaluate the trends of prevalence of anemia in the past 14 years in the U.S. general population and various demographic subgroups; (2) evaluate the anemia treatment rates and their trends in U.S. general population and various demographic subgroups (3) examine the association between demographic factors and outcomes anemia status and treatment. To achieve our goal, we used data from the National Health and Nutrition Examination Survey (NHANES) between 2005 and 2018.
Materials and methods
Sample
NHANES is an ongoing national cross-sectional survey to assess the national health and nutrition status of non-institutional U.S. children and adults. The survey employed a stratified multi-stage probability cluster sampling method to ensure adequate representation of the U.S. population [Citation26]. In the recent years, the response rate of NHANES has gradually decreased from 66% in cycle 2011–2012 to 47.7% in cycle 2017–2018. The potential nonresponse-caused collection bias was minimized by CDC through enhanced weighting adjustment [Citation27]. Some subgroups were oversampled to increase precision for subgroup estimates [Citation28]. To examine the trends of anemia prevalence and treatment, we extracted data of adults older than 20 years old from seven NHANES survey cycles from 2005 to 2018. The NHANES data after 2018 were not publicly available yet due to the delayed field operations in March 2020 during the COVID-19 pandemic. Subjects were excluded from analysis if they had missing values in extracted or no response to questions. Women who were pregnant were also excluded from the study. A total of 3799 subjects were excluded based on the criteria above. The sample characteristics do not differ significantly between samples with and without exclusion by Chi-square tests. To achieve the best estimates of anemia prevalence and treatment rates, we used an inclusive sample of all respondents who met the inclusion criteria. Hence, no formal sample size calculation was performed.
Dependent variables
Anemia is defined by the sex-specific cut-offs of serum hemoglobin 13 g/dl for males and 12 g/dl for females as recommended by the World Health Organization (WHO) [Citation29]. The hemoglobin was measured by Beckman Coulter DxH-800 Analyzer based on the photometric measurement method at Mobile Examination Center. Anemia treatment is defined as answering the question, ‘During the past three months, have you been on treatment for anemia, sometimes called “tired blood” or “low blood?” (Include diet, iron pills, iron shots, transfusions as treatment)’.
Independent variables
Demographic variables were extracted from each NHANES cycle, such as age group (20–39, 40–59, 60+), sex (male, female), race (Non-Hispanic Black or NHB, Hispanic or HSP, Non-Hispanic White or NHW, and other races), education level (less than high school, high school graduate, some college or AA degree, college graduate or above), insurance coverage (yes, no), birthplace (the U.S., other), poverty income ratio (PIR ≤1.3, 1.3–3.5, ≥3.5), an index calculated by dividing family income by a poverty threshold [Citation30]. The PIR 1.3 cutoff is used to determine the financial eligibility for Supplemental Nutrition Program, and 3.5 is usually the cutoff to determine the highest and medium income [Citation30,Citation31].
Analysis
Subjects’ characteristics were analyzed by SAS Proc SurveyFreq and reported as frequency, weighted proportion, and standard error. Chi-square tests and associated P values were used to test the hypothesis that all subgroups have equal proportions, for example, males and females account for 50% respectively of the sample. Anemia prevalence and treatment rates were examined in subgroups of various demographic variables, and trend analysis was conducted using the Cochran–Armitage trend test [Citation32]. A P value of trends less than 0.05 is considered statistically significant (alpha = .05), indicating there is a significant increasing or decreasing trend in the prevalence or treatment rates from 2005 to 2018. To assess the association between the outcomes (anemia status and treatment) and independent variables, we conducted multiple logistic regression models and reported both unadjusted and adjusted odds ratio, 95% confidence interval (95% CI), and P values for type 3 analysis of effects [Citation33]. Since NHANES is a complex multi-stage sampling design, we account for the design by using sampling strata, cluster, and weight variables in the analysis as suggested by NHANES. All statistical analyses were conducted in statistical software SAS 9.4 (Cary, NC). To assess how missing values affect results in this study, we also conducted imputation for missing values and refit logistic regression models. The odds ratios and 95% CI of models with imputation were very close to those using data without imputation. Therefore, we only presented the results using the complete case of samples.
Results
We extracted a total of 32,372 participants from seven cycles of data from NHANES including sample sizes of 4205 for year 2005–2006, 4790 for year 2007–2008, 5088 for year 2009–2010, 4523 for year 2011–2012, 4879 for year 2013–2014, 4579 for year 2015–2016 and 4308 for year 2017–2018. shows the sample characteristics between the years 2005–2018 (a total of seven survey cycles). The numbers of participants in the analytic sample were not statistically different by each cycle (p = .778) and samples characteristics did not differ significantly by independent variables (data not shown). The participants were mostly under 60 years old, had college or college graduate education levels, had health insurance coverage, and had a poverty income ratio larger than 3.5. The majority of respondents in the sample were Non-Hispanic White (NHW) and born in the U.S. ().
Table 1. Sample characteristics of seven survey cycles data extracted from NHANES between 2005 and 2018.
shows the general anemia prevalence and anemia treatment rates from 2005 to 2018. In general, the prevalence of anemia was between 5.71 and 7.85%, with a statistically significant increasing trend (p < .001), though the prevalence dropped slightly after its peak in 2011–2012. The anemia treatment rates among participants with anemia had no significant trend (p = .148), and the treatment rates were between 13.62% and 22.25%. However, between 2011 and 2016, the treatment rates were lower than the rest of the years.
Table 2. The general anemia prevalence and treatment rates across seven survey cycles.
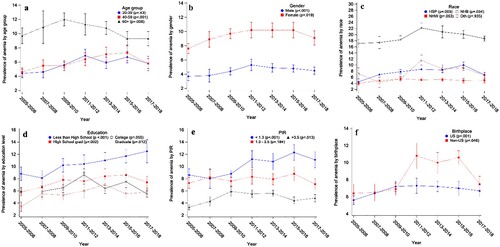
To evaluate the trend in a specific demographic subgroup, we plotted anemia prevalence and treatment rates across seven survey cycles by subgroups such as age groups, sex, etc. (A) shows that the anemia prevalence had significant increasing trends among 40–59 years old (p < .001) but a decreasing trend among 60 + years old participants (p = .008). However, the average prevalence in 60 + years old was much higher than those under 60 years old across all years. Both female and male participants had increasing trends in anemia, while the prevalence of females was about twice compared to male participants ((B)). Among all race groups, the NHB prevalence was significantly higher than any other race group and had a significant increasing trend (p = .034) though its prevalence had kept dropping since 2011–2012 ((C)). Participants with the lowest education level and lowest PIR had the highest anemia prevalence ((D,E)), and the increasing trends were statistically significant (p < .001). Lastly, respondents born outside the U.S. had a significantly higher anemia prevalence than those born in the U.S. after 2011 ((F)).
Figure 1. The anemia weighted prevalence from 2005 to 2018 by subgroups: (a) age group, (b) sex, (c) race, (4) education, (5) poverty income ratio, (f) birthplace. The error bars represent the standard errors obtained by Taylor series linearization.
Multiple logistic regression models also show that factors such as age group, sex, race, education, insurance coverage, and PIR were significantly associated with anemia (). Specifically, people with anemia were more likely to be 60 years old or older, with an odds ratio of 2.15 (95% CI: [1.90, 2.43]) between 60 years old or older and 20–39 years old. There was a significant difference in the odds of having anemia between males and females (OR = 0.47, 95% CI [0.42, 0.53]). Among all races, NHW had the lowest odds ratio relative to NHB (OR = 0.22, 95% CI [0.19, 2.43]). People having some college or AA degree were significantly less likely to have anemia compared to those whose education level was less than high school (OR = 0.80, 95% CI [0.69, 0.93]). People with insurance coverage were significantly more likely to have anemia when compared to those without insurance (OR = 1.40, 95% CI [1.26, 1.57]). Lastly, there was a significant difference in the odds of having anemia between PIR ≥3.5 and PIR ≤1.3 (OR = 0.60, 95% CI [0.53, 0.69]).
Table 3. Multiple logistic regression models for anemia status as the dependent variable.
Consistent with the total anemia treatment (), there was no significant trend in anemia treatment rates when examined by subgroups of age, birthplace, and insurance except for female participants (p = .035, (B)). Multiple logistic regression models show that age group, sex, birthplace, and insurance were significantly associated with anemia self-reported treatment (). Among respondents who had anemia based on the sex-specific cut-offs, respondents were significantly higher odds to receive anemia treatment among those who were 40 years and above (OR = 1.51, 95% CI [1.10,2.09] between 60 + years old and 20–39 years old), female (OR = 0.53, 95% CI [0.38, 0.72] between male and female), covered by insurance (OR = 1.80, 95% CI [1.24, 2.61] between ‘with insurance’ and ‘without insurance’), and born in the U.S. (OR = 1.88, 95% CI [1.22,2.89] between U.S. and other) ().
Figure 2. The anemia treatment rates from 2005 to 2018 by subgroups: (a) age group, (b) sex, (c) birthplace, (d) insurance. The error bars represent the standard errors obtained by Taylor series linearization.
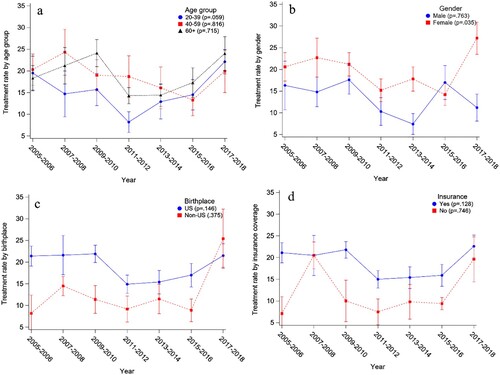
Table 4. Multiple logistic regression models for anemia treatment as the dependent variable.
Discussion
Key findings
We found that anemia prevalence in the U.S. had a significant increasing trend between 2005 and 2018. We also found significant disparities of anemia prevalence among groups by age, sex, race, poverty income ratio, and birthplace. There was no significant increasing or decreasing trend in anemia treatment. However, age, sex, birthplace, and insurance coverage were significant factors associated with anemia treatment. These findings highlight the need for further research into the causes of anemia prevalence and treatment disparities and low-cost interventions to reduce the anemia prevalence among high-risk groups for anemia.
This study examined the anemia prevalence and trends by various demographic subgroups. Based on the prevalence range, The WHO categorized anemia public health significance into four groups: normal (≤4.9%), mild (5.0–19.9%), moderate (20.0–39.9%), and severe (≥40%) [Citation34]. Generally, the anemia prevalence had been increased from 2005 to 2018, and the general U.S. population was classified as having mild public health problems. However, the anemia prevalence trends displayed different patterns in the subgroups. For example, in the age group 20–39, there was no significant trend in anemia prevalence. However, the 40–59 group showed a significant increasing trend. In contrast, the 60+ years old group showed a significantly decreasing anemia prevalence, though the 60+ group had a significantly higher prevalence than the other two age groups across all cycles ((A)). The study by Seitz et al. showed that anemia prevalence of both men and women between 65 and 74 years old had a decreasing trend after 2009 [Citation35], which is consistent with our results. These findings provided an most updated snapshot of anemia prevalence and treatment rate in the U.S. general population and subgroups divided by sex, age, race, education, and insurance coverage, birthplace, and poverty income ratio across 14 years. Insights from this study can also provide information for healthcare providers and policymakers on how to allocate resources to reduce anemia’s negative impact on society.
Compare and contrast to previous studies
Anemia prevalence in women was significantly higher than that in men. Although both had a significant increasing trend, anemia prevalence in men slightly decreased since 2011 while the prevalence in women dropped in 2017–2018. This pattern was also consistent with the findings from another study by Sun and Weaver [Citation24]. Based on our results, Non-Hispanic Blacks were the most vulnerable to anemia, and the severity of health problems was categorized as ‘moderate’ in 2011–2012 based on WTO criteria. The high prevalence of anemia in NHB compared with other races had been reported by several studies [Citation19,Citation36,Citation37]. Although racial disparities in anemia prevalence might be associated with common risk factors such as chronic diseases and socioeconomic factors, the race difference is not explained well by factors studied [Citation20]. The racial disparities in the hemoglobin concentration remained after adjusting for sickle cell trait, iron deficiency and α-thalassemias [Citation38]. It is also suggested that genetic mutations selected by pressure from malaria may partially account for such striking racial disparity in anemia prevalence [Citation39]. We found in this study that NHB anemia prevalence is dropping after the 2011–2012 cycle, which might need further efforts of society to keep the decreasing trend to reduce the anemia prevalence gaps between blacks and other races. The anemia prevalence showed a significant increasing trend in participants with the lowest education level (less than high school) and family income (PIR ≤ 1.3) ((D,E)). The previous study showed that the increasing anemia prevalence in the U.S. is paralleled with declining dietary Fe intake. The significant shift of consumption from high Fe concentration meat (i.e. beef) to lower Fe concentration meat (chicken) might be attributed to social-economic status [Citation24]. It is possible that lower socioeconomic status increased anemia prevalence via reducing high Fe-concentration meat consumption. Further work might be warranted to determine whether there are mediation effects of Fe-concentration meat consumption between SES and anemia.
Treatments for anemia were typically low, according to previous studies [Citation21,Citation40]; even in patients with CKD, only 22.8% of CKD patients reported receiving anemia treatment. Our logistic regression model showed that the 20–39 age group were significantly less likely to receive anemia treatment (). The anemia treatment rates for 20–39 were lower than the 40 years and above between 2007 and 2014 ((A)). Generally speaking, the treatment rates of anemia were positively associated with chronic kidney diseases [Citation21]. Therefore, it is possible that the higher treatment rates among older respondents were attributed to chronic conditions. The participants born outside the U.S. had a significantly lower anemia treatment rate than those in the U.S. ((C)). The anemia prevalence rates for non-U.S.-born participants increased dramatically after 2011 in this study, indicating that more resources are needed to reduce the anemia-caused burden for the immigrant community, such as providing insurance coverage for improving anemia treatment rates suggested by (D). Thus, anemia in the minority, such as African Americans and lower socioeconomic communities, needs more attention for its persistent high prevalence and increasing trend and its potential health consequences and social burdens. Population who are susceptible to iron deficiency anemia may also benefit from the development of more efficient regimens to improve iron absorption [Citation41].
Strengths and limitations
The literature on anemia prevalence, especially anemia treatment rates, is scarce to our best knowledge. Our study adds to the body of literature evaluating the anemia prevalence and treatment rate by demographic and socioeconomic groups. This study also investigated factors associated with anemia treatment, on which the literature is limited. However, the study is not without limitations. First, the data in this study were extracted from a cross-sectional survey. Thus, we could not investigate the within-subject effects as with longitudinal survey, therefore could not detect developments or changes in the characteristics of the target population at both the group and the individual level. Causality cannot be established due to the nature of the survey design. Second, the outcome of anemia treatment is self-reported. Thus, the respondents may not correctly answer the questions, which might lead to larger standard error in the trend analysis. Also, the study may be subjected to errors and biases due to the NHANES data sampling procedures. For example, the 2017–2018 NHANES sample had a lower proportions of college graduates and lower mean incomes compared with prior sampling cycle [Citation27], which may lead to a lower anemia rates since higher education and income are associated with lower anemia prevalence.
Directions for future research
Our results updated the latest trends in anemia prevalence and treatment rate available in the NHANES data. There are still many questions that remain to be investigated. While the racial disparities’ specific causes are unclear, further studies are required to elucidate the driving factors such as genetic predisposition, dietary factors, etc. In recent years, many experts advocated for the same hemoglobin threshold for females and males, and the WHO thresholds might be outdated [Citation42]. Therefore, further comprehensive studies are needed to investigate how this new threshold impacts the epidemiology research of anemia.
Disclosure statement
No potential conflict of interest was reported by the author(s).
Data availability statement
The data used in this study can be downloaded from NHANES websites: https://www.cdc.gov/nchs/nhanes/index.htm. Code availability: The code used in this study is available upon request.
Reference
- Zakai NA, Katz R, Hirsch C, et al. A prospective study of anemia status, hemoglobin concentration, and mortality in an elderly cohort: the cardiovascular health study. Arch Intern Med. 2005;165:2214–2220.
- Culleton BF, Manns BJ, Zhang J, et al. Impact of anemia on hospitalization and mortality in older adults. Blood. 2006;107:3841–3846.
- Sant-Rayn P, Tye-Din J, Muckenthaler M, et al. Iron deficiency. Lancet. 2021;397:233–248.
- WHO. Anaemia. 2022 [cited 2022 Jul 2]. Available from: https://www.who.int/health-topics/anaemia#tab=tab_1.
- Jang DK, Kang HW, Kim YH. Association between anemia and dynapenia in older adults: a population-based study. Aging Clin Exp Res. 2022;34:1373–1379.
- Kara O, Smith L, Tan SG, et al. The clinical implications and importance of anemia in older women. Acta Clin Belg. 2022;77:558–564.
- Beladan CC, Botezatu SB. Anemia and management of heart failure patients. Heart Fail Clin. 2021;17:195–206.
- Klebanoff MA, Shiono PH, Selby JV, et al. Anemia and spontaneous preterm birth. Am J Obstet Gynecol. 1991;164:59–63.
- Brabin BJ, Hakimi M, Pelletier D. An analysis of anemia and pregnancy-related maternal mortality. J Nutr. 2001;131:604S–614S.
- Levy A, Fraser D, Katz M, et al. Maternal anemia during pregnancy is an independent risk factor for low birthweight and preterm delivery. Eur J Obstet Gynecol Reprod Biol. 2005;122:182–186.
- Portolés J, Martín L, Broseta JJ, et al. Anemia in chronic kidney disease: from pathophysiology and current treatments, to future agents. Front Med (Lausanne). 2021;8:642296.
- Schwartz RN. Anemia in patients with cancer: incidence, causes, impact, management, and use of treatment guidelines and protocols. Am J Health-Syst Pharm. 2007;64:S5–S13.
- Mayo Clinic. Anemia – diagnosis and treatment. 2022 [cited 2022 Jul 2]. Available from: https://www.mayoclinic.org/diseases-conditions/anemia/diagnosis-treatment/drc-20351366.
- Aapro M, Beguin Y, Bokemeyer C, et al. Management of anaemia and iron deficiency in patients with cancer: ESMO clinical practice guidelines. Ann Oncol. 2018;29:iv96–iv110.
- Dignass AU, Gasche C, Bettenworth D, et al. European consensus on the diagnosis and management of iron deficiency and anaemia in inflammatory bowel diseases. J Crohn’s Colitis. 2015;9:211–222.
- Muñoz M, Acheson AG, Auerbach M, et al. International consensus statement on the peri-operative management of anaemia and iron deficiency. Anaesthesia. 2017;72:233–247.
- Mikhail A, Brown C, Williams JA, et al. Renal association clinical practice guideline on anaemia of chronic kidney disease. BMC Nephrol. 2017;18:1–29.
- Pavord S, Myers B, Robinson S, et al. UK guidelines on the management of iron deficiency in pregnancy. Br J Haematol. 2012;156:588–600.
- Le CHH. The prevalence of anemia and moderate-severe anemia in the US population (NHANES 2003–2012). PLoS One. 2016;11:e0166635.
- Zakai NA, McClure LA, Prineas R, et al. Correlates of anemia in American blacks and whites: the REGARDS renal ancillary study. Am J Epidemiol. 2009;169:355–364.
- Stauffer ME, Fan T. Prevalence of anemia in chronic kidney disease in the United States. PLoS One. 2014;9:e84943.
- Patel EU, White JL, Bloch EM, et al. Association of blood donation with iron deficiency among adolescent and adult females in the United States: a nationally representative study. Transfusion. 2019;59:1723–1733.
- Patel D, Yang Y-X, Trivedi C, et al. Incidence, duration, and management of anemia: a nationwide comparison between IBD and non-IBD populations. Inflamm Bowel Dis. 2020;26:934–940.
- Sun H, Weaver CM. Decreased iron intake parallels rising iron deficiency anemia and related mortality rates in the US population. J Nutr. 2021;151:1947–1955.
- Harvey P. A strategic approach to anemia control. MOST, the USAID micronutrient program. 2004.
- Johnson CL, Paulose-Ram R, Ogden CL, et al. National health and nutrition examination survey. Analytic guidelines, 1999–2010. 2013.
- Fakhouri TH, Martin CB, Chen T-C, et al. An investigation of nonresponse bias and survey location variability in the 2017–2018 national health and nutrition examination survey. Vital Health Stat Data Eval Methods Res. 2020;185:1–36.
- Chen T-C, Clark J, Riddles MK, et al. National health and nutrition examination survey, 2015–2018: sample design and estimation procedures. 2020.
- World Health Organization. Nutritional anaemias: report of a WHO scientific group [meeting held in Geneva from 13 to 17 March 1967. World Health Organization; 1968.
- Cowan AE, Jun S, Gahche JJ, et al. Dietary supplement use differs by socioeconomic and health-related characteristics among US adults, NHANES 2011–2014. Nutrients. 2018;10:1114.
- Bailey RL, Akabas SR, Paxson EE, et al. Total usual intake of shortfall nutrients varies with poverty among US adults. J Nutr Educ Behav. 2017;49:639–646.
- Young SS. The Cochran-Armitage test for trends or thresholds in proportions. In: Lave LB, editor. Risk assessment and management. Boston (MA): Springer; 1987. p. 467–479.
- Stokes ME, Davis CS, Koch GG. Categorical data analysis using SAS. CARY (NC): SAS institute; 2012.
- World Health Organization. Haemoglobin concentrations for the diagnosis of anaemia and assessment of severity. World Health Organization; 2011.
- Seitz AE, Eberhardt MS, Lukacs SL. Anemia prevalence and trends in adults aged 65 and older: US national health and nutrition examination survey: 2001–2004 to 2013–2016. J Am Geriatr Soc. 2018;66:2431.
- Gandhi SJ, Hagans I, Nathan K, et al. Prevalence, comorbidity and investigation of anemia in the primary care office. J Clin Med Res. 2017;9:970.
- Rahman EU, Chobufo MD, Farah F, et al. Prevalence and temporal trends of anemia in patients with heart failure. QJM Int J Med. 2021;115(7):437–441.
- Beutler E, West C. Hematologic differences between African-Americans and whites: the roles of iron deficiency and α-thalassemia on hemoglobin levels and mean corpuscular volume. Blood. 2005;106:740–745.
- Patel KV, Harris TB, Faulhaber M, et al. Racial variation in the relationship of anemia with mortality and mobility disability among older adults. blood. J Am Soc Hematol. 2007;109:4663–4670.
- Lenz O, Fornoni A. Chronic kidney disease care delivered by US family medicine and internal medicine trainees: results from an online survey. BMC Med. 2006;4:1–9.
- Stoffel NU, Cercamondi CI, Brittenham G, et al. Iron absorption from oral iron supplements given on consecutive versus alternate days and as single morning doses versus twice-daily split dosing in iron-depleted women: two open-label, randomised controlled trials. Lancet Haematol. 2017;4:e524–e533.
- Butcher A, Richards T, Stanworth SJ, et al. Diagnostic criteria for pre-operative anaemia–time to end sex discrimination. Anaesthesia. 2017;72:811–814.