
 ?Mathematical formulae have been encoded as MathML and are displayed in this HTML version using MathJax in order to improve their display. Uncheck the box to turn MathJax off. This feature requires Javascript. Click on a formula to zoom.
ABSTRACT
Objectives
The immune-induced aplastic anemia (AA) mouse model has been used for the study of AA. However, there were no uniform conditions for establishing a model and no assessment of immunological homeostasis. Our study aimed to identify the conditions of establishing a model and assess the AA model in immunology and pathology.
Methods
We induced an AA mouse model by the combination between sublethal irradiation and spleen-thymus lymphocyte infusion. The success of establishing the AA model was identified by blood routine tests and pathology of bone marrow. The frequency of Th17 and Treg cells was measured by flow cytometry. The frequency of CD34+ and CD41+ cells was detected by immunohistochemical technique.IL-6, IL-8, IL-17, TNF-α and IFN-γ were evaluated by ELISA.
Results
The 137Cs sublethal irradiation (5 Gy) and spleen-thymus lymphocyte infusion (5 106) induced the AA mouse model successfully. The AA mice had a long lifetime and manifested pancytopenia and bone marrow failure. The percentage of Th17 cells increased and the percentage of Treg cells decreased distinctly in AA mice. The area of hematopoietic tissues and count of CD34+ cells and CD41+ cells were significantly reduced in AA mice.The level of cytokines, IL-6, IL-8, IL-17, TNF-α and IFN-γ, was increased significantly in peripheral blood and bone marrow.
Conclusion
Our data suggest that the improved AA mouse model conforms to the diagnosis standard of AA and simulates the immune internal environment of human AA. The AA mouse model has a longer lifetime and unbalances of Th17/Treg cells caused the destruction of CD34+ cells and CD41+ cells, which was immune-mediated pathogenesis to adapt to long-term research.
Introduction
Aplastic anemia (AA) is a common, life-threatening hematological system disease associated with morbidity and mortality, which is characterized by bone marrow failure and pancytopenia [Citation1]. The most clinical manifestation is anemia, infection and thrombocytopenia. According to the statistics, the estimated annual incidence of AA is 2/106 in occident; however, the three- to —four-fold higher incidence of AA is 7.4/106 per year in China [Citation2]. The cause of AA remains unknown, but the current consensus is lymphocyte destruction of early hematopoietic cells. As for the immune mechanism, an unknown pathogen infects the hematopoietic stem cell (HSC) compartment, then macrophages and antigen-presenting cells uptake and present antigens to naïve CD4+T cells. Under interleukin (IL)-2 and IL-6 stimulation, naïve T cells differentiate in T helper (Th) 1 cells to produce tumor necrosis factor-alpha (TNF-α) and interferon-gamma (IFN-γ) to sustain effector cytotoxic CD8+T lymphocyte (CTL) activation [Citation3]. CTL kills directly to target cells via granzyme B (GzmB) and perforin (PFN). In addition, Th17 cells induce the selection of effector memory CD8+T cells (Tem) sustaining HSC apoptosis and reducing regulatory T cell (Treg) functions and number [Citation4,Citation5]. Recent improvement in the pathogenesis of AA is genetic alteration, including telomerase genetic mutations and somatic mutation [Citation6,Citation7]. Frontline therapy involves immunosuppressive therapy (IST) [Citation8]. Nevertheless, due to the limitations of some factors including the age of the patient, AA severity, the response of IST and transplantation availability, a part of patients still suffer from treatment failure and disease progression including refractory AA and severe AA (sAA). Furthermore, the combination therapy with androgen and hematopoietic factors cannot keep patients apart from transfusion dependence [Citation9].
Dry tap bone marrow aspiration and less sample occurs when patients undergo bone marrow examination [Citation10]. However, pathogenesis research needs to take a large number of bone marrow samples, which is difficult to achieve. Therefore, the animal model of AA helps us to explore the mechanisms causing AA. Formerly, toxic chemicals and drugs, such as cyclophosphamide, chloramphenicol, and radiation, induce bone marrow failure, which damages bone marrow stromal cells, hematopoietic stem cells and progenitor cells [Citation11]. But it cannot simulate the immune mechanism of AA. Based on the immune mechanism in human, bone marrow failure induced by lymphocyte, immune-mediated animal model has attracted more and more attention. Chen et al. [Citation12] used the combination of sublethal total body irradiation (TBI) and LN cell infusion to lead lymphocyte infiltration-destructed hematopoietic progenitor and stem cell in the bone marrow. Ellison et al. [Citation13] infused LN cell and spleen cell to the recipients to induce acute, lethal graft-versus-host disease (GVHD) in the intestine. Most researchers mainly assess the situation of bone marrow failure with blood routine, hematopoietic cells, spleen colony-forming units (CFU-S) and colony-forming cells (CFU-C) [Citation14–16]. However, the unbalanced ratio of the T lymphocyte subpopulation in AA patients was not detected in model mice [Citation17]. Furthermore, the model mice of bone marrow failure received a higher dosage of TBI (5–6 Gy) with LN cell (5–10 106) infusion in previous studies. Although the model mice with severe bone marrow failure were obtained, the average survival time was no more than three weeks so the survival time was inadequate to respond to treatment. On the other hand, LN cells were less origin and too difficult to obtain.
In the current study, we induced AA using the combination of sublethal TBI and thymus-spleen lymphocyte cells infusion with different dosages, and overall assess the clinical manifestation of AA, including peripheral blood cell analysis, T lymphocyte subpopulation and bone marrow pathology from day +1 to day +22. In this study, model mice survived to the end of the experiment, and had pancytopenia, unbalance ratio of Th17/Treg, and bone marrow failure with decreased CD34+ and CD41+ cells. It also showed that lower irradiation dosage cannot maintain a stable AA model for long. Higher dosage irradiation with thymus-spleen lymphocyte infusion can better simulate the internal environment of AA and maintain a longer time for follow-up experiments.
Materials and methods
Animals and grouping
A total of 60 male Balb/c mice (weight, 13–15 g) aged six to eight weeks and five male DBA/2 mice (weight, 13–15 g) aged six to eight weeks were purchased and fed in the laboratory animal center of the Institute of Radiation Medicine, Chinese Academy of Medical Sciences (Huafukang Bioscience, Beijing, China). Mice were randomly assigned to the following groups (). The experiment was conducted in accordance with the guideline for the care and use of laboratory animals of the National Institute of Health of China and approved by the Animal Management and Ethics Committee of Tianjin Medical University. Donor and recipient were matched for sex in each experiment.
Table 1. Information on mouse grouping.
Induction of mice model
DBA/2 donor mice were euthanized via cervical dislocation. Spleens and thymuses from DBA/2 donor mice were homogenized in phosphate-buffered saline (PBS) manually, filtered through a 70 μm nylon mesh (Labgic Technology, Beijing, China), isolated and purified by a mouse lymphocyte separation liquid kit (Tianjin HaoYang Biological Manufacture, Tianjin, China), respectively. Spleen and thymus lymphocytes were counted with a counter (Counter, Shanghai, China) and mixed on the basis of a certain rate of cell density (splenic lymphocytes: thymic lymphocytes = 2:1) [Citation18]. And then, adjusting the density of mixture cell suspension to 1 × 10⁷/ml, 3 × 10⁷/ml and 5 × 10⁷/ml. All the above operations were sterile. According to the animal grouping, each Balb/c mouse was TBI with different dosages of 137Cs (4 Gy, 4.5 Gy and 5 Gy) within 10 min from Nordion Gammacell 40 (Institute of Radiation Medicine of Chinese Academy of Medical Sciences, Tianjin, China). Spleen-thymus lymphocytes were infused into Balb/c recipients through lateral tail veins at 0.1 ml (1 × 10⁶, 3 × 10⁶ or 5 × 10⁶ cells/ mouse) within 4–6 h after irradiation. Mice were monitored blood routine two times a week until they died or were euthanized when one of their blood routine indexes returned to almost normal.
Survival rate and general states
The survival situation was recorded continuously and the survival rate was measured. Observing the occurrence and clinical manifestations of GVHD, particularly measuring the main outcomes, including tiredness, anorexia, weight loss, arch shape, piloerection, diarrhea and death [Citation19].
Peripheral hemograms
Peripheral blood was collected from the orbital sinus of the mouse in each group on days +1, +8, +15 and +22. White blood cells, red blood cells, platelets and reticulocytes were analyzed using an automated hematology analyzer for animals (BC-5000Vet; Mindray bio-medical electronics Co., Ltd., Shenzhen, China).
Flow cytometry of lymphocyte subpopulation
Spleen lymphocytes suspension was obtained from model mice in each group on day +22. Spleen lymphocyte suspension was divided into group A and B. Group A was grown with RPMI-1640 culture medium (including 10% fetal bovine serum) in six-well plates and treated with 10 ng/ml phorbol 12-myristate 13-acetate (PMA), 1 μM lonomycin and 10μg/ml brefeldin A (BFA) (final concentration). Plates were incubated 6 h in a CO2 incubator set to 37°C and 5% CO2. The cell suspension was collected and centrifuged at 400 g at room temperature for 5 min, Supernatant was decanted, then 1 ml PBS was added to wash cells and centrifuged at 400 g at room temperature for 5 min. Supernatant was decanted, then 100 μl PBS and 5 μl FITC-CD4 antibody were added to the appropriate tube. It was mixed by a vortex and incubated for 30 min at room temperature in the dark. Then 2 ml cell was added with a staining buffer. Cells were washed twice. Group B cells were indicated with 5 μl FITC-CD4 antibody and 5 μl PE-CD25 antibody, which was from BD Biosciences. After centrifugation and removal of the supernatant, cells were fixed and permeabilized with the FOXP3 Fix/Perm Buffer set (Biolegend, San Diego, CA, U.S.A.), according to the manufacturer’s protocol. Meanwhile, 5 μl APC-FOXP3 antibody was added. Finally, cells were washed twice with PBS. Analyses were carried out using a NovoCyte Flow Cytometer (NovoCyte 2000, Agilent Technologies, CA, U.S.A.), and the acquisition was stopped when 300,000 cells were collected for each example.
Pathology of the bone marrow
Thigh bones were removed from the mice of each group on day +22. Bone tissues underwent the following processes: fixation with formalin for 3 days, EDTA-decalcification for 28 days (replacement of EDTA every three days), paraffin-embedding with HistoCore Arcadia (Lecia, Germany) and serial 4 μm sections with Histocore Biocut (Lecia, Germany). HE and immunohistochemical staining techniques were applied to each sample. HE staining was accomplished with the ST5010 Autostainer XL (Leica, Wetzlar, Germany), while immunohistochemical staining was processed in a specific method. The CD34 and ITGA2B (CD41) polyclonal antibody (Boster, Wuhan, China) was used as the primary antibody. Taking CD34, for example, bone marrow sections were dewaxed and dehydrated with xylene and different concentrations of ethyl alcohol by the ST5010 Autostainer XL first. After washing twice with distilled water and PBS, the observed area of tissue was circled with the PAP pen. Then, slides were incubated with endogenous peroxidase blocking solution (Rabbit two-step detection kit, Zsbio, Bejing, China) for 10 min at room temperature in a moist box. Slices were washed three times with PBS and incubated with the primary antibody for 16 h at 4°C in a moist box. Then, slices were rewarmed at room temperature for 30 min and washed three times with PBS. Reaction enhance solutions were added to the surface of tissues, while incubating for 20 min at room temperature. After washing, slices were incubated with enhanced enzyme labeled goat anti-rabbit IgG polymer for 20 min and washed. The appropriate 3,3′-Diaminobenzidine (DAB) (DAB chromogen kit, Zsbio, Bejing, China) was added to the slices for 3 min. Slices were performed with the following processes orderly by the ST5010 Autostainer XL, counterstain in hematoxylin, color separation in hydrochloric acid solution and bluing. For qualification, CD34-stained slices were assessed for internal positive controls (HSC) and negative controls (mature lymphocyte, mature granulocyte erythrocyte and megakaryocyte). On the other hand, ITGA2B (CD41) expression only occurred in megakaryocytes, but not in other hematopoietic cells. The hyperplasia of bone marrow and positive rate of CD34/ITGA2B (CD41) expression was taken as the observation index. Observing the bone marrow biopsy sections with an inverted microscope (Nikon eclipse Ti2, Tokyo, Japan), catching the images under 200 magnification (scale of 1.83 μm/px) and calculating the area of bone marrow hematopoietic tissues with ImageJ. The positive cell of CD34/ITGA2B (CD41) expression was recognized and qualified with an inverted microscope using manual observation. Microscopic fields were examined for the number of events (positive cells). Bone marrow biopsy sections (three microscopic fields per mouse) were observed for counting the CD34/CD41 positive cells. The number of positive cells per field was recognized and determined by three observers in each biopsy section.
ELISA
Serum was obtained by peripheral blood underwent centrifugation at 1000 g for 10 minutes. Bone marrow was washed with 300 μl RPMI-1640 and the suspension was centrifugated at 400 g for 10 minutes to obtain the supernatant of bone marrow. Serum and the supernatant of bone marrow IL-6, IL-8, IL-17, TNF-α and IFN-γ concentration was analyzed using enzyme-linked immunosorbent assay (ELISA) with the Mouse IL-6, IL-8, IL-17, TNF-α and IFN-γ kit (SINOVAC BIOTECH, Beijing, China) according to the manufacturer protocol. Briefly, the diluted samples were added to the ELISA plates which was pre-coated, and then the enzyme-labeled antibody was added after incubating for 2h. After washing five times, the substrate for color development was added, and light absorbance was analyzed using the microplate reader (Becton Dickinson, New Jersey, USA) at 450 nm.
Statistics
ImageJ was used to process the images of flow cytometry and bone marrow pathology. Prism 8 was used to analyze data from blood routine, flow cytometry and bone marrow pathology using the one-way analysis of variance and Pearson’s correlation analysis. Data were presented as mean ± SEM and r2 value.
Results
Clinical signs and symptoms
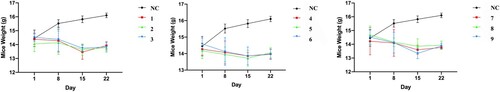
Sixty mice were identified as being appropriate for analysis within this study. Their age was six to eight weeks before the start of the experiment. Weight, survival rate, clinical signs and symptoms were recorded from the start of the experiment to the day +22. One of the mice died during the tail vein infusion, while all the other mice survived to the end of the experiment (survival rate: 98.33%). The weight of model mice fell continuously by a mean of 3.32%, while the control mice grow by a mean of 11.42%. Furthermore, the weight of the model group decreased significantly compared to the control group; however, there were no differences among model groups (p .01; ). In addition, the model mice displayed hypopraxia, piloerection and hypotrichosis on day +3. During the experiment, none of the mice had severe GVHD, including diarrhea, skin lesion and death.
Figure 1. The weight changes of mice from day +1 to day +22. All model mice had lower weight than the group NC, model group vs. group NC, p < 0.01. However, there were no significant differences among model groups.
Peripheral blood data
The white blood cell (WBC), hemoglobin (HGB), platelet (PLT) and reticulocyte (RET) concentrations (mean±SEM) of the group normal control were 8.53 × 10⁹/L, 182.7 g/L, 1192 × 1012/L and 7.93%, respectively. The data of model groups compared with group normal control had the following features: (A) Mean WBC count decreased rapidly to its lowest point on day +8, after that it began to increase again. Although the WBC count of group 4 Gy increased markedly, the WBC count in every model group had significant differences from that in the normal control group on day +22. (B) The mean HGB count decreased and increased slowly, and the lowest point occurred on day +15. Moreover, the HGB count of group 4 Gy and partly group 4.5 Gy showed no significant differences compared with group normal control on day +22. (C) Mean PLT count decreased obviously on day +15. Compared with group normal control, every model group was significant differences. (D) The trend of RET was similar to that of WBC. Generally, group 5 Gy showed the pancytopenia constantly from day +8 to day +22. All in all, the significant differences of every model group are demonstrated in (ap .01, bp
.05) and .
Figure 2. Peripheral blood routine of mice among groups on days +1, +8, +15, +22. Data were presented as mean ± standard error of the mean. *p .05, **p
.01 vs. group NC. WBC, white blood cell count; HGB, hemoglobin count; PLT, platelet count; RET, the ratio of reticulocytes.
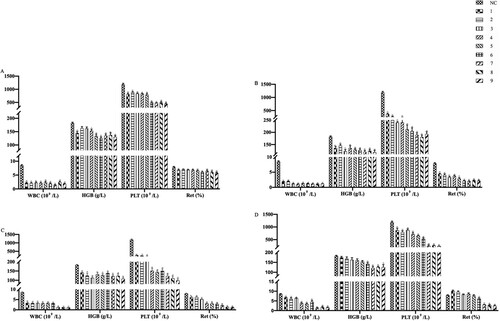
Table 2. Peripheral Blood cell count in mice.
In addition, an inverse correlation between change in WBC, HGB, PLT and RET count and change in irradiation dosage was found (). What the interesting was that there was no significant difference between WBC, HGB, PLT and RET count and lymphocytes (p < .05).
Table 3. Correlation analysis between WBC, HGB, PLT, RET and radiation dosage.
T lymphocyte subpopulation parameters
After irradiation and infusion on day +22, the result of flow cytometry showed evidence of Th17/Treg cells unbalanced in the model group, with an increase in mean Treg cell % (2%–3.96%, p = .05), a decrease in mean Th17 cell % (4.9%–1.94%, p = .24) relative to group normal control (). shows the significant differences of Th17 and Treg cells between model groups and group normal control. It indicated that group 5C showed unbalance of Th17/Treg cells distinctly. However, the changes in the T lymphocyte subpopulation had no correlation with radiation dosage or lymphocyte infusion. Moreover, an example of the proportion of positive cells obtained for the result of flow cytometry is presented in .
Figure 3. Comparison of Th17 and Treg cells among groups at day +22 after the establishment of the aplastic anemia model. Th17 cells were marked with CD4 and IL17 antibodies, while Treg cells were marked with CD4, CD25 and Foxp3 antibodies. Cells division was measured by flow cytometry. The rate of Th17 and Treg cells was presented by the histogram, respectively. Data were expressed for 10 groups as mean ± standard error of the mean (n = 3). *p .05 vs. group NC, **p
.01 vs. group NC.
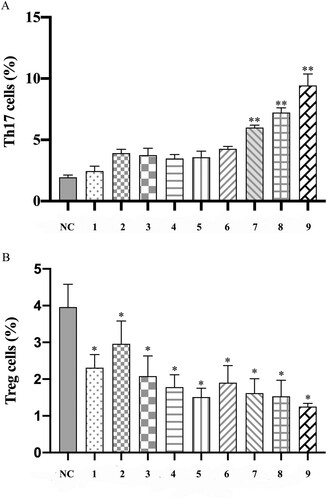
Figure 4. The rate of Th17 and Treg cells on flow cytometry. (A) The total splenic lymphocytes were gated, chose the CD4+ T cell in it. Based on the CD4+ T cell, chose the IL17+ cells (Th17 cells: CD4 + IL17+ cells) with a rectangular gate among each group. (B) The total splenic lymphocytes were gated, chose the CD4+ CD25+ T cells in it. Then, choosing the Foxp3+ cells regarded as Treg cells (CD4+CD25+Foxp3+ cells) from CD4+ CD25+ T cells with rectangular gate among each group.
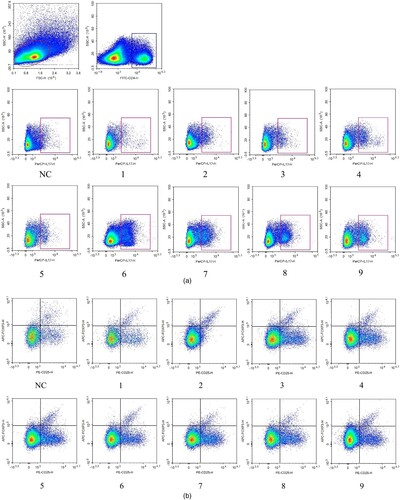
Table 4. Rate of Th17 and Treg cells among groups.
Pathology of bone marrow
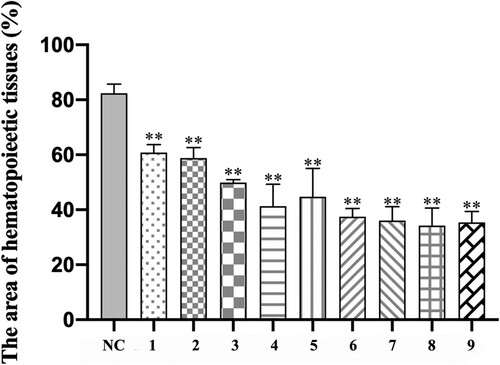
The result demonstrated that every model group had different degrees of hypoplasia than the group normal control. Group normal control occurred in the hyperplasia of bone marrow, the mean area of hematopoietic tissue (82.38%), and clearly visible megakaryocyte diffusion. On the contrary, the bone marrow of the model group showed hypoplasia, decreased karyocytes and agenesis megakaryocytes and increased fat granules, with the rise of irradiation dosage and infused lymphocyte cells. and demonstrate the difference in hematopoietic area among groups on day +22 visually and statistically.
Figure 5. Morphological changes of bone marrow. Hematoxylin-eosin-stained bone marrow sections were observed under an inverted microscope and photographed at 200 magnification. Karyocytes were stained blue with hematoxylin, while erythrocyte and bone trabecula were stained red with eosin. The system, including granulocytes, erythrocytes, megakaryocytes and lymphocytes, was regarded as hematopoietic tissue; meanwhile, bone trabecula, bone and adipose tissue belonged to the non-hematopoietic tissue.
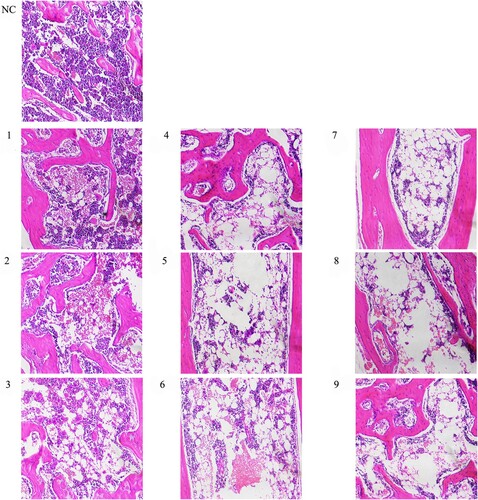
Figure 6. Comparison of the area of hematopoietic tissue among groups on day +22. ImageJ was used to recognize and calculate the area percentage of hematopoietic tissue in total medullary space. Data were presented as mean ± standard error of the mean (n = 3). *p .05 vs. group NC, **p
.01 vs. group NC.
Immunohistochemical parameters
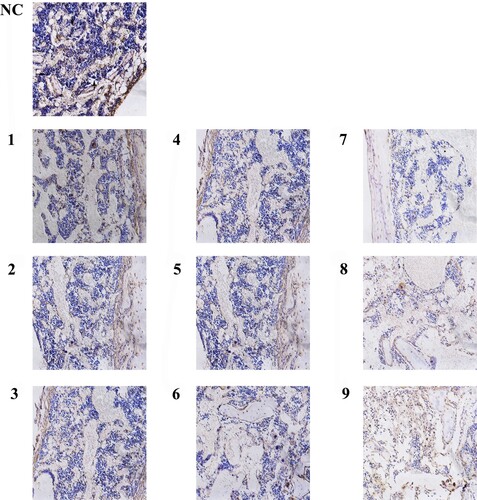
As assessed by CD34 immunohistochemistry, the hematopoietic and progenitor cells (events per field) decreased significantly in the AA model mice compared to group NC (). There were masses of positive cells in group NC, while the positive cells declined gradually from group 4A to group 5C, especially in group 5C, which were almost no positive cells. Nevertheless, shows a decreased trend of CD34+ cells number in every group. The differences in CD34+ cell count between the model group and group NC had statistical significance. In addition, the number of CD34+ cells in group 5 Gy decreased significantly compared with group 4 Gy and group 4.5 Gy, meanwhile, the number of CD34+ cells in group 4.5 Gy also decreased obviously compared with group 4 Gy (p .01). However, the differences in changes among the group, which received the same irradiation dosage, were not statistically significant.
Figure 7. Bone marrow biopsy stained with CD34 (200 magnification). The arrow shows positive cells, which are hematopoietic stem or progenitor cells. The cytoplasm of cells marked CD34 was brown, while the cell nucleus of karyocytes was blue. The CD34 positive cells and mass had diffuse distribution in group NC. However, the CD34 positive cells had scattered distribution and positive cell mass was rare in group 4 Gy. Obviously, from group 4.5 Gy to group 5 Gy, the frequency of positive cells gradually decreased.
In bone marrow sections, megakaryocytes and platelets expressed CD41; therefore, CD41 positive cells were used to assess the expansion of megakaryocytes. In model mice with aplastic anemia, almost no megakaryocytes were detected (events per field), by contrast, the mice of group NC detected megakaryocytes visibly (). As a result of almost no detected megakaryocytes in bone marrow sections of group 5 Gy, the megakaryocyte counts between group 4 Gy, group 4.5 Gy and group NC only were compared (, p .01), and the CD41+ cells decreased significantly in group 4.5 Gy compared with group 4 Gy (p
.01)
ELISA
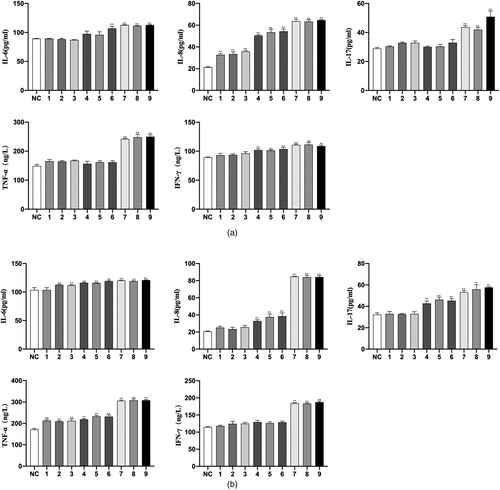
On the level of cytokines, the result of ELISA demonstrated that the expression of IL-6, IL-8, IL-17, TNF-α and IFN-γ in group AA was higher than that in group NC both in peripheral blood and bone marrow (p < 0.01, (). Moreover, the group 5 Gy showed the most significant difference.
Figure 8. Bone marrow biopsy stained with CD41 (200 magnification). The arrow shows positive cells which are megakaryocytes and platelets. The cytoplasm of cells marked CD41 was brown, while the cell nucleus of karyocytes was blue. The CD41 positive cells were larger and had scattered distribution in group NC. However, the positive cells decreased obviously in group 4 Gy. Moreover, the positive cells were found hardly in group 4.5 Gy, while even were not observed in group 5 Gy.
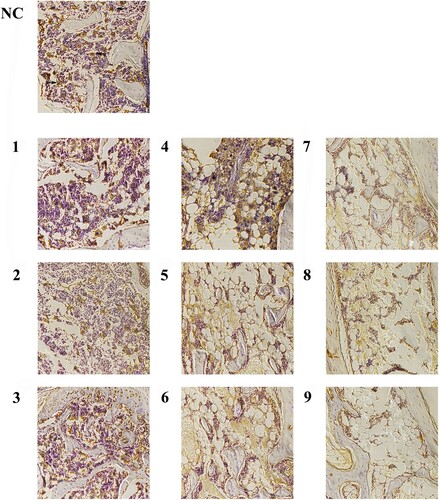
Figure 9. Comparison of CD31 and CD41 cells count in bone marrow biopsy sections among groups. The positive cells stained by the immunohistochemistry technique were counted on day +22. (A) The histogram of CD34 + cell counts among groups. (B) The histogram of CD41+ cell counts among groups. Data were presented as mean ± standard error of the mean (n = 9). *p .05 vs. group NC, **p
.01 vs. group NC.
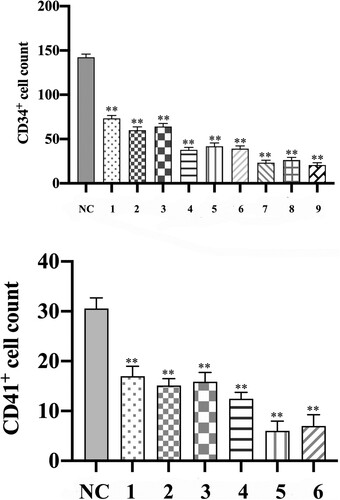
Figure 10. The level of IL-6, IL-8, IL-17, TNF-α and IFN-γ. (a) The cytokines in peripheral blood. (b) The cytokines in bone marrow. Data were presented as mean ± standard error of the mean (n = 3). *p < 0.05 vs. group NC, **p < 0.01 vs. group NC.
Discussion
In our study, the mouse model that had very similar pathologic change and internal environment in AA patients was obtained using sublethally TBI and spleen-thymus lymphocyte infusion [Citation20]. WBC, RBC, PLT and RET count decreased rapidly after establishing the model and dropped to more than 50% of normal within 1 week, which did conform with the clinical manifestation of AA in humans [Citation21]. Mice were kept alive for four weeks and had variable degrees of bone marrow failure, which indicated that a stable and durable mouse model of AA was established.
Mice did not appear typical symptom of acute GHVD responses, such as fever, diarrhea, skin lesion and death [Citation22]. The general condition of model mice was steady after transplanting allogeneic lymphocytes, which was different from the previous study [Citation23]. Recipients were collected blood for peripheral blood cell analysis on 1, 8, 15 and 22 days after irradiating and infusing lymphocytes. WBC and PLT were sensitive to TBI and spleen-thymus lymphocyte infusion and decreased dramatically on day +1 (p .01), while HGB and RET responded to intervention conditions gradually. On eight days, every indicators of blood routine all decreased to the minimum, after that, the indicators gradually recovered with RET-led on day +15. Until day +22, RET recovered to nearly normal even more than it in the group 4 Gy and group 4.5 Gy, and HGB recovered correspondingly. Reticulocytes were a sensitive indicator to assess the erythroid colonies [Citation24]. It may be that the dosage of TBI and lymphocyte infusion was not adequate to destruct hematopoietic stem cells and pronormoblasts, leading to activating the compensatory hematopoiesis. WBC recovered obviously in group 4 Gy, because of the significant correlation between WBC and irradiation dosage (r = 0.45, p
.01). PLT still conforms with the gradual decrease and increase. Furthermore, WBC and PLT counts in group 5 Gy were below the counts in group 4 and 4.5 Gy significantly (p
.01). Nevertheless, indicators had no significant difference among group 5 Gy, though the indicators of group 5 Gy were the lowest among other groups. These data indicated that the dosage of TBI was crucial to the severity of AA in mice, which both had a positive correlation, and suggested that the number of infused spleen-thymus lymphocytes seemed to relate to the duration of disease.
The unbalanced ratio of T lymphocytes in group 5 Gy of our AA model mice was significant, as evidenced by an approximate eight-fold rise in Th17 cells and a one-fold decline in Treg cells. Th17 cells secreted IL-17, IL-22 and TNF-α belong to the subset of CD4+ T cells and play a critical role in inflammation and autoimmunity [Citation25,Citation26]. IL-17 can promote the production of IL-6, IL-8 and TNF-α and serve as an effective factor in T cells’ mediated autoimmune response [Citation27,Citation28]. Furthermore, the Th17 cells are inhibitors of human hematopoietic progenitor proliferation [Citation29]. It indicated that Th17 cells are active cytotoxic T cells by producing cytokines or directly damaging hematopoietic cells. We found that IL-6, IL-8 IL-17, TNF-α and IFN-γ increased significantly in AA mouse model, which was consistent with the result of flow cytometry. On the other hand, Treg cells, special CD4+ T cells expressing CD25 and Foxp3, suppressed directly the activation and function of cytotoxic T cells [Citation30,Citation31]. Recent studies demonstrated that the frequency of Th17 cells increased in AA patients with a reduction of Treg cells [Citation32]. Due to the unbalance of Th17/Treg, cytotoxic T cells were activated unusually to destruct hematopoietic cells, which was one of the main mechanisms of causing AA. Therefore, we chose Th17 cells and Treg cells as a method of model assessment. At 22 days after establishing the model, Th 17 cells increased distinctly in group 5 Gy, and Treg cells reduced in each group and correlated with the intervention dosage. This result also proved that unbalance of Th17/Treg cells played a role in the mechanism of AA. Generally, our results complemented the blank of lymphocyte subpopulation unbalances compared with the other findings of mouse models of AA.
Bone marrow pathology is the gold standard for diagnosing AA [Citation33]. The classical characteristic is the reduction or agenesis of hematopoietic stem cells and megakaryocytes [Citation34]. We examined the bone marrow biopsy sections by immunohistochemical technique. As a result, with the dosage of TBI and spleen-thymus lymphocyte infusion, the counts of karyocytes declined gradually. Moreover, bone marrow congestion is an outstanding feature in group 4 Gy on 22 days, which was consistent with peripheral blood routine tests. It suggested that lower dosage irradiation and spleen-thymus lymphocyte infusion only destructed hematopoietic cells partly to cause peripheral anemia, which was false anemia rather than bone marrow failure. Bone marrow occurred compensatory hematopoiesis manifesting hemolysis in situ and higher levels of reticulocyte counts. CD34+ cells and CD41+ cells decreased obviously in group 4.5 Gy, particularly in group 5 Gy which was almost on positive cells. In addition to hematopoiesis, CD34+ cells may relate to intact microvasculature [Citation35], and the structure of microvasculature was found rarely in our study. Based on CD41 immune staining, the qualitative abnormalities of micro-megakaryocytes were helpful to auxiliary diagnosis AA [Citation36]. In the immunohistochemical experiment, the change in CD41+ cells was particularly obvious compared with CD34+ cells. As a result, CD41+ cells even couldn’t be found in group 5 Gy. However, according to the previous studies, megakaryocytes did not decrease distinctly in the bone marrow biopsy sections of the only irradiation group [Citation37,Citation38]. Unlike the result of irradiation-induced model, we suggested that the destruction of megakaryocytes seems to be mainly correlated with spleen-thymus lymphocyte infusion.
We report here that infusing allogeneic spleen-thymus lymphocytes (5 106 cells/mouse) into recipients who received TBI (5 Gy) induced AA in mice can serve as a model for human AA. Spleen-thymus lymphocytes from DBA/2 donors at a ratio of 2:1 can provide effective cells. We demonstrated that the AA model mice induced by the combination of TBI and spleen-thymus lymphocyte infusion manifest pancytopenia, unbalance of Th17/Treg cells and bone marrow failure with the destruction of CD34+ cells and CD41+ cells, the immunity damage with IL-6, IL-8, IL-17, TNF-α and IFN-γ increased both in peripheral blood and bone marrow.
Ethics approval
This study was approved by the Animal Management and Ethics Committee of Tianjin Medical University.
Acknowledgements
We thank the Basic Medical Research Center of Tianjin Medical University and Laboratory of Integrated Chinese and Western Medicine, General Hospital of Tianjin Medical University (Tianjin, China) for their equipment support and technical guidance.
Disclosure statement
No potential conflict of interest was reported by the author(s).
Additional information
Funding
Notes on contributors
Runfeng Ni
Runfeng Ni, a medical postgraduate student of Tianjin Medical University General Hospital, has researched interests in anemia and bone marrow failure. E-mail: [email protected]
Liwei Fan
Liwei Fan, a medical postgraduate student of Tianjin Medical University General Hospital, has researched interests in anemia and bone marrow failure. E-mail: [email protected]
Le Zhang
Le Zhang, a medical PhD student of Tianjin Medical University General Hospital, has researched interests in anemia and bone marrow failure. E-mail: [email protected]
Yanqi Song
Yanqi Song, a medical PhD student of Tianjin Medical University General Hosptial, has researched interests in anemia and bone marrow failure. E-mail: [email protected]
Haijin Wang
Haijin Wang, a medical postgraduate student of Tianjin Medical University General Hospital, has researched interests in anemia and bone marrow failure. E-mail: [email protected]
Aidi Wang
Aidi Wang, a physician, has researched in bleeding and coagulation. E-mail: [email protected]
Baoshan Liu
Baoshan Liu, a professor, has researched in anemia and blood malignancies. E-mail: [email protected]
References
- Peslak S, Olson T, Babushok D. Diagnosis and treatment of aplastic anemia. Curr Treat Options Oncol. 2017;18(12):70.
- Young N, Kaufman D. The epidemiology of acquired aplastic anemia. Haematologica. 2008;93(4):489–492.
- Patel BA, Giudice V, Young NS. Immunologic effects on the haematopoietic stem cell in marrow failure. Best Pract Res Clin Haematol. 2021;34(2):101276.
- Giudice V, Selleri C. Aplastic anemia: pathophysiology. Semin Hematol. 2022;59(1):13–20.
- Giudice V, Risitano AM, Selleri C. Infectious agents and bone marrow failure: a causal or a casual connection? Front Med (Lausanne). 2021;8:757730.
- Keel S, Scott A, Sanchez-Bonilla M, et al. Genetic features of myelodysplastic syndrome and aplastic anemia in pediatric and young adult patients. Haematologica. 2016;101(11):1343–1350.
- Fogarty P, Yamaguchi H, Wiestner A, et al. Late presentation of dyskeratosis congenita as apparently acquired aplastic anaemia due to mutations in telomerase RNA. Lancet. 2003;362(9396):1628–1630.
- Young N. Aplastic anemia. N Engl J Med. 2018;379(17):1643–1656.
- Xu ZL, Huang XJ. Haploidentical stem cell transplantation for aplastic anemia: the current advances and future challenges. Bone Marrow Transplant. 2021;56(4):779–785.
- Islam A. Diagnostic value of preparing bone marrow smears from the small amount of material left within the aspiration needle following a dry tap. Clin Case Rep. 2018;6(12):2427–2430.
- Testa NG, Hendry JH, Molineux G. Long-term bone marrow damage in experimental systems and in patients after radiation or chemotherapy. Anticancer Res. 1985;5(1):101–110.
- Chen J, Lipovsky K, Ellison F, et al. Bystander destruction of hematopoietic progenitor and stem cells in a mouse model of infusion-induced bone marrow failure. Blood. 2004;104(6):1671–1678.
- Ellison C, Natuik S, Mcintosh A, et al. The role of interferon-gamma, nitric oxide and lipopolysaccharide in intestinal graft-versus-host disease developing in F1-hybrid mice. Immunology. 2003;109(3):440–449.
- Yuan T, Han X, Liu H, et al. Mouse parabiosis model promotes recovery of lymphocytes in irradiated mice. Int J Radiat Biol. 2021;97(11):1589–1596.
- Chiu KM, Knospe WH. Immunologically mediated aplastic anemia in mice: effects of varying the source and composition of donor cells. Exp Hematol. 1987;15(3):269–275.
- Chen J, Desierto MJ, Feng X, et al. Immune-mediated bone marrow failure in C57BL/6 mice. Exp Hematol. 2015;43(4):256–267.
- Liu C, Sun Y, Shao Z. Current concepts of the pathogenesis of aplastic anemia. Curr Pharm Des. 2019;25(3):236–241.
- Ziqian Z, Shuyi L, JiQiao Y, et al. Experimental comparative study on preparatio conditions of immune-mediated aplastic anemia mouse model. Chin Pharmacol Bull. 2020;36(08):1178–1183.
- Gooptu M, Antin JH. GVHD prophylaxis 2020. Front Immunol. 2021;12:605726.
- Liu C, Shao Z. Aplastic anemia in China. J Transl Int Med. 2018;6(3):134–137.
- Bloom ML, Wolk AG, Simon-Stoos KL, et al. A mouse model of lymphocyte infusion-induced bone marrow failure. Exp Hematol. 2004;32(12):1163–1172.
- McDaniel Mims B, Enriquez J, Pires Dos Santos A, et al. Antibiotic administration exacerbates acute graft vs. host disease-induced bone marrow and spleen damage in lymphopenic mice. PLoS One. 2021;16(8):e0254845.
- Barnes DW, Mole RH. Aplastic anaemia in sublethally irradiated mice given allogeneic lymph node cells. Br J Haematol. 1967;13(4):482–491.
- Gelaw Y, Woldu B, Melku M. The role of reticulocyte hemoglobin content for diagnosis of iron deficiency and iron deficiency anemia, and monitoring of iron therapy: a literature review. Clin Lab. 2019;65(12):2211–2218.
- Bettelli E, Oukka M, Kuchroo VK. T(H)-17 cells in the circle of immunity and autoimmunity. Nat Immunol. 2007;8(4):345–350.
- Sun W, Wu Z, Lin Z, et al. Macrophage TNF-α licenses donor T cells in murine bone marrow failure and can be implicated in human aplastic anemia. Blood. 2018;132(26):2730–2743.
- Mcgeachy MJ, Cua DJ, Gaffen SL. The IL-17 family of cytokines in health and disease. Immunity. 2019;50(4):892–906.
- Gu Y, Hu X, Liu C, et al. Interleukin (IL)-17 promotes macrophages to produce IL-8, IL-6 and tumour necrosis factor-alpha in aplastic anaemia. Br J Haematol. 2008;142(1):109–114.
- Broxmeyer HE, Starnes T, Ramsey H, et al. The IL-17 cytokine family members are inhibitors of human hematopoietic progenitor proliferation. Blood. 2006;108(2):770.
- Zhao J, Chen J, Huang F, et al. Human gingiva tissue-derived MSC ameliorates immune-mediated bone marrow failure of aplastic anemia via suppression of Th1 and Th17 cells and enhancement of CD4 + Foxp3 + regulatory T cells differentiation. Am J Transl Res. 2019;11(12):7627–7643.
- Zhao SS, Zhu XJ, Wu RH. Relationship between the changes of regulatory T cells and Th17 cells and the prognosis of children with aplastic anemia. Zhongguo Shi Yan Xue Ye Xue Za Zhi. 2020;28(5):1674–1678.
- De Latour RP, Visconte V, Takaku T, et al. Th17 immune responses contribute to the pathophysiology of aplastic anemia. Blood. 2010;116(20):4175–4184.
- Killick SB, Bown N, Cavenagh J, et al. Guidelines for the diagnosis and management of adult aplastic anaemia. Br J Haematol. 2016;172(2):187–207.
- Rovó A, Tichelli A, Dufour C. Diagnosis of acquired aplastic anemia. Bone Marrow Transplant. 2013;48(2):162–167.
- Gupta P, Khurana N, Singh T, et al. Bone marrow angiogenesis in aplastic anemia–a study of CD 34 and VEGF expression in bone marrow biopsies. Hematology. 2009;14(1):16–21.
- Huang J, Wang Z, Huang L, et al. CD41 immune staining of micromegakaryocytes improves the diagnosis of myelodysplastic syndrome and differentiation from pancytopenia. Leuk Res. 2018;66:15–19.
- Chen J. Animal models for acquired bone marrow failure syndromes. Clin Med Res. 2005;3(2):102–108.
- Meng A, Wang Y, Van Zant G, et al. Ionizing radiation and busulfan induce premature senescence in murine bone marrow hematopoietic cells. Cancer Res. 2003;63(17):5414–5419.