
Abstract
Objective
To determine the expression level of RAG1 and its clinical significance in myelodysplastic syndromes (MDS).
Methods
To explore the candidate genes, the microarray datasets GSE19429, GSE58831, and GSE2779 were downloaded from the Gene Expression Omnibus database. The differentially expressed genes (DEGs) in MDS were screened using RStudio, and overlapped DEGs were obtained with Venn Diagrams. Gene Ontology and Kyoto Encyclopedia of Genes and Genomes pathway enrichment analyses, and protein–protein interaction network were performed. Quantitative real-time PCR (qRT-PCR) was employed to confirm the microarray results.
Results
This study identified 26 DEGs. Functional enrichment analyses indicated that these DEGs were significantly enriched in the immune response, and hematopoietic cell lineage. Eight core genes, for example, RAG1 and PAX5, were identified with a high degree of connectivity. The result of qRT-PCR showed that RAG1 was significantly down-regulated in MDS patients, which helped in distinguishing MDS patients from normal controls. The area under the curve of the receiver operator characteristic was 0.913 (P < 0.0001). MDS patients with low RAG1 expression level had a poor long-term survival (P = 0.031). What's more, the expression of RAG1 was significantly increased in the patients who received treatment.
Conclusion
The results showed that the expression of RAG1 was down-regulated in MDS patients. Lower RAG1 expression was associated with adverse clinical outcomes. RAG1 may be a potential prognostic biomarker for MDS.
1. Introduction
Myelodysplastic syndromes (MDS) are a kind of malignant heterogeneous clonal hematological diseases originating from bone marrow hematopoietic stem cells, which are characterized by morphological abnormalities of myeloid cells or multiple myeloid cells, ineffective hematopoiesis. There is a high risk of transformation to acute myeloid leukemia (AML)[Citation1, Citation2]. The pathogenesis of MDS is very complex, involving abnormal gene expression, gene mutations, epigenetic abnormalities, defects in immune mechanism, and changes in bone marrow microenvironment[Citation1, Citation3]. With the growth of geriatric population, the incidence of MDS has been increasing, but its clinical treatment is difficult and the cure rate is low. MDS has seriously threatened human health, and there is an urgent need to develop new therapeutic strategies to ameliorate disorders of MDS[Citation4].
The plasticity of the acquired immune system in recognizing millions of possible antigens is largely due to the combinatorial joining of variable (V), diversity (D), and joining (J) gene segments that encode the antigen-binding regions of T cell receptors (TCRs) in T cells and B cell receptors (BCRs) in B cells, and the junctional diversity that can be introduced during the process of V(D)J recombination[Citation5]. RAG1 and RAG2 proteins form a complex and initiate V(D)J recombination by introducing DNA double-strand breaks (DSBs) between the recombination signal sequences and the flanking V, D, or J gene segment. The human RAG1 protein consists of 1,043 amino acids, and the catalytic core (amino acids 387–1011) contains a nonamer-binding domain, a dimerization and DNA binding domain, a pre-RNase H and catalytic RNase H domain, 2 zinc-binding domains, and the carboxy-terminal domain, which are all crucial for V(D)J recombination[Citation6, Citation7].
RAGs also can cleave cryptic RSSs (cRSSs) that are abundant in the genome. Various lines of evidence reveal that RAGs can cleave at non-B DNA structures resulting in cell death or chromosomal translocations and cancer, including leukemia and lymphoma[Citation8]. Gazumyan, et al. reported that DNA breaks caused by RAG1 and activation-induced cytidine deaminase (AID) induce c-myc/immunoglobulin (Ig) heavy chain chromosomal translocations and thereby stimulated mice lymphomagenesis[Citation9]. Mice, lacking the RAG1 protein, showed signs of earlier transformation to acute leukemia and reduced survival rates[Citation10]. Hunter ZR, et al. performed next-generation transcriptional profiling in 57 Waldenström macroglobulinemia (WM) patients, compared with healthy donors, WM patient samples showed greatly enhanced expression of RAG1, its aberrant expression was associated with specific somatic mutation patterns such as deletions in BTG1 and ETV6[Citation11]. Ting Kang, et al. showed that RAG1 was down-regulated in gastric cancer, low RAG1 expression correlated with poor survival of gastric cancer patients[Citation12]. Harriet E Gee, et al. proved that low RAG1 expression significantly correlated with local recurrence of Early Breast Cancer[Citation13]. These studies suggest that RAG1 may play an important role in the occurrence and development of cancer. However, the effects of RAG1 on the treatment and prognosis of MDS patients have not been extensively studied.
In our study, three datasets containing transcriptome sequencing data from 356 MDS patients and 43 healthy controls from the Gene Expression Omnibus (GEO) database, 59 MDS bone marrow (BM) specimens, and 12 BM specimens of patients with MDS who progressed to secondary acute myeloid leukemia (sAML) from our department, were used to explore the diagnosis and prognostic value of RAG1.
2. Materials and methods
2.1. Bioinformatics analysis
2.1.1. GEO database
Gene chip data is downloaded from the GEO database based on GPL570 [HG-U133_Plus_2] gene expression profile chip data set of Affymetrix human genome U133A array platform: GSE19429 and GSE58831. The platform of GSE2779 is GPL96 [HG-U133A] Affymetrix human genome U133A array. These three datasets determined the microarray datasets of the CD34 + cells from MDS patients and normal samples, including 356 MDS patients and 43 healthy controls. All data are freely available online.
2.1.2. Screening and identification of differentially expressed genes (DEGs)
We employed the R package ‘limma’ to identify the significant DEGs between MDS patients and normal samples. We set fold change = 1 and pad j < 0.05 to find differentially expressed genes in MDS patients and normal control samples. The Venn diagram tool helped identify the intersecting part (http://bioinformatics.psb.ugent.be/webtools/Venn/).
2.1.3. Gene Ontology (GO) and Kyoto Encyclopedia of Genes and Genomes (KEGG) pathway enrichment analyses of DEGs
The Database for Annotation, Visualization, and Integrated Discovery (https://david.ncifcrf.gov/, DAVID), as an online biological information database, contributes to the enrichment analysis to investigate DEGs. The GO and KEGG pathway enrichment analyses of DEGs were performed by the database for annotation. The results were considered statistically significant, when the p-values were less than 0.05.
2.1.4. Construction of protein–protein interaction (PPI) network and module analyses
The STRING database was used to build the PPI network specific to DEGs. Cytoscape is a public software program that can graphically display, analyze and edit the network. Cytohubba and MCODE which are plugins in the Cytoscape software (Version 3.9.0), were applied to calculate the degree of every protein node, and modular analysis of PPI networks, respectively.
2.2. BM samples
BM samples were collected from 59 patients with newly diagnosed MDS and 12 patients with MDS who progress to secondary acute myeloid leukemia in the Department of Hematology, The First Affiliated Hospital of Guangxi Medical University, China between 2013 and 2019. MDS patients were diagnosed basis on WHO Recommended Criteria (2008). The International Prognostic Scoring System (IPSS) was used to calculate the prognostic score of every patient. The clinical parameters of MDS patients were shown in . All the participants had been given informed consent according to the Declaration of Helsinki. The study was approved by the Human Ethics Committees Review Board at Guangxi Medical University, Nanning, China (Approval Number: 2022-KY-E-062).
2.3. Quantitative real-time PCR (qRT-PCR)
We separated bone marrow mononuclear cells (BM-MNCs) using density gradient centrifugation. Total RNA was isolated from BM-MNCs by Trizol reagent (Invitrogen, USA) following the manufacturer’s instructions, and the purity of the RNA was assessed spectrophotometrically (A260 nm/A280 nm >1.8). Total RNA was reverse transcribed to cDNA. Human β-actin was used as an internal control and all experiments were repeated at least three times. Relative expression levels were calculated using the 2−△△ct method. The primer sequences were as follows: β-actin forward 5'-GTGGCCGAGGACTTTGATTG-3’ and reverse
5'-CCTGTAACAACGCATCTCATATT-3’, RAG1 forward
5'-AAAGCCATCACAGGGAGACAG-3’ and reverse
5'-CAGCCCATCAATAATGCCAAC-3’,
PAX5 forward 5'- CAGATGCGGGGAGACTTGTTC-3’ and reverse
5'-GATGGGCTCTGTGGTGGTGAA-3’.
2.4. Statistical analysis
All statistical analyses were performed using SPSS (version 25.0; SPSS Inc, Chicago, IL). qRT-PCR validation was based on Mann–Whitney’s U test. Mann–Whitney’s U test and Pearson Chi-square test were used to evaluate the relationship between RAG1 and clinical parameters. Receiver Operator Characteristic (ROC) analysis was used to detect sensitivity, specificity, and the area under the curve (AUC) for RAG1. Survival curves were plotted using the Kaplan–Meier method and compared with log-rank tests. P < 0.05 is considered a significant difference.
3. Results
3.1. Results of bioinformatics analysis
3.1.1. Microarray dataset and DEG identification in MDS
Three microarray datasets, GSE19429, GSE58831, and GSE2779 were selected for our study. Thereinto, the GSE19429 contained 183 MDS samples and 17 normal samples, the GSE58831 dataset included 159 MDS samples and 17 normal samples, and the GSE2779 dataset contained 14 MDS samples and 9 normal samples (). Following the criteria of adjusted P values less than 0.05 and | log2FC | over 1.0, we identified 270 DEGs (78 in GSE19429, 146 in GSE58831, and 46 in GSE2779) in total. Then, the intersection of DEGs were obtained by Venn analysis (). At last, 26 overlapping DEGs were obtained, including PAX5, and RAG1, all of which were significantly down-regulated in MDS.
Figure 1. Venn diagram of DEGs from the 3 GEO datasets. This study identified DEGs with the fold change over 1 and adjusted P-values less than 0.05 within the gene expression profiling sets of GSE19429, GSE58831, and GSE2779, which exhibited the overlap of twenty-six genes.

Table 1. The statistics of the three microarray databases were derived from the GEO database.
3.1.2. GO and KEGG pathway enrichment analyses
The results of the GO and KEGG pathways were analyzed based on 26 overlapping genes. GO term enrichment analysis showed that the main biological processes involved by DEGs in MDS were: immunoglobulin production, immune response, cellular response to cytokine stimulus, chondroitin sulfate biosynthetic process, B cell proliferation, and external side of plasma membrane (). KEGG enrichment analysis demonstrated that these DEGs were significantly enriched in the Hematopoietic cell lineage and Glycosaminoglycan biosynthesis-chondroitin sulfate/dermatan sulfate ().
Table 2. The enriched GO terms of DEGs.
Table 3. The KEGG pathway analysis of DEGs.
3.1.3. Construction of PPI network and analysis of core genes
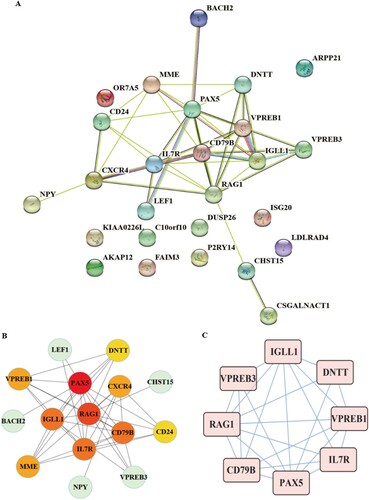
STRING tool used to determine protein interactions between DEGs. The PPI network involved 26 nodes and 42 edges (A). The top 10 hub genes confirmed by the cytohubba plug-in were PAX5, RAG1, CD79B, IGLL1, IL7R, CXCR4, VPREB1, MME, CD24, DNTT (B). The mcode plug-in analyzed the core network (C). The interaction module (Score: 6.571) was composed of 8 nodes and 23 edges, including 8 hub genes such as RAG1, CD79B, PAX5, IGLL1, IL7R, and VPREB1, VPREB3, DNTT, which had high connectivity.
Figure 2. A: The PPI network of DEGs. Colored nodes denote query proteins, edges stand for interactions between proteins, and the line color proves interactions between query proteins. B: Hub gene and its PPI network. C: The network core module was confirmed by mcode.
3.2. Quantitative real-time PCR confirmed the microarray results
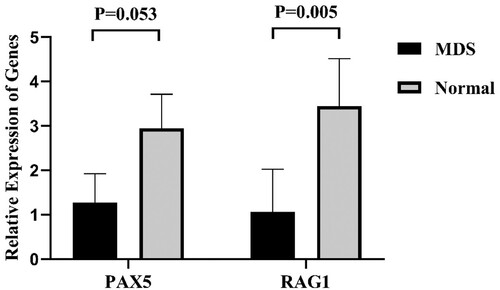
Based on bioinformatics analysis, considering the value of RAG1, PAX5 in MDS remain undefined, we investigated the expression levels of these genes in BM-MNCs in MDS. RAG1 and PAX5 expressions were validated in BM of 20 MDS patients and 10 normal controls using qRT-PCR. As displayed in (), the expression of RAG1 was significantly down-regulated in MDS compared with normal controls. There was no significant difference in the expression levels of PAX5 between patients and normal controls. Next, the authors expanded the sample size, and focused on the analysis of RAG1.
Figure 3. The relative expression levels of PAX5, and RAG1 in MDS patients and normal controls (MDS = 20, Normal = 10).
3.3. RAG1 expression of newly diagnosed MDS patients
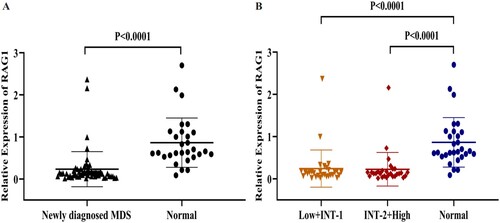
The expression of RAG1 was validated by qRT-PCR in BM from 59 MDS patients and 29 normal controls. As displayed in (), the expression of RAG1 was significantly down-regulated in each group of MDS patients compared with normal controls.
Figure 4. A: The relative expression of RAG1 in MDS patients and normal controls. B: Expression of RAG1 in each group. Normal controls (n = 29), Low + INT-1((low risk + intermediate-1 risk) (n = 31)), INT-2 + High ((intermediate-2 risk + high risk) (n = 28)). Mann–Whitney’s U test was used to compare all the differences in continuous variables between two groups.
3.4. Association RAG1 expression with clinical characteristics of MDS
To analyze the relationship between the expression of RAG1 and MDS clinical features, the 59 MDS patients were divided into two groups according to the median RAG1 expression, in which the patients with RAG1 expression value below the median level (0.128) were divided into the low expression group (n = 30), while the RAG1 level was equal to or above the median level were assigned to the high expression group (n = 29). RAG1 expression and clinical features were summarized in .
Table 4. Comparison of clinical and molecular characteristics with the expression of RAG1 in MDS patients.
To evaluate the value of RAG1 in diagnosis and prognosis of MDS. We used ROC curve analysis to analyze the diagnostic accuracy of RAG1. The AUC for RAG1 was as follows: 0.913 (95% CI 0.846–0.980, P < 0.0001) (A). This result indicated that RAG1 could discriminate MDS patients from normal subjects. To investigate the prognostic implications of RAG1 in MDS, we estimated the relationship between RAG1 and overall survival (OS). Using the Kaplan–Meier analysis, we discovered that the high expression group was significantly different from the low expression group in OS (P = 0.031, (B)), which suggested that RAG1 expression was associated with the survival of MDS patients. Multivariate analysis also showed that low expression of RAG1 was an independent prognostic factor for OS. (P = 0.045, ).
Figure 5. A: ROC analysis using RAG1 for separating MDS cases from normal controls. B: Kaplan-Meier survival curves for MDS patients were divided into two groups based on the median value of the RAG1 expression level.
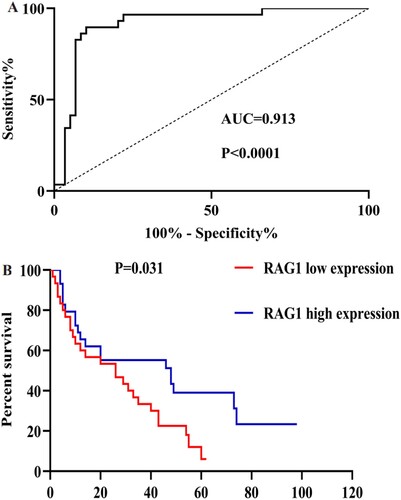
Table 5. Uni/multivariate analysis concerning progression and overall survival.
3.5. The expression of RAG1 in MDS that transformed into AML
To investigate whether the expression of RAG1 was changed during the disease progression of MDS patients, we examined the qRT-PCR result in 59 MDS patients and 12 sAML patients. Our data showed that RAG1 expression level was higher in sAML patients compared to MDS patients, but there was no statistically significant.
3.6. Changes of RAG1 expression in patients with MDS and sAML before and after treatment
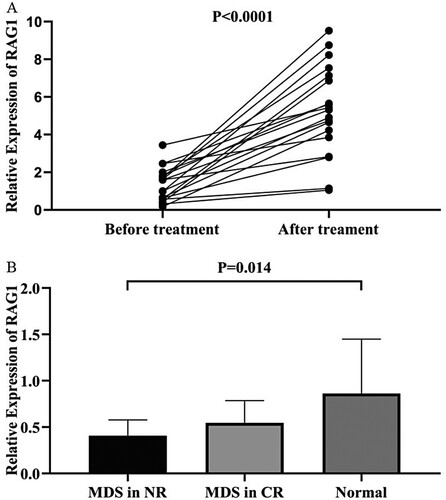
In order to evaluate the dynamic change trend of RAG1 in the progression of MDS disease, we collected bone marrow samples from 19 patients with MDS and 3 patients with sAML, both groups received treatment and had the expression of RAG1 measured again. Compared with the expression of RAG1 before treatment, the results showed that the change of RAG1 expression in patients with MDS after treatment was generally up-regulated (P < 0.0001, (A)). And the change of RAG1 expression in the sAML patients after treatment was down-regulated (P > 0.05). Furthermore, among 14 patients who achieved complete response (CR) after treatment, the expression level of RAG1 has returned to the original level, although it was lower than that of the normal controls, there was no statistical difference (P > 0.05). However, the expression of RAG1 in these patients with non-remission (NR) after treatment were significantly lower than that in normal controls (P = 0.014, (B)). The results revealed that RAG1 expression level in MDS patients was negatively related to the state of the illness of MDS.
Figure 6. A: Changes in RAG1 expression in MDS patients before and after treatment. B: Comparison of RAG1 expression level in MDS patients who received treatment with normal controls.
4. Discussion
V(D)J recombination is an important mechanism by which the immune system recognizes various antigens existing in nature and exerts normal immune function to protect the body. It plays an important role in the formation of the genetic diversity of the immune system. As one of the recombinases, the RAG1 protein participates in this process from the initial stage to ensure the smooth and normal progress of V(D)J recombination[Citation14,Citation15]. The disorder or lack of RAG1 function can cause severe immune function deficiency[Citation16,Citation17] and grow into clinically apparent cancers. In recent years, the role of RAG1 in tumors has attracted attention. For instance, RAG1 plays an important role in hepatocellular carcinoma (HCC) development. Transarterial chemoembolization (TACE) treated HCC patients with low RAG1 expression showed shorter OS compared to the Deletion.Deletion genotype carriers and RAG1 may impact TACE efficiency via regulating antitumor immunity in HCC. RAG1 may be a target to improve therapeutic strategy for unresectable HCC patients[Citation18]. Accumulated evidence suggested that the expression levels of RAG1 vary among different tumors. RAG1 was high expressed in lung cancer and may play an important role in cancer growth and metastasis[Citation19]. RAG1 was up-regulated in adult B-cell acute lymphoblastic leukemia. High expression of RAG1 was observed to be correlated with the high proliferation marker[Citation20]. RAG1 was abnormally high expressed in chronic myelogenous leukemia (CML) from a chronic phase (CP) to a blast crisis of B lymphoid (CML-LBC) and BCR-ABL1 acute lymphoblastic leukemia (BCR-ABL1 ALL). RAG1-mediated recombination in the formation of previously identified and novel oncogenic rearrangement in CML, was associated with poor survival[Citation21,Citation22]. RAG1 inhibited apoptosis through DSB-induced up-regulation of antiapoptotic genes BCL-2, BCL-XL, and MCL-1 and down-regulation of proapoptotic gene BAD expression in BCR-ABL1 cells[Citation22]. Li Juanjuan, et al. reported a rare case of acquired immunodeficiency associated with myelodysplastic syndromes. The results showed that a homozygous RAG1 mutation was detected in his bone marrow and blood, and no other pathogenic driver mutations in MDS-related genes were found[Citation23]. However, the expression of RAG1 and its prognostic value in MDS has been reported rarely.
Myelodysplastic syndromes are hematopoietic stem cell (HSC) disorders defined by myeloid cell dysplasia and ineffective hematopoiesis[Citation4,Citation24,Citation25]. The occurrence and progression of MDS is a multistep pathological process. The precise progressive mechanism of MDS has not been fully elucidated. Microarray technology allows us to detect genetic alterations in MDS and has proven to be an effective method to determine novel indicators of other diseases[Citation26,Citation27]. In the current study, bioinformatics analyses were performed to analyze the role of genetic alterations in the development of MDS[Citation28]. In the present study, we identified, RAG1 as latent core genes for myelodysplastic syndromes by bioinformatics, and determined the expression of RAG1 in the bone marrow of MDS patients. We discovered that RAG1 was markedly down-regulated in MDS patients compared with normal control, after treatment, RAG1 was markedly up-regulated. ROC analysis showed that RAG1 low-expression could distinguish MDS cases from normal controls. Thus, we believe that RAG1 may be a potential biomarker for the accurate diagnosis of MDS. Our preliminary work revealed that compared to patients with high RAG1 expression, patients with low RAG1 expression had a poorer OS.
In addition, we also observed an interesting phenomenon that compared with the newly diagnosed MDS, the expression level of RAG1 in sAML was relatively higher, and a similar phenomenon was found in the early studies of our group, which made us curious. The disadvantage is that our sample size is too small, and we did not measure the expression of RAG1 in primary AML (pAML) patients. In the future, we will expand the sample size and measure the expression of RAG1 in primary AML patients to further explore the expression and clinical significance of RAG1 in MDS, sAML, and pAML.
In conclusion, the results showed that the expression of RAG1 was down-regulated in MDS patients. Lower RAG1 expression in BM samples of MDS patients was associated with adverse OS. RAG1 may be a potential prognostic biomarker for MDS. RAG1 may be a target for improving treatment strategies for MDS patients.
Acknowledgment
This study was supported by grants from the National Natural Science Foundation of China (No. 81560028, 82160039) and the Science Research and Technology Development Project of Qingxiu District of Nanning (No. 2020055).
Disclosure statement
No potential conflict of interest was reported by the author(s).
Additional information
Funding
References
- Yuan Long, Ying Le, Xupai Zhang, et, al. Expression and significance of MiR-486-5p in patients with myelodysplastic syndrome. Chinese Journal of Clinical Research. 2018;31(06):767–9+74.
- Ying Le. Screening and identification of key candidate genes and pathways in myelodysplastic syndrome by bioinformatic analysis. PeerJ. 2019 Nov 29;7:e8162.
- Yanqiu Xiong, Xupai Zhang, Ying Le, et, al. Expression and bioinformatics analysis of microRNA-340-3p in bone marrow of patients with myelodysplastic syndrome. Guangxi Medical Journal. 2017;39(09):1285–7+308.
- Trowbridge JJ, Starczynowski DT. Innate immune pathways and inflammation in hematopoietic aging, clonal hematopoiesis, and MDS. J Exp Med. 2021 Jul 5;218(7):e20201544.
- Notarangelo LD, Kim M-S, Walter JE, et al. Human RAG mutations: biochemistry and clinical implications. Nat Rev Immunol. 2016 Apr;16(4):234–246.
- Min Qing, Meng Xin, Zhou Qinhua, et al. RAG1 splicing mutation causes enhanced B cell differentiation and autoantibody production. Jci Insight. 2021 Oct 8;6(19):e148887.
- Gan Tingting, Wang Yuhong, Liu Yang, et al. RAG2 abolishes RAG1 aggregation to facilitate V(D)J recombination. Cell Rep. 2021 Oct 12;37(2):109824.
- Kumari R, Roy U, Desai S, et al. MicroRNA miR-29c regulates RAG1 expression and modulates V(D)J recombination during B cell development. Cell Rep. 2021 Jul 13;36(2):109390.
- Gazumyan A, Bothmer A, Klein IA, et al. Activation-induced cytidine deaminase in antibody diversification and chromosome translocation. In: Tew KD, Fisher PB, editor. Advances in cancer research, Vol 113. Advances in Cancer Research; 2012. p. 167–190.
- Gough SM, Chung YJ, Aplan PD. Depletion of cytotoxic T-Cells does not protect NUP98-HOXD13 mice from myelodysplastic syndrome but reveals a modest tumor immunosurveillance effect. Plos One. 2012;7(5).
- Hunter ZR, Xu L, Yang G, et al. Transcriptome sequencing reveals a profile that corresponds to genomic variants in Waldenstrom macroglobulinemia. Blood. 2016 Aug 11;128(6):827–38.
- Kang T, Ge M, Wang R, et al. Arsenic sulfide induces RAG1-dependent DNA damage for cell killing by inhibiting NFATc3 in gastric cancer cells. J Exp Clin Cancer Res. 2019 Dec 10;38(1):487.
- Gee HE, Buffa FM, Harris AL, et al. MicroRNA-related DNA repair/cell-cycle genes independently associated with relapse after radiation therapy for early breast cancer. Int J Radiat Oncol Biol Phys. 2015 Dec 1;93(5):1104–14.
- Han Q, Gu Y, Gao Y-Q, et al. Characteristics and clinical significance of RAG1 expression in adult B-cell acute lymphoblastic leukemia. Zhongguo shi yan xue ye xue za zhi. 2019 Jun;27(3):735–740.
- Schatz DG, Swanson PC. V(D)J recombination: Mechanisms of initiation. Annu Rev Genet. 2011;45:167–202.
- Villa A, Sobacchi C, Notarangelo LD, et al. V(D)J recombination defects in lymphocytes due to RAG mutations: severe immunodeficiency with a spectrum of clinical presentations. Blood. 2001 Jan 1;97(1):81–8.
- Kim MS, Lapkouski M, Yang W, et al. Crystal structure of the V(D)J recombinase RAG1-RAG2. Nature. 2015 Feb 26;518(7540):507–11.
- Xu Y, Wang T, Zeng J, et al. Integrative functional genomics implicated the key T-/B-Cell deficiency regulator RAG1 in transarterial chemoembolization of hepatocellular carcinoma. Front Cell Dev Biol. 2021 Sep 27;9:720791.
- Jiang C, Huang T, Wang Y, et al. Immunoglobulin G expression in lung cancer and its effects on metastasis. Plos One. 2014 May 22;9(5):e97359.
- Han Q, Ma J, Gu Y, et al. RAG1 high expression associated with IKZF1 dysfunction in adult B-cell acute lymphoblastic leukemia. J Cancer. 2019 Jun 9;10(16):3842–3850.
- Thomson DW, Shahrin NH, Wang PPS, et al. Aberrant RAG-mediated recombination contributes to multiple structural rearrangements in lymphoid blast crisis of chronic myeloid leukemia. Leukemia. 2020 Aug;34(8):2051–2063.
- Yuan M, Wang Y, Qin M, et al. RAG enhances BCR-ABL1-positive leukemic cell growth through its endonuclease activity in vitro and in vivo. Cancer Sci. 2021 Jul;112(7):2679–2691.
- Li J, Li J, Li J, et al. A rare case of acquired immunodeficiency associated with myelodysplastic syndrome. Mol Genet Genomic Med. 2019 Nov;7(11):e923.
- Cazzola M. Myelodysplastic syndromes. N Engl J Med. 2020 Oct 1;383(14):1358-1374.
- Zhu Y, Wu L. Identification of latent core genes and pathways associated with myelodysplastic syndromes based on integrated bioinformatics analysis. Hematology. 2020 Dec;25(1):299–308.
- Zhao S, Mo X, Wen Z, et al. Comprehensive bioinformatics analysis reveals the hub genes and pathways associated with multiple myeloma. Hematology. 2022 Dec;27(1):280–292.
- Liang X, Yao Y, Li H, et al. Clinical significance of decreased GPX1 expression in patients with acute myeloid leukaemia (Non-M3). Jcpsp-Journal of the College of Physicians and Surgeons Pakistan. 2021 Aug;31(8):941–946.
- Tuerxun N, Wang J, Zhao F, et al. Bioinformatics analysis deciphering the transcriptomic signatures associated with signalling pathways and prognosis in the myelodysplastic syndromes. Hematology. 2022 Dec;27(1):214–231.