
ABSTRACT
Objective
This study attempted to investigate miR-92a-3p expression in peripheral blood of patients with severe β-thalassemia, and the effect and action mechanism of miR-92a-3p on γ-globin expression and oxidative stress in erythroid precursor cells.
Methods
CD34+ hematopoietic progenitor cells (HPCs) were isolated from peripheral blood of healthy volunteers and patients with severe β-thalassemia. The levels of miR-92a-3p, BCL11A, and γ-globin were measured in erythroid precursor cells. High-performance liquid chromatography (HPLC) was used to analyze hemoglobin F (HbF) content. HPCs were induced with erythroid differentiation and erythroid precursor cells were then obtained. The relevance between miR-92a-3p and BCL11A was studied using dual luciferase reporter gene assay, and the correlation between miR-92a-3p and HbF was assayed by Pearson correlation analysis. Reactive oxygen species (ROS), glutathione (GSH), malondialdehyde (MDA), and superoxide dismutase (SOD) in erythroid precursor cells were tested to evaluate oxidative stress. Cell apoptosis was examined by flow cytometry.
Results
Remarkably higher expression of miR-92a-3p was observed in erythroid precursor cells. Increased expression of miR-92a-3p resulted in elevated levels of γ-globin, GSH, and SOD, reduced expression of ROS and MDA, and decreased cell apoptosis. BCL11A was identified as a target of miR-92a-3p and to be downregulated by miR-92a-3p. Moreover, BCL11A knockdown alone increased the expression of γ-globin, SOD and GSH, and repressed the levels of ROS and MDA and cell apoptosis, and the following inhibition of miR-92a-3p changed these patterns.
Conclusions
Our data indicated that miR-92a-3p might increase γ-globin level and reduce oxidative stress and apoptosis in erythroid precursor cells by downregulating BCL11A.
Introduction
Beta-thalassemia is one of the commonest forms of severe thalassemia prevailing in many Asian countries [Citation1]. Beta-thalassemia is caused by impaired production of β-globin chain and accumulation of unpaired α-globin chain, contributing to destruction of erythrocytes and iron overload [Citation2]. Oxidative stress mainly caused by iron overload aggravates organ damage in β-thalassemia [Citation3,Citation4]. The severity of β-thalassemia can be ameliorated through increasing fetal hemoglobin (HbF) which contains γ-globin, a sort of HbF mainly expressed in the fetus with the function of carrying oxygen [Citation5]. In β-thalassemia, increased γ-globin expression regulates the balance of α- and β-globin chains and improves β-thalassemia symptoms [Citation6]. Treatments that contributed to HbF induction were demonstrated to reduce cellular oxidative stress [Citation7]. Activation of HbF expression becomes a feasible therapeutic strategy, with its specific molecular mechanisms being research hotspots [Citation8].
Expression of γ-globin gene is regulated by a variety of cis- and trans- transcription factors [Citation9,Citation10]. The zinc-finger transcriptional factor BCL11A has been shown to silence HbF expression in erythrocytes as a transcription suppressant [Citation11,Citation12]. BCL11A activity is as well controlled by various factors such as microRNAs (miRs) through complementary base pairing [Citation13]. MiRs are a category of small noncoding RNA that inhibits protein production by binding specific target mRNAs and plays an important role in erythropoiesis [Citation14]. Some of them possess the capacity of regulating γ-globin gene expression [Citation15–17]. For instance, miR-17-92 cluster significantly increased γ-globin expression in patients with β-thalassemia [Citation18]. MiR-17-92 is a highly conserved gene cluster, which mainly consists of 6 members, including miR-17, miR-18a, miR-19a, miR-20a, miR-19b-1, and miR-92a [Citation19]. Li et al. previously believed that miR-92a overexpression could induce HPCs to differentiate into erythroid lineage [Citation20]. However, the exact role of miR-92a-3p in β-thalassemia is still unknown. Prior studies have noted that miR-92a-3p was associated with oxidative stress in the course of many diseases, which suggested correlation between miR-92a-3p and the regulation of oxidative stress tolerance [Citation21–23].
In the current study, a target site between miR-92a-3p and BCL11A was predicted using a bioinformatics method. Therefore, this study speculated that miR-92a-3p increased γ-globin expression and inhibited oxidative stress and apoptosis of erythroid precursor cells by downregulating BCL11A. The discovery of this research provided a new insight into opportunities to induce γ-globin and novel approaches for the treatment of β-thalassemia.
Materials and methods
Clinical samples
Peripheral blood samples from fifteen healthy volunteers and twenty patients with severe β-thalassemia were obtained respectively in physical examination clinic and hematology department, Huizhou First Maternal and Child Health Care Hospital. All participants did not receive splenectomy, and did not undergo blood transfusion and hydroxyurea therapy one month before the blood collection. A total of 4 mL blood was extracted from every subject in the morning fasting state. This study obtained written informed consent from all participants (or their guardians) and approval of the Ethics Committee of Huizhou First Maternal and Child Health Care Hospital (No. 20220511 [C1]). The study was conducted in strict compliance with the World Medical Association Declaration of Helsinki.
Isolation of hematopoietic progenitor cells (HPCs)
According to previous studies [Citation24,Citation25], mononuclear cells was extracted from peripheral blood by using Ficoll-Hypaque density gradient, and CD34+ HPCs were purified by CD34 + magnetic beads from the suspension of blood mononuclear cells. The purity of CD34+ HPCs was detected by flow cytometry.
The erythroid differentiation of HPCs
CD34+ HPCs were cultured in StemLine Ⅱ (Sigma-Aldrich) medium containing human serum albumin, insulin, and transferrin at a density of 2 × 10⁵ cells/mL, and the medium was supplemented with 20 ng/mL stem cell factor (SCF; PeproTech, Rocky Hill, NJ, U.S.A.), 10 ng/mL interlukin-3 (IL-3; PeproTech, Rocky Hill, NJ, U.S.A.), and 3 U/mL erythropoietin (Epo, Amgen Thousand Oaks, CA, U.S.A.) to induce erythroid differentiation. The expression of CD71 and CD235a was determined by flow cytometry to evaluate cell differentiation on the fourteen day of differentiation induction.
High-performance liquid chromatography (HPLC) of HbF
Automatic hemoglobin analyzer was used to evaluate 0.5 ML anticoagulant blood, and quantitative results were automatically given by the machine.
Cell transfection
MiR-92a-3p mimic (forward: TATTGCACTTGTCCCGGCCTGT, reverse: ACAGGCCGGGACAAGTGCAATA) (50, 100 nM), negative control mimic (NC mimic), miR-92a-3p inhibitor (ACAGGCCGGGACAAGTGCAATA) (50, 100 nM), NC inhibitor, lentiviral short hairpin RNA against BCL11A (final siRNA sequence: ACCCAGAGAGCTCAAGATGTG) (sh-BCL11A, 20 μL), and sh-NC (all from GenePharma, Shanghai, China) were labeled with green fluorescent protein (GFP) and transfected into erythroid precursor cells in logarithmic growth phase. MiR-92a-3p mimic and inhibitor were transduced with Lipofectamine 2000 reagent (Invitrogen, Carlsbad, CA, U.S.A.), and lentivirus was directly transfected. The cells were obtained 48 h after transfection.
Quantitative real-time polymerase chain reaction (qRT-PCR)
Total RNA was extracted using TRIzol (Invitrogen, Carlsbad, CA, U.S.A.) and converted to cDNA with a reverse transcription kit (TaKaRa, Tokyo, Japan). Gene expression was measured by a Roche LightCycler 480 (Roche, Indianapolis, IN, U.S.A.) fluorescence quantitative PCR instrument. Amplification was performed with the following protocols: 95°C for 10 s, 45 cycles of denaturation at 95°C for 5 s, annealing at 60°C for 10 s, and extending at 72°C for 10 s, and finally extending at 72°C for 5 min. Each experiment was run in triplicate. U6 was the internal reference gene of miRNAs, and β-actin was the internal reference of BCL11A. Date analysis was carried out using the method of 2-ΔΔCt in which ΔΔCt equaled to (Ct target gene − Ct reference gene) experimental group − (Ct target gene − Ct reference gene) control group. Primer sequences are available in .
Table 1. Primer sequences.
Western blot
Total protein was obtained from cells by RIPA lysis buffer (Beyotime) and measured by a BCA kit (Beyotime). The isolated protein was subjected to sodium dodecyl sulfate polyacrylamide gel electrophoresis (SDS-PAGE) and transferred onto a polyvinylidene fluoride membrane (Millipore, Billerica, MA, U.S.A.) in an ice bath at 300 mA for 60 min. The membrane was probed using primary antibodies [β-actin (ab8227, 1:2500; Abcam, Cambridge, MA, U.S.A.), BCL11A (ab191401, 1:20000; Abcam, Cambridge, MA, U.S.A.), γ-globin (sc-21756, 1:1000; Santa Cruz, Shanghai, China), and β-globin (sc-21757, 1:1000; Santa Cruz, Shanghai, China)] on a shaker. Second antibody (IgG, 1:5000, Beijing ComWin Biotech Co., Ltd., Beijing, China) was added to the membranes for 2-h incubation. After development with electrochemiluminescence (ECL), the bands for western blot were analyzed by a chemiluminescence imaging system (Bio-rad). The experiments were repeated independently 3 times.
Detection of reactive oxygen species (ROS)
The level of ROS was detected by 2, 7-dichlorodihydrofluorescein diacetate (DCFH-DA). A total of 100 μL single cell suspension was incubated in 96-well plates for 24 h (37°C, 5% CO2), followed by incubation with 10 μM DCFH-DA probe (Merck, Shanghai, China) at 37°C for 30 min. After 3 times washing of phosphate buffered saline (PBS), the fluorescence intensity of 2, 7-dichlorofluorescein (DCF) in cells was analyzed by flow cytometry (BD FACSCaliburTM, BD Bioscience) and the mean fluorescence intensity (MFI) was calculated by CellQuest software. Each assay was repeated three times.
Measurement of malondialdehyde (MDA)
MDA was detected by colorimetry using a Lipid Peroxidation MDA Assay Kit (Beyotime, China). MDA was reacted with thiobarbituric acid (TBA) to form MDA-TBA complex under acidic and high temperature conditions and measured with a spectrophotometer at 532 nm after cooling. Each experiment was run in triplicate.
Test of superoxide dismutase (SOD)
SOD was tested using testing kits (Sigma-Aldrich; Merck KGaA, Darmstadt, Germany) following the instructions scrupulously. Data were obtained from three independent experiments.
Determination of glutathione (GSH)
Cells were incubated with 2 mM fresh H2O2 for 1 h and 40 μM of mercury orange solution for 3 min. After washing and resuspension, GSH level in the cells were determined using flow cytometry (BD FACSCaliburTM, BD Bioscience) and MFI was calculated by CellQuest soft. Each assay was run in triplicate.
Evaluation of cell apoptosis
The cell density of each group was adjusted to 105 cells/mL. Cell suspension of each sample (3 mL) was collected into a 10-mL centrifuge tube and centrifuged (500 rpm) for 5 min. The culture medium was discarded. After PBS washing and centrifugation (500 rpm, 5 min), the supernatant was removed and the cells were re-suspended with 100 μL binding buffer. Annexin V-FITC (5 μL) and PI (5 μL) were added, mixed gently, and reacted with the cells in the dark at room temperature for 15 min. FITC and PI intensities were detected by flow cytometry to analyze the apoptosis rate. Each assay was repeated three times.
Cell marker verification
Collected cell suspension was centrifuged with the supernatant being discarded. After washing with PBS, the cells were re-suspended with 100 μL PBS containing 2% FBS and then incubated with FITC-labeled antibodies [CD34 (4 µg/106 cells, ab18227), CD71 (20 µg/106 cells, ab239251), and CD235a (4 µg/106 cells, ab233580), Abcam, Cambridge, MA, U.S.A.] and their isotype control in the dark for 30 min. After that, the cells were washed and re-suspended. Flow cytometry (BD FACSCaliburTM, BD Bioscience) was used to test the expression of target genes, and data obtained from three independent tests were analyzed by CellQuest software.
Dual luciferase reporter gene assay
An online tool starBase (http://starbase.sysu.edu.cn/) was used to identify the binding site between miR-92a-3p and BCL11A. The wild and mutant sequences (wt-BCL11A and mut-BCL11A) of the binding sites were designed according to the prediction. The synthesized sequences were inserted into the luciferase reporter vectors pGL3-Promoter (Promega, Madison, WI, U.S.A.), and co-transfected with miR-92a-3p mimic (30 nM), NC-mimic, or pRL-TK (Promega) into HEK293T cells. Forty-eight hours later, luciferase activity was determined with a luciferase assay kit (Promega). Firefly luciferase activity was measured after the addition of 100 μL luciferase assay reagent and Renilla luciferase activity was evaluated after the addition of 100 μL stop & Glo® reagent. The ratio of Firefly luciferase activity to Renilla luciferase activity was considered as the relative luciferase activity (Renilla luciferase activity was served as the internal control). Three replicates were set for the experiment.
Argonaute 2-RNA binding protein immunoprecipitation (AGO2-RIP)
The cells were collected, washed twice with pre-cooled PBS, centrifuged at 1,500 rpm for 5 min, and mixed with the same volume of RIP lysis buffer. Magnetic beads was suspended with 100 μL RIP wash buffer and incubated with 5 μg AGO2 antibody (ab32381, 1:100, Abcam, Cambridge, MA, U.S.A.) at room temperature for 30 min, and IgG antibody was used as the negative control. The centrifuge tube was placed on a magnetic rack, and the supernatant was discarded. The tube was then washed twice with 500 μL RIP wash buffer by vortex shaking. The bead-antibody complex was suspended in 500 μL RIP wash buffer and placed on ice. The prepared magnetic bead-antibody complex was placed on the magnetic rack to remove the supernatant and 900 μL RIP immunoprecipitation buffer was added to each tube. The cell lysate was thawed and centrifuged at 14,000 rpm, 4°C for 10 min, and 100 μL cell supernatant was pipetted into the magnetic bead-antibody complex. The mixture was incubated at 4°C overnight and centrifuged briefly. After removing the supernatant on the magnetic rack, the tube was washed 6 times with 500 μL RIP wash buffer. Then the magnetic beads-antibody-RNA complexes were re-suspended with 150 μL Proteinase K Buffer at 55°C for 30-min incubation. The supernatant was collected on the magnetic rack for RNA extract. The expression of miR-92a-3p and BCL11A was examined by qRT-PCR. Each experiment was run in triplicate.
Statistical analysis
All experimental data were presented as mean ± standard deviation and analyzed using GraphPad prism7 software. Statistical differences between two groups were analyzed using t test and those among multiple groups were evaluated using one-way analysis of variance test. Pearson correlation analysis was used to detect the correlation between miR-92a-3p and BCL11A. When P value was < 0.05, statistical differences were considered significant.
Results
High expression of miR-92a-3p in erythroid precursor cells
We enrolled 20 patients with severe β-thalassemia and 15 healthy volunteers as controls. There were no significant differences in age and sex between the two groups. The hemoglobin level was significantly lower and HbF was significantly higher in patients with severe β-thalassemia than in normal subjects (). To evaluate the differentially expressed miRs in patients with severe β-thalassemia, HPCs were firstly isolated from the collected blood samples using the Ficoll-Hypaque density gradient method. Flow cytometry analysis indicated that the purity of CD34+ HPCs obtained from blood samples was 98% (A). CD71 is a transferrin receptor which is highly expressed in the early stage of erythroid differentiation, and CD235a is a surface marker of mature erythroid cells whose expression is increased with the maturation of erythroblasts. The expression of CD71 and CD235a in cells on the 14th day of differentiation was 63.5% and 90.5%, respectively (B,C). The above results indicated the successful induction of erythroid differentiation of HPCs to erythroid precursor cells.
Figure 1. MiR-92a-3p is upregulated in erythroid precursor cells from patients with β-thalassemia. (A) the purity of CD34 + cells was detected by flow cytometry; (B-C) the expression of CD71 and CD235a in erythroid precursor cells on the 14th day of differentiation induction was measured by flow cytometry; (D-I) the expression of miR-17, miR-18a, miR-19a, miR-20a, miR-19b-1, and miR-92a-3p was examined by qRT-PCR test; (J) miR-92a-3p expression was tested by qRT-PCR on the 0, 7th and 14th day of erythroid differentiation of HPCs from β-thalassemia patients. (K) the correlation between miR-92a-3p and HbF was measured by Pearson correlation analysis. **P < 0.01, ***P < 0.001. Normal group, n = 15; beta thalassemia group, n = 20. Each experiment was repeated three times. All data were shown in form of mean ± standard deviation and error bars represent standard deviation. qRT-PCR, quantitative real-time polymerase chain reaction; HbF, hemoglobin F.
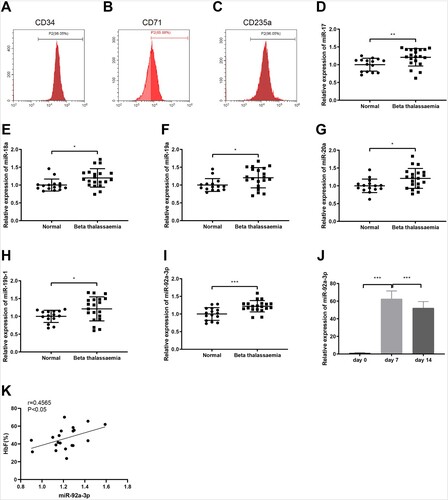
Table 2. Clinical information.
Furthermore, results from qRT-PCR showed that the expression of miR-17, miR-18a, miR-19a, miR-20a, miR-19b-1, and miR-92a-3p was observably increased in the erythroid precursor cells from patients with severe β-thalassemia, among which miR-92a-3p showed a more significant change (D-I, P < 0.05). To investigate whether miR-92a-3p was differentially expressed during the erythroid differentiation of HPCs, we first detected miR-92a-3p expression by qRT-PCR on the 0, 7th and 14th day of erythroid differentiation of HPCs from β-thalassemia patients. The results manifested that miR-92a-3p was strongly expressed during erythroid differentiation (J, P < 0.001). Pearson correlation analysis showed that miR-92a-3p was positively correlated with HbF in patients with β-thalassemia (r = 0.4565; K, P < 0.05). These findings suggested that miR-92a-3p and HbF were increasingly expressed in patients with β-thalassemia, and they were positively correlated.
MiR-92a-3p augments γ-globin and inhibits oxidative stress in erythroid precursor cells
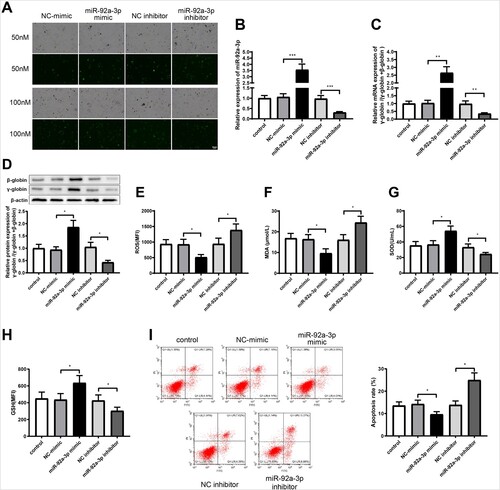
To further explore the effect of miR-92a-3p on the expression of γ-globin and oxidative stress in erythroid precursor cells, different doses of miR-92a-3p mimic, miR-92a-3p inhibitor or their negative controls (NC-mimic or NC-inhibitor) were transfected into erythroid precursor cells. The transfection efficiency of the mimic and inhibitor at the dose of 50 nM was 83% and that at 100 nM was 85% (A). There was no obvious difference in the transfection efficiency of the mimic and inhibitor at 50 and 100 nM, and thus miR-92a-3p mimic and inhibitor at a dose of 50 nM were finally used for transfection. Shown by qRT-PCR assay, miR-92a-3p level in the miR-92a-3p mimic group was significantly higher than in the NC-mimic group, and downregulated in the miR-92a-3p inhibitor group compared with that in the NC-inhibitor group (B, P < 0.001). Next, qRT-PCR and western blot results showed that γ-globin/(γ-globin + β-globin) expression in the miR-92a-3p mimic group was remarkably higher than in NC-mimic group and decreased in the miR-92a-3p inhibitor group than in the NC-inhibitor group (C,D, P < 0.05). In order to further verify the effect of miR-92a-3p on cellular oxidative stress, the levels of ROS, MDA, SOD, and GSH were detected. The results showed that ROS and MDA contents were decreased (E,F, P < 0.05) and SOD and GSH were increased (G,H, P < 0.05) in the miR-92a-3p mimic group compared with those in the NC-mimic group. Compared with the NC-inhibitor group, the miR-92a-3p inhibitor group showed elevated ROS and MDA levels as well as reduced SOD and GSH levels (E,H, P < 0.05). Flow cytometry showed that cell apoptosis was reduced obviously in miR-92a-3p mimic group compared with that in the NC-mimic group and enhanced in the miR-92a-3p inhibitor group in contrast to NC-inhibitor group (I, P < 0.05). The above results demonstrated that miR-92a-3p overexpression elevated the expression of γ-globin, reduced oxidative stress, and restrained apoptosis in erythroid precursor cells.
Figure 2. MiR-92a-3p increases γ-globin expression and restrains oxidative stress in erythroid precursor cells. (A) transfection efficiency of miR-92a-3p mimic and inhibitor; (B) qRT-PCR experiment was used to measure miR-92a-3p expression; (C-D) the expression of γ-globin/(γ-globin + β-globin) was detected by qRT-PCR and western blot tests; (E) ROS level was measured by flow cytometry; (F) MDA content was assayed with the colorimetric method; (G) SOD content was tested by a SOD kit; (H) GSH level was detected by flow cytometry; (I) cell apoptosis was evaluated by flow cytometry, *P < 0.05, **P < 0.01, ***P < 0.001. Each experiment was repeated three times. All data were shown in form of mean ± standard deviation and error bars represent standard deviation. PI: Annexin FACS: Q1-UL: necrotic cells; Q1-UR: late apoptotic cells; Q1-LR: early apoptotic cells; Q1-LL: living cells. ROS, reactive oxygen species; MDA, malondialdehyde; SOD, superoxide dismutase; GSH, glutathione; qRT-PCR, quantitative real-time polymerase chain reaction.
MiR-92a-3p downregulates BCL11A
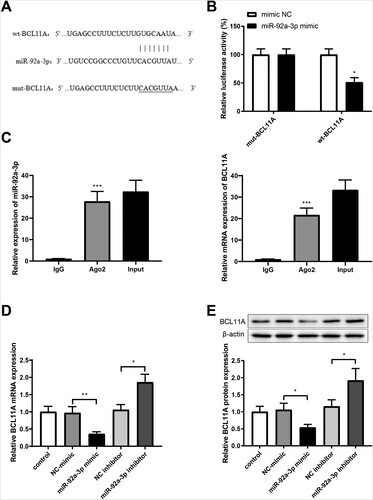
(A) showed the binding site of miR-92a-3p in the 3’-UTR of BCL11A, predicted by starBase (http://starbase.sysu.edu.cn/). Furthermore, it was confirmed that γ-globin was negatively related with BCL11A [Citation26]. Dual luciferase reporter gene assay showed no substantial difference in luciferase activity between the miR-92a-3p mimic+mut-BCL11A group and NC-mimic+ mut-BCL11A group, and suppressed luciferase activity in the miR-92a-3p mimic+ wt-BCL11A group compared to that in the NC-mimic+ wt-BCL11A group (B, P < 0.05). AGO2 is a component of the mRNA-mediated silencing complex (RISC), which has an important influence on miRNA binding to target genes [Citation27]. Therefore, RIP assay with AGO2 antibody was used to further verify the binding of miR-92a-3p to BCL11A. Expression of miR-92a-3p and BCL11A can be detected in the AGO2 group but not in the IgG group (C, P < 0.001). After erythroid precursor cells were transfected with miR-92a-3p mimic or inhibitor, miR-92a-3p mimic group had lower BCL11A expression (vs. NC-mimic group) and miR-92a-3p inhibitor group had higher BCL11A (vs. NC inhibitor group) (D,E, P < 0.05). Overall, miR-92a-3p could negatively regulate BCL11A expression in erythroid precursor cells.
Figure 3. MiR-92a-3p downregulates BCL11A expression. (A) The wild and mutant sequences of the binding site of miR-92a-3p to BCL11A; (B) dual luciferase reporter gene assay for verifying the binding between miR-92a-3p and BCL11A; (C) AGO2-RIP was used to test the binding of miR-92a-3p to BCL11A; after the cells were transfected with miR-92a-3p mimic or miR-92a-3p inhibitor, (D-E) qRT-PCR and western blot tests were used to examine BCL11A expression. *P < 0.05, **P < 0.01, ***P < 0.001. Each experiment was repeated three times. All data were expressed as mean ± standard deviation and error bars represent standard deviation. AGO2-RIP, argonaute 2-RNA binding protein immunoprecipitation; qRT-PCR, quantitative real-time polymerase chain reaction.
MiR-92a-3p upregulates γ-globin and inhibits oxidative stress in erythroid precursor cells by inhibiting BCL11A
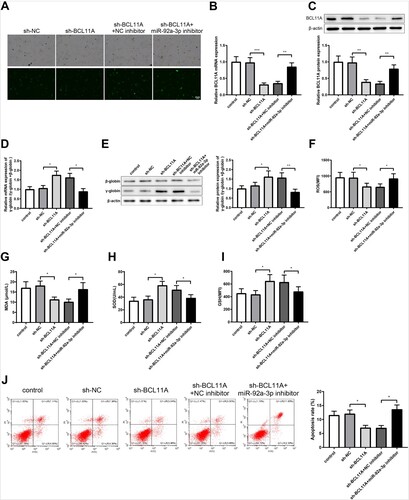
In order to investigate whether miR-92a-3p could affect γ-globin and oxidative stress in erythroid precursor cells by regulating BCL11A expression, the erythroid precursor cells were transfected with sh-BCL11A alone or co-transfected with sh-BCL11A and miR-92a-3p inhibitor. The transfection efficiency was verified (A). Next, the expression levels of BCL11A and γ-globin/(γ-globin + β-globin) were detected by qRT-PCR and western blot assays. The results showed that BCL11A expression was conspicuously lower in the sh-BCL11A group than in the sh-NC group and augmented in sh-BCL11A + miR-92a-3p inhibitor group versus sh-BCL11A + NC inhibitor group (B,C, P < 0.01). As expected, γ-globin/(γ-globin + β-globin) expression was increased in the sh-BCL11A group than in the sh-NC group and decreased in sh-BCL11A + miR-92a-3p inhibitor group versus sh-BCL11A + NC inhibitor group (D,E, P < 0.05). The oxidative stress was evaluated according to ROS, MDA, SOD and GSH levels in each group. ROS and MDA levels were downregulated in the sh-BCL11A group compared to those in the sh-NC group while enhancing in the sh-BCL11A + miR-92a-3p inhibitor group than in the sh-BCL11A + NC inhibitor group, and SOD and GSH levels were elevated in response to sh-BCL11A transfection alone and declined after co-transfection with miR-92a-3p inhibitor and sh-BCL11A (F-I, P < 0.05). Cell apoptosis was reduced in the sh-BCL11A group and aggravated in the sh-BCL11A + miR-92a-3p inhibitor group (J, P < 0.05). The above results showed that miR-92a-3p upregulated γ-globin and reduced oxidative stress and apoptosis in erythroid precursor cells by inhibiting BCL11A.
Figure 4. MiR-92a-3p upregulates γ-globin and reduces oxidative stress in erythroid precursor cells by downregulating BCL11A. (A) transfection efficiency of sh-BCL11A; (B-E) qRT-PCR and western blot tests were used to examine the expression of BCL11A and γ-globin/(γ-globin + β-globin) in erythroid precursor cells; (F) ROS level was measured by flow cytometry; (G) MDA content was detected by the colorimetric method; (H) SOD level was tested using a SOD kit; (I) flow cytometry was applied to measure GSH content; (J) cell apoptosis was detected by flow cytometry. *P < 0.05, **P < 0.01, ***P < 0.001. Each experiment was repeated three times. All data were expressed as mean ± standard deviation and error bars represent standard deviation. PI:Annexin FACS: Q1-UL: necrotic cells; Q1-UR: late apoptotic cells; Q1-LR: early apoptotic cells; Q1-LL: living cells. ROS, reactive oxygen species; MDA, malondialdehyde; SOD, superoxide dismutase; GSH, glutathione; qRT-PCR, quantitative real-time polymerase chain reaction.
Discussion
Thalassemia is an inherited and epidemic disease aggravating the health burden of Asian countries [Citation1]. As an important pathogenesis of thalassemia, oxidative damage in erythrocytes could be irritated by iron overload which is caused by the imbalance of globin chain [Citation28,Citation29]. It has been established that increasing HbF level could prevent β-thalassemic symptoms [Citation30]. In addition, it is generally accepted that BCL11A depresses γ-globin expression [Citation31]. The aim of this study was to clarify the role of miR-92a-3p in γ-globin generation and the relevance of miR-92a-3p and BCL11A. Our finding suggested that miR-92a-3p upregulated γ-globin expression, decreased oxidative stress, and reduced cell apoptosis in erythroid precursor cells.
First of all, our evidence suggested that miR-92a-3p was involved in the regulation of γ-globin expression, oxidative stress, and apoptosis in β-thalassemic erythroid precursor cells. It was observed that miR-92a-3p expression level was increased in erythroid precursor cells from patients with severe β-thalassemia compare with healthy subjects, and miR-92a-3p expression was positively correlated to HbF in patients with β-thalassemia. Increasing evidence discovered the physiologic role of miRs in regulating γ-globin expression, such as miR-144, miR-326 and miR-2355-5p [Citation15,Citation32,Citation33]. Herein, we further reported that overexpressing miR-92a-3p could promote γ-globin gene level in β-thalassemic erythroid precursor cells, and consistently, down-regulating miR-92a-3p restrained the expression of γ-globin. This study could add to the literature on the regulation of γ-globin by miR-92a-3p. Abnormal ROS accumulation reflects oxidative stress in erythrocytes and is related to the morphologic changes of erythrocytes in patients with thalassemia [Citation34]. In the pathophysiology of thalassemia, apoptosis is also a metabolic pathway triggered by ROS [Citation35]. Previously, miR-92a-3p was believed to augment low-density lipoprotein-induced apoptosis and oxidative stress in human umbilical vein endothelial cells [Citation36]. miR-92a-3p is observed to be downregulated after resistance exercise intervention in rats suffering from catheter-related thrombosis, together with decreased ROS production and MDA activity [Citation37]. These observations indicate the correlation between miR-92a-3p and oxidative stress injury. In this study, miR-92a-3p overexpression was firstly demonstrated to reduce oxidative stress and apoptosis in erythroid precursor cells.
BCL11A is a transcriptional repressor of γ-globin gene, and disrupting BCL11A binding is capable of raising γ-globin gene expression in mouse erythrocytes [Citation38]. In the present work, BCL11A knockdown led to an accumulation of γ-globin. Functional experiments also proved that inhibition of BCL11A repressed oxidative stress and apoptosis in erythroid precursor cells. Midbrain dopaminergic neurons expressing BCL11A is prone to neurodegeneration in response to oxidative stress [Citation39], indicating the impact of BCL11A on oxidative stress. To the best of our knowledge, it is the first evidence demonstrating the influence of BCL11A on oxidative stress in β-thalassemia. Several studies indicated that miRs could play a role in γ-globin synthesis via inhibiting BCL11A expression. For instance, elevated miR-30a in erythroid precursors from patients with β-thalassemia induces γ-globin expression through inhibiting BCL11A expression [Citation40]. miR-210 was involved in erythroid differentiation and γ-globin gene upregulation by downregulating BCL11A mRNA [Citation41]. Through bioinformatics prediction, BCL11A was considered a target gene of miR-92a-3p, which was further confirmed by luciferase reporter assay and AGO2-RIP assay. Pearson correlation analysis and gain- and loss-of-function experiments substantiated the negative correlation between miR-92a-3p and BCL11A levels. More importantly, inhibiting both miR-92a-3p and BCL11A in β-thalassemic erythroid precursor cells elevated ROS and MDA levels and suppressed SOD and GSH levels, along with increased erythrocyte apoptosis, in contrast to BCL11A knockdown alone. Therefore, it could be confirmed that miR-92a-3p enhanced γ-globin expression and reduced oxidative stress in erythroid precursor cells through inhibiting BCL11A mRNA.
In conclusion, our findings suggested a potential role of miR-92a-3p in regulation of γ-globin expression and verified the interaction between miR-92a-3p and BCL11A, indicating a novel strategy for treatment of β-thalassemia by mimicking miR-92a-3p functions. Extensive animal experiments are urgently expected to further identify the functions of miR-92a-3p/BCL11A axis in vivo for advancing the clinical management of β-thalassemia.
Acknowledgement
The instructor has strict requirements for the topic selection, writing, and final draft of the thesis. Without the efforts and guidance of the instructor, this paper would not be finished, and my results could not have been achieved. The rigorous attitude of the instructor towards academics deeply touched me. On this occasion, I would like to express my gratitude to my instructor. I will always remember the instructor's sincere teachings. At the same time, during this process, I made many lovely friends who have helped me a lot academically and will be my partners along the way in the future.
Disclosure statement
No potential conflict of interest was reported by the author(s).
References
- Weatherall DJ. The evolving spectrum of the epidemiology of thalassemia. Hematol Oncol Clin North Am. 2018;32:165–175.
- Sahin A, Er EO, Oz E, et al. Sodium, magnesium, calcium, manganese, iron, copper, and zinc in serums of beta thalassemia major patients. Biol Trace Elem Res. 2021;199:888–894.
- El-Tagui MH, Salama KM, El-Sabbagh MH, et al. Polyneuropathy associated with severe iron overload and oxidative stress in beta-thalassemia patients. Indian J Hematol Blood Transfus. 2019;35:518–522.
- Mirlohi MS, Yaghooti H, Shirali S, et al. Increased levels of advanced glycation end products positively correlate with iron overload and oxidative stress markers in patients with beta-thalassemia major. Ann Hematol. 2018;97:679–684.
- Wienert B, Martyn GE, Funnell APW, et al. Wake-up sleepy gene: reactivating fetal globin for beta-hemoglobinopathies. Trends Genet. 2018;34:927–940.
- Liu N, Hargreaves VV, Zhu Q, et al. Direct promoter repression by BCL11A controls the fetal to adult hemoglobin switch. Cell. 2018;173:430–442.
- Pullarkat V, Meng Z, Tahara SM, et al. Proteasome inhibition induces both antioxidant and hb f responses in sickle cell disease via the nrf2 pathway. Hemoglobin. 2014;38:188–195.
- Dulmovits BM, Appiah-Kubi AO, Papoin J, et al. Pomalidomide reverses gamma-globin silencing through the transcriptional reprogramming of adult hematopoietic progenitors. Blood. 2016;127:1481–1492.
- Grevet JD, Lan X, Hamagami N, et al. Domain-focused CRISPR screen identifies HRI as a fetal hemoglobin regulator in human erythroid cells. Science. 2018;361:285–290.
- Yu X, Azzo A, Bilinovich SM, et al. Disruption of the MBD2-NuRD complex but not MBD3-NuRD induces high level HbF expression in human adult erythroid cells. Haematologica. 2019;104:2361–2371.
- Bjurstrom CF, Mojadidi M, Phillips J, et al. Reactivating fetal hemoglobin expression in human adult erythroblasts through BCL11A knockdown using targeted endonucleases. Mol Ther Nucleic Acids. 2016;5:e351.
- Chang KH, Smith SE, Sullivan T, et al. Long-Term engraftment and fetal globin induction upon BCL11A gene editing in bone-marrow-derived CD34(+) hematopoietic stem and progenitor cells. Mol Ther Methods Clin Dev. 2017;4:137–148.
- Li SH, Li JP, Chen L, et al. miR-146a induces apoptosis in neuroblastoma cells by targeting BCL11A. Med Hypotheses. 2018;117:21–27.
- Kretov DA, Walawalkar IA, Mora-Martin A, et al. Ago2-Dependent processing allows miR-451 to evade the global MicroRNA turnover elicited during erythropoiesis. Mol Cell. 2020;78:317–328.
- Li Y, Liu D, Zhang X, et al. miR-326 regulates HbF synthesis by targeting EKLF in human erythroid cells. Exp Hematol. 2018;63:33–40. e32.
- Ward CM, Li B, Pace BS. Original research: stable expression of miR-34a mediates fetal hemoglobin induction in K562 cells. Exp Biol Med (Maywood). 2016;241:719–729.
- Lessard S, Beaudoin M, Orkin SH, et al. 14q32 and let-7 microRNAs regulate transcriptional networks in fetal and adult human erythroblasts. Hum Mol Genet. 2018;27:1411–1420.
- Wang F, Ling L, Yu D. MicroRNAs in beta-thalassemia. Am J Med Sci. 2021;362:5–12.
- Zhang X, Li Y, Qi P, et al. Biology of MiR-17-92 cluster and its progress in lung cancer. Int J Med Sci. 2018;15:1443–1448.
- Li Y, Vecchiarelli-Federico LM, Li YJ, et al. The miR-17-92 cluster expands multipotent hematopoietic progenitors whereas imbalanced expression of its individual oncogenic miRNAs promotes leukemia in mice. Blood. 2012;119:4486–4498.
- Arakawa Y, Itoh S, Fukazawa Y, et al. Association between oxidative stress and microRNA expression pattern of ALS patients in the high-incidence area of the Kii peninsula. Brain Res. 2020;1746:147035.
- Gan X, Zhao H, Wei Y, et al. Role of miR-92a-3p, oxidative stress, and p38MAPK/NF-kappaB pathway in rats with central venous catheter related thrombosis. BMC Cardiovasc Disord. 2020;20:150.
- Cui J, Ding H, Yao Y, et al. Inhibition Mir-92a alleviates oxidative stress and apoptosis of alveolar epithelial cells induced by lipopolysaccharide exposure through TLR2/AP-1 pathway. Biomed Res Int. 2020;2020:9673284.
- Felli N, Cianetti L, Pelosi E, et al. Hematopoietic differentiation: a coordinated dynamical process towards attractor stable states. BMC Syst Biol. 2010;4:85.
- Gabbianelli M, Testa U, Massa A, et al. Hemoglobin switching in unicellular erythroid culture of sibling erythroid burst-forming units: kit ligand induces a dose-dependent fetal hemoglobin reactivation potentiated by sodium butyrate. Blood. 2000;95:3555–3561.
- Liu N, Xu S, Yao Q, et al. Transcription factor competition at the gamma-globin promoters controls hemoglobin switching. Nat Genet. 2021;53:511–520.
- Perconti G, Rubino P, Contino F, et al. RIP-Chip analysis supports different roles for AGO2 and GW182 proteins in recruiting and processing microRNA targets. BMC Bioinformatics. 2019;20:120.
- Fibach E, Rachmilewitz EA. Pathophysiology and treatment of patients with beta-thalassemia - an update. F1000Res. 2017;6:2156.
- Fibach E, Rachmilewitz EA. Iron overload in hematological disorders. Presse Med. 2017;46:e296–e305.
- Razak SAA, Murad NAA, Masra F, et al. Genetic modifiers of fetal haemoglobin (HbF) and phenotypic severity in beta-thalassemia patients. Curr Mol Med. 2018;18:295–305.
- Basak A, Sankaran VG. Regulation of the fetal hemoglobin silencing factor BCL11A. Ann N Y Acad Sci. 2016;1368:25–30.
- Li B, Zhu X, Ward CM, et al. MIR-144-mediated NRF2 gene silencing inhibits fetal hemoglobin expression in sickle cell disease. Exp Hematol. 2019;70:85–96.
- Cheng Y, Shang X, Chen D, et al. MicroRNA-2355-5p regulates gamma-globin expression in human erythroid cells by inhibiting KLF6. Br J Haematol; 2021;193:401–405.
- Chaichompoo P, Qillah A, Sirankapracha P, et al. Abnormal red blood cell morphological changes in thalassaemia associated with iron overload and oxidative stress. J Clin Pathol. 2019;72:520–524.
- Maia de Oliveira da Silva JP, Brugnerotto AF, Romanello KS, et al. Global gene expression reveals an increase of HMGB1 and APEX1 proteins and their involvement in oxidative stress, apoptosis and inflammation pathways among beta-thalassaemia intermedia and major phenotypes. Br J Haematol. 2019;186:608–619.
- Xu Y, Miao C, Cui J, et al. miR-92a-3p promotes ox-LDL induced-apoptosis in HUVECs via targeting SIRT6 and activating MAPK signaling pathway. Braz J Med Biol Res. 2021;54:e9386.
- Wen C, Ying Y, Zhao H, et al. Resistance exercise affects catheter-related thrombosis in rats through miR-92a-3p, oxidative stress and the MAPK/NF-kappaB pathway. BMC Cardiovasc Disord. 2021;21:440.
- Martyn GE, Wienert B, Yang L, et al. Natural regulatory mutations elevate the fetal globin gene via disruption of BCL11A or ZBTB7A binding. Nat Genet. 2018;50:498–503.
- Tolve M, Ulusoy A, Patikas N, et al. The transcription factor BCL11A defines distinct subsets of midbrain dopaminergic neurons. Cell Rep. 2021;36:109697.
- Gholampour MA, Asadi M, Naderi M, et al. miR-30a regulates gamma-globin expression in erythoid precursors of intermedia thalassemia through targeting BCL11A. Mol Biol Rep. 2020;47:3909–3918.
- Gasparello J, Fabbri E, Bianchi N, et al. BCL11A mRNA targeting by miR-210: a possible network regulating gamma-globin gene expression. Int J Mol Sci. 2017;18:2530.