
 ?Mathematical formulae have been encoded as MathML and are displayed in this HTML version using MathJax in order to improve their display. Uncheck the box to turn MathJax off. This feature requires Javascript. Click on a formula to zoom.
ABSTRACT
Purpose
To explore the value of magnetic resonance imaging (MRI) T2 mapping combined with susceptibility-weighted imaging (SWI) in detecting early cartilage damage and joint bleeding in the hemophilic arthropathy (HA).
Methods
147 patients and 56 healthy controls were prospectively recruited. The knees were divided into groups A and B according to the criteria of the International Cartilage Repair Society (ICRS). The Regions of Interest (ROIs) of T2 mapping were drawn for the patella, lateral and medial femoral condyle, and lateral and medial tibial condyle. The T2 values were compared between the patients and control group using one-way ANOVA. The joint count data of International Prophylaxis Study Group (IPSG) scores of conventional and SWI sequences were statistically described using the composition ratio, and the rank sum test was used for the difference analysis.
Results
Finally, there were 99 joints in the control group, 135 knees in group A, and 94 knees in group B. There was a significant difference between the T2 value in each subgroup. Comparison of T2 value groups in each cartilage partition, except for group A and group B of the patella, revealed significant differences (all P<0.05). SWI was likely more sensitive than conventional sequences in detecting hemosiderin deposits in hemophilic joints. In addition, the IPSG scores detected by the SWI were generally higher than those of conventional sequences.
Conclusions
MR T2 mapping combined with SWI has great potential to be used for detecting early cartilage damage and micro-hemosiderin deposition in hemophiliac arthropathies and developing preventative treatment plans.
Introduction
Due to recurrent joint bleeding, hemophilic arthropathy (HA) is a common complication in patients with hemophilia, which has a high rate of deformation and disability and can seriously affect patients’ quality of life. Early detection and coagulation factor replacement therapy can prevent joint bleeding and delay the progression of joint lesions. Magnetic resonance imaging (MRI) is the gold standard for evaluating early joint changes in hemophilia [Citation1], and imaging features of synovial and osteochondral cartilage are strong predictors of joint lesion progression within 5 years [Citation2]. Therefore, early diagnosis and monitoring of articular cartilage and synovial hemosiderin-containing deposits using MRI are essential for preventive treatment planning. Also, the development of preventive treatment protocols is of crucial importance.
Currently, quantitative MRI T2 mapping techniques can be used to visualize cartilage biochemical components before changes in articular cartilage morphology occur. They also have high diagnostic value for early cartilage lesions and have been widely used in the study of degenerative joint lesions such as osteoarthritis [Citation3]. However, only a few previous studies of articular cartilage in HA with specific pathogenesis have been reported in the literature. SWI is a new MR imaging technique that uses the inhomogeneity of the magnetic field for imaging and is sensitive to magnetically sensitive substances such as hemosiderin, calcium, and iron deposits [Citation4]. However, the use of SWI sequences in diagnosing diseases of the skeletal muscle system has rarely been reported. Some studies [Citation5, Citation6] have found that the T2* weighted GRE sequence, which is based on susceptibility artifact, allows greater visualization of the synovia with hemosiderin deposits than ultrasound, while the SWI sequence is more advantageous for the display of magnetic susceptibility artifacts and is therefore very valuable in the examination of hemosiderin deposits in the skeletal muscle system. This study aimed to use T2 mapping in combination with SWI sequences to accurately assess and monitor early HA articular cartilage destruction and synovial hemosiderin deposition, thus contributing to the development of preventive treatment protocols and evaluating their effectiveness.
Materials and methods
General information
The study was reviewed and approved by the ethics committee of our hospital, and written informed consent was obtained from participants’ legal guardians. Patients diagnosed with hemophilic arthropathy at the Hemophilia Treatment and Management Center in Henan Province, China, between January 1, 2015, and January 1, 2021, and healthy volunteers recruited during the same period were prospectively selected as study subjects.
Inclusion criteria for the experimental group were the following: (1) those diagnosed with hemophilia at our hemophilia center; (2) male and with hemophilia A; (3) those with a history of joint bleeding. Exclusion criteria were: (1) other causes of knee osteoarthritis; (2) other hematologic history; (3) synovectomy prior to examination; (4) contraindications to MR examination; (5) poor MRI image quality, such as severe deformity of the joint affecting the scan; (6) International Cartilage Repair Society (ICRS) articular cartilage rating grade IV (total cartilage debridement, defect).
Inclusion criteria for the control group were: (1) age and gender-matched with the experimental group; (2) no hematologic disorders, no history of knee trauma, surgery, or arthritis; (3) no contraindications to MR examination. Exclusion criteria referred to those with poor image quality.
According to ICRS grading, cartilage injury in the experimental group was divided into two groups, i.e. groups A and group B. Group A included grade 0-I cartilage, representing articular cartilage with no obvious morphological changes, normal or abnormal signal and smooth surface, and group B included grade II-III cartilage, representing cartilage with abnormal morphology and local defects, but not involving the whole layer of cartilage. Those with severe cartilage injury grade > IV, representing cartilage with whole-layer exfoliation or defects, were not included. The control group was grade 0 cartilage.
Instruments and methods
Subjects who met the study criteria underwent MR imaging using Siemens 3.0 T MAGNATON Prisma (97 subjects in the experimental group, 46 in the control group) and GE 3.0 T Discover 750 (50 subjects in the experimental group, 10 in the control group) MRI 15-channel phased-array knee coils. To avoid the influence of motion on the experimental results, all subjects were free from strenuous activities before the examination and underwent an MRI examination after 2 h. During the MRI examination, all subjects were placed in a supine position with the foot advanced and the center of the coil at the same level as the lower edge of the patella while the joint was fixed with a sponge pad. During the MRI examination, the subjects were also asked to keep their bodies as still as possible. All MRI examinations included sagittal T1 weighted (T1WI), sagittal fat-saturated proton density-weighted (PDWI), three-dimensional double-echo steady state (3D- DESS), T2 mapping, and SWI. The above scanning sequences were completed in one pass. The imaging parameters of all sequences are shown in (Siemens). A list of knee cartilage MR imaging parameters was created from the T2 mapping source data and displayed in pseudo-color mode with a threshold of 0-100 ms.
Table 1. MR parameters.
According to the scanning machine, the T2 mapping image analysis of patients included in the study was performed using the appropriate Siemens Syngo MM WP and GE ADW 4.5 image post-processing workstations. Data measurement and evaluation of T2 mapping and SWI sequences were performed independently by two musculoskeletal radiologists with 17 and 8 years of experience in musculoskeletal imaging. The T2 mapping data were analyzed using manually drawn regions of interest (ROIs) in the image post-processing workstation. The ROIs included 5 cartilage units, i.e. patella, lateral and medial femoral condyle, lateral and medial tibial condyle. The thickest level of each articular cartilage unit was selected for data measurement. The measurement was repeated 3 times to acquire the average T2 value for each. A total of five slices per knee were used for ROI delineation and evaluation. Criteria for cartilage division were the following: medial and lateral femoral condylar cartilage was divided by the midline of the femoral trochlea articular surface, and medial and lateral tibial condylar cartilage was divided by the cartilage absence area at the attachment of the anterior and posterior cruciate ligament. On the pseudo-color map, different colors represent different values, with a color scale from blue, green, and yellow to red indicating progressively higher T2 values.
The SWI sequence used a semi-quantitative scoring method to score the degree of hemosiderin deposition in the joint images. According to the latest international prophylaxis study group (IPSG) quantitative scoring criteria for MRI imaging of hemophilic arthropathy, a small amount of hemosiderin deposition was scored as 1; a medium amount was scored as 2; a large amount was scored as 3. Two radiologists with experience in IPSG scoring of musculoskeletal imaging jointly observed the degree of hemosiderin deposition in conventional and SWI sequences, and the scores of hemosiderin deposition in conventional and SWI sequences of 229 knee joints of 147 cases in the experimental group were counted, respectively.
Statistical analysis
As hemophilia is a rare disease, patients who were studied by both machines at our hemophilia center during the same period were included so as to expand the sample size in the present study. In order to place the T2 values obtained from both machines at the same standard, we standardized the data obtained from the T2 values measured by the Siemens machine and the GE machine. The T2 values of the Siemens machine were used as the baseline, and the T2 values of the ge machine were normalized to the data and calculated as follows:
where represents the normalized T2 value of the GE machine, and
represents the maximum value of T2 values measured by the Siemens machine, the
and
represent the maximum and minimum values of T2 measured by the GE machine, respectively.
represents the T2 value measured by the GE machine. The mean±standard deviation (x¯±S) was used to express the concentration and dispersion trends when the patient's age and T2 value measures met normal distribution, and the Levene test was used for the chi-square test. One-way ANOVA (one-way ANOVA) was used for multiple data groups when the data met normal distribution and chi-square, and the LSD-t-test was used for multiple comparisons between groups to analyze the T2 values and assess the diagnostic value of joint. The diagnostic value of cartilage injury was evaluated by the LSD-t-test. The IPSG score joint count data on the conventional and SWI series were statistically described using the composition ratio, and the rank sum test was used for the analysis of variance. The test level was set at 0.05, and P < 0.05 indicated statistically significant differences. The consistency of the two radiologists was analyzed by the ICC test.
Results
T2mapping performance and quantitative assessment value of early articular cartilage damage in HA
A total of 147 male patients with hemophilic arthropathy (229 knee joints) with a mean age of (11.49 ± 5.03) years were included in the experimental group. The control group included 56 healthy male volunteers (99 knee joints) with a mean age of (12.37 ± 4.73) years. According to the ICRS cartilage grading standard, 135 patients in experimental group A were grade 0-I cartilage, and 94 patients in experimental group B were grade II-III cartilage. In the control group, the T2 mapping anatomical map showed smooth articular cartilage surface, continuous cartilage signal, uniform pseudo-color map color scale signal, and blue–green band structure, and the SWI image showed the continuous smooth high signal shadow of cartilage (). The T2 values of articular cartilage in the control group, experimental group A, and experimental group B were analyzed by ANOVA, and the results are shown in . There was good agreement between the two radiologists in the assessment of cartilage damage, with an ICC value of 0.841 (P < 0.05). The cartilage T2 values of the control group, experimental group A, and experimental group B were compared, and the F values of patellar cartilage, lateral femoral condyle cartilage, medial femoral condyle cartilage, lateral tibial condyle cartilage, and medial tibial condyle cartilage are shown in , with significant differences with P values < 0.05; the differences between the two groups were statistically significant, except for the patella in experimental group A and experimental group B (P < 0.05) (). For quantitative parameters, higher values were found for femoral than tibial articular cartilage, for lateral than medial femoral condyles, and for medial than lateral tibial condyles in all study subjects, while the lowest values were found for the patella and .
Figure 1. Healthy volunteer male 10 years old. (A) 3D-DESS image shows intact articular cartilage morphology of the medial femoral condyle of the left knee with a smooth surface and no obvious signal abnormality. (B) The T2 mapping pseudo-color image shows uniform distribution of cartilage color scale and intact articular surface distribution. (C) MRI SWI image shows intact articular cartilage morphology with a smooth surface and no magnetic sensitive low signal shadow in the joint space.
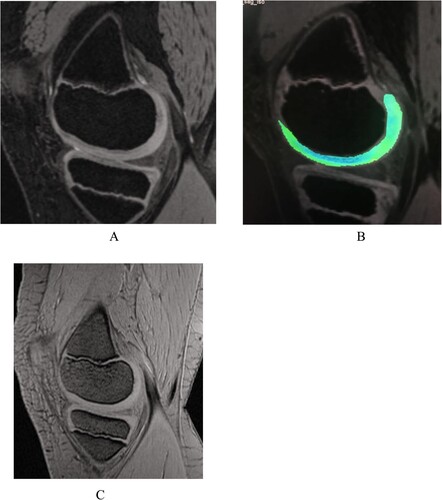
Figure 3. Hemophilic arthropathy Experimental group A Male 9 years old. (A) The 3D-DESS image showed intact articular cartilage morphology of the medial femoral condyle of the right knee joint with no obvious signal abnormalities. (B) T2 mapping pseudo-color image showing an uneven distribution of cartilage color scale, uneven color scale in the weight-bearing area of articular cartilage with a small amount of red-yellow scale, and significantly elevated cartilage T2 value. (C) MRI SWI showing a small amount of hemosiderin on the anterior-posterior border of the articular suprapatellar capsule and femoral cartilage. The MRI SWI shows a small amount of iron-containing hematoxylin in the suprapatellar capsule and the anterior-posterior border of the femoral cartilage.
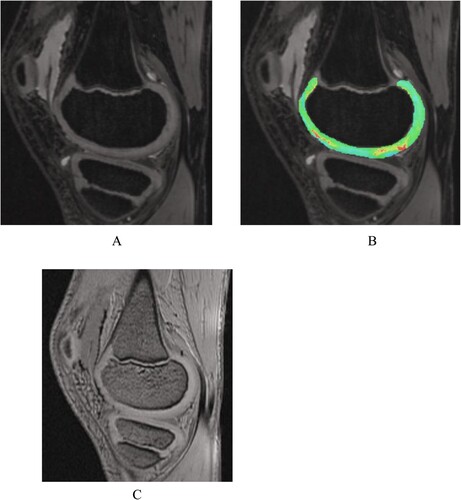
Figure 4. Patient with hemophilic arthropathy Experimental group B Male 11 years old. SWI showing a large amount of iron deposition with hemosiderin at the anterior-posterior border of the suprapatellar capsule and femoral cartilage.
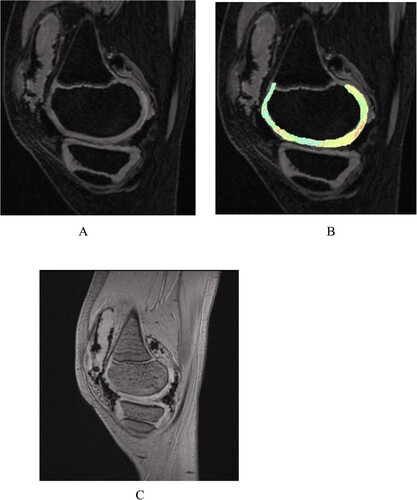
Figure 2. A bar graph showing T2 values for the different regions of interest (ROIs) in the knee. Groups HC (control), A (International Cartilage Repair Society [ICRS] level 0 and I), and B (ICRS levels II and III) were compared for each ROI. * means statistically significant (P < 0.05).
![Figure 2. A bar graph showing T2 values for the different regions of interest (ROIs) in the knee. Groups HC (control), A (International Cartilage Repair Society [ICRS] level 0 and I), and B (ICRS levels II and III) were compared for each ROI. * means statistically significant (P < 0.05).](/cms/asset/222f5b83-0d61-49dd-a097-d19d0946ca69/yhem_a_2147316_f0002_oc.jpg)
Table 2. Comparative results of articular cartilage T2 values in the control group, experimental group A, and experimental group B (x¯±s, ms).
Comparison of hemosiderin deposition scores in the joints of the experimental group by conventional and SWI sequences
In the experimental group, including 147 cases with 229 knee joints, conventional sequences of T1WI, PDWI-FS, and SWI sequences showed a very low signal shadow of hemosiderin deposits. The conventional sequence detected 58 joints with hemorrhage and hemosiderin deposits (58/229, 25.29%), and the SWI sequence detected 82 joints with hemorrhage or hemosiderin deposits (82/229, 35.63%). Twenty-four more joints with hemosiderin deposits were detected by the SWI sequence than the conventional sequence, indicating that the SWI sequence was more sensitive than the conventional sequence and could detect more joints with hemosiderin deposit joints. According to the International Study Group for the Prevention and Treatment of Hemophilia (IPSG), MRI iron-containing hemoglobin deposits scores were 1 for small amounts, 2 for moderate amounts, and 3 for large amounts. The conventional sequences showed that 171 joints (74.71%) had an IPSG score of 0, 29 joints (12.64%) had an IPSG score of 1, 3 joints (1.15%) had an IPSG score of 2, and 26 joints (11.49%) had an IPSG score of 3. The SWI sequence showed 147 joints (64.37%) had an IPSG score of 0, 32 joints (13.79%) had an IPSG score of 1. (13.79%), 21 joints had a score of 2 (9.20%), and 29 joints had a score of 3 (12.64%). It was found that among 229 joints, 58 were with hemosiderin deposits in conventional sequences, and 82 were with hemosiderin deposits in the SWI sequence. SWI sequence was likely more sensitive than conventional sequences in detecting hemosiderin deposits in hemophilic joints. In addition, the IPSG scores detected by the SWI sequence were generally higher than conventional sequences.
Discussion
Pathological changes of hemophilic arthropathy
Hemophilia is an X-sex chromosome recessive bleeding disorder. It is divided into two types, i.e. hemophilia A (factor VIII) and hemophilia B (factor IX), depending on the lack of clotting factors. The thickening of the synovial membrane stimulated by synovitis causes more joint bleeding, and the blood metabolite hemosiderin promotes the thickening of the synovial membrane, leading to the erosion of articular cartilage, and forming a vicious cycle of joint bleeding - synovitis - joint bleeding [Citation7]. Furthermore, repeated synovitis with an accumulation of destructive enzymes and cytokines can destroy cartilage and subchondral bone [Citation8]. In advanced stages, joint ankylosis and deformity may also occur, causing great pain and high disability rates. As the most common target joints are the knee [Citation9], ankle [Citation10], and elbow [Citation11], in the present study, we focused on knee joints.
Principle of T2 mapping imaging
T2 mapping includes the acquisition of T2 relaxation time maps, which are generally divided into two steps. First, T2WI is followed by pixel and voxel calculations performed to obtain color- or gray-scale T2 relaxation time images for quantitative analysis. Quantifying the transverse magnetization attenuation of tissue by measuring T2 values helps to show pathological and physiological changes in cartilage [Citation12]. When collagen and proteoglycan levels in cartilage are reduced, the signal on T2WI images increases; also, cartilage edema can further enhance this increase [Citation13]. Therefore, changes in both cartilage matrix and cartilage edema can be reflected in T2 mapping images, and an increase in cartilage T2 values correlates with cartilage damage, so changes in T2 values and pseudocolor images can suggest morphology and early damage to articular cartilage.
The value of T2 mapping in hemophilic arthropathy
In this study, we compared the T2 values of various subdivisions of knee cartilage in healthy volunteers and patients with hemophilic arthropathy with varying cartilage changes [Citation14]. Our results revealed that the T2 values of articular cartilage in patients with hemophilic arthropathy were higher than those in healthy volunteers, and the T2 values of articular cartilage increased with the severity of articular cartilage damage in patients. In addition, T2 relaxation time increased with increasing grade of cartilage defects [Citation15]. Among all the studied articular cartilage subdivisions, the T2 relaxation time was highest in the lateral and medial femoral condyles and lowest in the patella, which may be related to the higher weight-bearing of the lateral and medial femoral condyles of the articular cartilage. HA has some of the same characteristics as inflammatory joint diseases such as rheumatoid arthritis (RA) and degenerative joint diseases such as osteoarthritis (OA)[Citation16]. Therefore, elevated articular cartilage T2 values in patients with hemophilic arthropathy may indicate changes in the content and orientation of type II collagen networks, glucosamine and collagen fibers in the cartilage alterations in the content and orientation of type II collagen networks, glucosamine and collagen fibrils in cartilage, and increased water content in the lesioned area [Citation17]. For group A patients with hemophilic arthropathy (articular cartilage grade 0) articular cartilage showed no morphological or signal abnormalities in the MRI 3D-DESS images.
Conventional T1WI and T2WI sequences can only show morphological changes in the joint and can only be detected when morphological changes such as defective cartilage thinning and cartilage microcytosis occur, and when the pathological changes in cartilage are often irreversible [Citation18]. The most commonly used gradient echo sequence in the examination of hemophilic arthropathy is the T2WI sequence, which can observe cartilage and is also sensitive to the detection of hemosiderin. Still, as this sequence has low resolution and thick layer thickness, it cannot accurately determine cartilage damage [Citation19]. DWI imaging can obtain information on the diffusion of water molecules in articular cartilage and assess the degeneration of articular cartilage by ADC values [Citation20]. T1ρ mapping is sensitive to changes in proteoglycan content in cartilage, and compared with T2mapping, it is also sensitive to changes in proteoglycan content in cartilage. It is more sensitive than T2mapping in assessing biochemical changes in small articular cartilage degeneration but requires special pulse sequences, a longer time, and technical requirements such as high field strength and high RF pulse energy [Citation21]. Although arthroscopy is the gold standard for diagnosing articular cartilage damage, patients with hemophilia prone to spontaneous bleeding are more reluctant to accept this invasive technique. Several imaging methods have been used to evaluate HA in recent years, but they have not been widely used in evaluating early cartilage changes [Citation22]. Compared with other MRI physiological imaging techniques, T2 mapping, as an emerging MRI physiological imaging technique, has the advantages of shorter imaging time, higher spatial resolution, and non-invasiveness, which can detect biochemical changes in early degeneration of articular cartilage and provide an objective basis for early diagnosis, when the cartilage lesions are still reversible, and timely clinical intervention and treatment could prevent further development of cartilage lesions.
The ability of SWI to detect and diagnose hemosiderin deposits in HA
HA results from a multifactorial formation, and its exact pathogenesis is still not fully understood. Nevertheless, the formation of hemosiderin in the synovial membrane in joints on articular cartilage damage is currently recognized as an important factor [Citation4]. Therefore, in patients with hemophilic arthropathy, detecting hemosiderin deposits in the joint is also an important reference factor for evaluating articular cartilage damage [Citation23]. SWI is based on T2-weighted gradient echo sequences and provides image contrast enhancement based on differences in magnetic susceptibility between different tissues while obtaining magnetic distance images and phase images. The SWI is sensitive to paramagnetic substances, especially iron in the form of hemosiderin and oxyhemoglobin [Citation24]. Previously, SWI sequences have been mainly used in studying neurological brain tissue lesions, while little research has been done on hemophilic arthropathies. SWI has been included in routine imaging protocols at some centers for various indications, most notably the suspicion of cerebral ischemia or infarction and the evaluation of trauma patients. Considering the nonjoint research in the existing literature, we propose that SWI, which is not routinely used in joint examinations, may contribute to joint evaluations of patients with bleeding tendencies, such as hemophilia. Because of the increased risk of bleeding associated with hemophilia, the invasive procedures that can be performed on patients with this disease are limited. As a result, we could not use arthroscopy as a reference standard for detecting intraarticular hemosiderin accumulation and cartilage changes in this patient group's joints. Furthermore, arthroscopy cannot clearly assess the amount of intraarticular hemosiderin. In our study, two experienced musculoskeletal radiologists used conventional MRI and SWI sequences to make final decisions on hemosiderin accumulation. The results showed that among 229 joints, 58 were found to have hemosiderin deposits in conventional sequences and 82 to have hemosiderin deposits in the SWI sequence. In addition, the IPSG scores detected by SWI sequences were generally higher than those detected by conventional sequences, indicating that SWI sequences may detect more hemorrhage and hemosiderin deposits than conventional sequences. The SWI sequence revealed that 147 joints had not yet formed hemosiderin deposits, presumably because the patients included in this study were all in the early stage of HA. Also, some joints had not yet formed hemosiderin deposits after bleeding, which is indicative of various physiological mechanisms in the joints in the early stage of HA. If effective treatment is carried out during this period to stop the subclinical bleeding state of the joints, although mild biochemical changes exist in the cartilage at this time, this cartilage proliferation and metabolism are also very vigorous, and active treatment at this time could effectively stop the progression of joint lesions.
Study limitations
First, the present study lacks a pathological ‘gold standard’ for comparison, but given the special characteristics of hemophilia patients, pathological examinations are invasive and not recommended. Second, the limited number of cases did not allow for a controlled analysis study by age group. Third, the GRE sequence cannot remove the proton out-of-phase caused by magnetic field inhomogeneity, so T2 mapping is vulnerable to magnetic field inhomogeneity.
5. Conclusion
Magnetic resonance functional imaging T2 mapping can detect cartilage damage in patients with hemophilic arthropathy at an early stage and is valuable in differentiating different degrees of cartilage damage, while SWI sequence is very sensitive in the deposition of hemosiderin and may contribute to more accurate ratings of intraarticular hemosiderin accumulation compared to conventional MRI sequences. These findings may affect hemophilia MRI scale results. The combined T2 mapping and SWI sequences have great potential to help the clinical development of preventive treatment plans for hemophilia patients, thus minimizing the disability rate, improving the quality of life, and prolonging the life span of patients. However, multicenter studies with larger patient groups are needed to validate these findings.
Disclosure statement
No potential conflict of interest was reported by the author(s).
Additional information
Funding
References
- Peyvandi F, Garagiola I, Young G. The past and future of haemophilia: diagnosis, treatments, and its complications. Lancet. 2016;388(10040):187–197.
- Van Vulpen LFD, Holstein K, Martinoli C. Joint disease in haemophilia: pathophysiology, pain and imaging. Haemophilia. 2018;24(Suppl 6):44–49.
- Plut D, Faganel Kotnik B, Preložnik Zupan I, et al. Detection and evaluation of haemophilic arthropathy: which tools may be considered more reliable. Haemophilia. 2020;27(1):156–163.
- Akyuz B, Polat AV, Ozturk M, et al. Contribution of 3-T susceptibility-weighted MRI to detection of intraarticular hemosiderin accumulation in patients with hemophilia. AJR Am J Roentgenol. 2018;210(5):1141–1147.
- Aisa S, Lucía Cuesta C, Rubio Martínez JF, et al. Comparison of ultrasound and magnetic resonance imaging for diagnosis and follow-up of joint lesions in patients with haemophilia. Haemophilia. 2013;20(1):e51–e57.
- Plut D, Kotnik BF, Zupan IP, et al. Diagnostic accuracy of haemophilia early arthropathy detection with ultrasound (HEAD-US): a comparative magnetic resonance imaging (MRI) study. Radiol Oncol. 2019;53(2):178–186.
- Huang K, Chen Z, Li G, et al. Bleeds and imaging scoring scales in relation to pharmacokinetics of coagulation factor VIII in Chinese pediatric patients with severe hemophilia A. Thromb Res. 2020;193:83–85.
- Soellner S, Goldmann A, Muelheims D, et al. Intraoperative validation of quantitative T2 mapping in patients with articular cartilage lesions of the knee. Osteoarthritis Cartilage. 2017;25(11):1841–1849.
- Gualtierotti R, Solimeno LP, Peyvandi F. Hemophilic arthropathy: current knowledge and future perspectives. J Thromb Haemost. 2021;19(9):2112–2121.
- Greco T, Polichetti C, Cannella A, et al. Ankle hemophilic arthropathy: literature review. Am J Blood Res. 2021;11(3):206–216.
- Dale TM, Saucedo JM, Rodríguez-Merchán EC. Hemophilic arthropathy of the elbow: prophylaxis, imaging, and the role of invasive management. J Shoulder Elb Surg. 2015;24(10):1669–1678.
- Ferizi U, Rossi I, Lee Y, et al. Diffusion tensor imaging of articular cartilage at 3T correlates with histology and biomechanics in a mechanical injury model. Magn Reson Med. 2016;78(1):69–78.
- Zhong H, Miller DJ, Urish KL. T2 map signal variation predicts symptomatic osteoarthritis progression: data from the osteoarthritis initiative. Skeletal Radiol; 2016;45:909–913.
- Guermazi A, Alizai H, Crema MD, et al. Compositional MRI techniques for evaluation of cartilage degeneration in osteoarthritis. Osteoarthritis Cartilage. 2015;23(10):1639–1653.
- Renner N, Kleyer A, Krönke G, et al. T2 mapping as a new method for quantitative assessment of cartilage damage in rheumatoid arthritis. J Rheumatol. 2020;47(6):820–825.
- Waldenmeier L, Evers C, Uder RM, et al. Using cartilage MRI T2-mapping to analyze early cartilage degeneration in the knee joint of young professional soccer players. Cartilage. 2019;10(3):288–298.
- Zhang YX, Li MX, Wei SF, et al. Multislice spiral computed tomography imaging in evaluating hemophilic arthropathy. Chin Med J. 2020;133(14):1669–1675.
- Tolend M, Majeed H, Soliman M, et al. Critical appraisal of the International Prophylaxis Study Group magnetic resonance image scale for evaluating haemophilic arthropathy. Haemophilia. 2020;26(4):565–574.
- Mittal S, Pradhan G, Singh S, et al. T1 and T2 mapping of articular cartilage and menisci in early osteoarthritis of the knee using 3-Tesla magnetic resonance imaging. Polish J Radiol. 2019;84:549–564.
- Zhang N, Lv Y, Yue L, et al. T2 mapping in the quantitative evaluation of articular cartilage changes in children with hemophilia: a pilot study. Pediatr Investig. 2019;2(4):242–247.
- Majeed H, Ahmed H, Sussman MS, et al. Understanding early hemophilic arthropathy in children and adolescents through MRI T2 Mapping. J Magn Reson Imaging. 2021;53(3):827–837.
- Fernquest S, Palmer A, Pereira C, et al. The response of hip joint cartilage to exercise in children: an MRI study using T2-mapping. Cartilage. 2020;12:1761S–1771S.
- Von Drygalski A, Barnes RFW, Jang H, et al. Advanced magnetic resonance imaging of cartilage components in haemophilic joints reveals that cartilage hemosiderin correlates with joint deterioration. Haemophilia. 2019;25(5):851–858.
- Olb A, Jmdh B, Rh A, et al. The road to optimal acceleration of Dixon imaging and quantitative T2-mapping in the ankle using compressed sensing and parallel imaging. Eur J Radiol. 2020;132:1–7.