
ABSTRACT
Background
Diffuse large B-cell lymphoma (DLBCL) is the most common aggressive lymphoma. The standard first-line therapy for DLBCL consists of rituximab cyclophosphamide doxorubicin vincristine and prednisone (R-CHOP). About 50–70% of patients may be cured by R-CHOP. There was no data on external validation and comparison of the international prognostic index, revised-IPI (R-IPI), and enhanced-IPI (NCCN-IPI) to predict treatment outcomes in the middle-income country with a resourced-limited setting.
Objectives
We aimed to externally validate and compare IPI, R-IPI, and NCCN-IPI in predicting 2-year progression-free survival (2-y PFS) of newly diagnosed DLBCL patients treated with R-CHOP.
Methods
This ambispective observational study recruited consecutive patients diagnosed between 1 January 2014 and 30 June 2020, with the last follow-up on 1 July 2022 from Thammasat University Hospital and Ramathibodi Hospital. We assessed discrimination by Harrell‘s concordance index (c-index), calibration by calibration plot, and absolute difference in survival (ADS) between the lowest-and the highest-risk groups.
Results
The cohort of 292 patients (median age 63 years and median follow-up 3.6 years) had 131 progressions and 96 deaths. The 2-y PFS was 63%. The c-indices were NCCN-IPI 0.6216, R-IPI 0.6004 (P = 0.215), and IPI 0.6104 (P = 0.463). The calibration plots of NCCN-IPI and R-IPI showed nearly perfect agreement (moderate strength), while IPI had miscalibrations. The ADSs were NCCN-IPI 52%, R-IPI 42%, and IPI 25%.
Conclusion
NCCN-IPI is the best prognostic index compared to IPI and R-IPI in prior studies. However, the prognostic model for DLBCL patients treated with R-CHOP requires updating or integrating biomarkers to improve discrimination to the acceptable level (c-index 0.7).
Introduction
Diffuse large B-cell lymphoma (DLBCL) is the most common aggressive lymphoma.
First-line treatment is chemo-immunotherapy with rituximab, cyclophosphamide, doxorubicin, vincristine, and prednisolone (R-CHOP). About 50–70% of patients may be cured by R-CHOP. Among treatment failures, 20% were refractory diseases (progression during or soon after treatment), and 30% were relapsed diseases after remission [Citation1].
The three common prognostic models are the international prognostic index [Citation2], revised-IPI (R-IPI) [Citation3], and enhanced IPI using data from National Comprehensive Cancer Network (NCCN-IPI) [Citation4]. These indices help discriminate between patients who are more likely or less likely to be cured by standard therapy. These three models are calculated from five variables collected at diagnosis: age, stage, lactate dehydrogenase (LDH), Eastern-cooperative oncology group performance status (ECOG), and extranodal sites. They stratify patients into risk groups to predict treatment outcomes. IPI and NCCN-IPI stratify patients into four risk groups (low, low-intermediate [LI], high-intermediate [HI], and high). R-IPI has only three risk groups (very good, good, and poor). NCCN-IPI had the largest absolute difference in survival (ADS) between lowest- vs highest-risk groups (5-year overall survival [5-y OS] NCCN-IPI63%[96% vs 33%], IPI 36% [90% vs 54%] [Citation4]; 4-y OS R-IPI 39% [94% vs 55%]) [Citation3].
The transparent reporting of a multivariable prediction model for individual prognosis or diagnosis (TRIPOD) advocates discrimination and calibration as measures to assess model performance [Citation5]. Discrimination is the ability to differentiate between those who do or do not experience the outcome. In the survival model, discrimination is measured and reported as a concordance index (c-index). Calibration reflects the agreement between observed and predicted outcomes and is graphically demonstrated as a calibration plot with predictions on the x-axis and the outcome on the y-axis [Citation5,Citation6].
The previous three external validation and comparison studies reported only discrimination and ADS but not calibration. NCCN-IPI had the highest c-index of all studies: 5-y OS in Chinese patients NCCN-IPI 0.654 and IPI 0.611 [Citation7], OS in a population-based Nordic registry NCCN-IPI 0.67, IPI 0.65, and R-IPI 0.63 [Citation8], and OS in multicenter clinical trials from European countries and north America NCCN-IPI 0.632, IPI 0.626, and R-IPI 0.590 [Citation9]. NCCN-IPI also yielded highest ADS in predicting 5-y OS (NCCN-IPI43% [49% vs 92%], IPI 34% [54% vs 88%], and R-IPI 32% [61%vs93%]) [Citation9]. The 5-y OS has long been a standard treatment endpoint that requires extended follow-up time and may delay novel drug trials [Citation10]. The risk of progression is highest within the first two years [Citation10,Citation11] and those who survived 2-y progression were clinically indistinguishable from the general population [Citation10,Citation12]. The 2-y progression-free survival (2-y PFS) has a strongly positive correlation to 5-y OS (r 0.858) [Citation10]. Thus, we use 2-y PFS as an endpoint.
We aimed to externally validate and compare IPI, R-IPI, and NCCN-IPI in predicting 2-year progression-free survival (2-y PFS) of newly diagnosed DLBCL patients treated with R-CHOP in a resource-limited setting.
Materials and methods
This observational cohort study ambispectively recruited consecutive patients diagnosed with de novo DLBCL, not otherwise specified according to the World Health Organization (WHO) classification [Citation13,Citation14]. The recruitment was conducted between 1 January 2014 and 30 June 2020 from two university hospitals (Department of Pathology, Thammasat University Hospital and Department of Pathology, Ramathibodi Hospital). The retrospective collection was from 1 January 2014 to 31 December 2017, and the prospective group was from 1 January 2018 to 30 June 2020. Eligible patients were at least 18 years old and received R-CHOP as first-line therapy. We would exclude patients who did not have ECOG, LDH, and staging at diagnosis. The final follow-up date was 1 July 2022.
Data regarding diagnosis, treatment, follow-up physical examination, laboratory findings, and radiologic findings were collected from the electronic medical databases. The date of death of those who lost to follow-up was available in civil registration, which merged with the reimbursement system.
Physical examination, bone marrow (BM) biopsy, and computed tomography (CT) or fluorodeoxyglucose (FDG) positron emission tomography (PET)-CT assessed stage and response according to Lugano criteria into complete remission (CR), partial response (PR), stable disease (SD), and progressive disease [Citation15]. PET-CT was not available in all patients due to high cost and limited indication for reimbursement [Citation16]. Progression-free survival (PFS) was the time from the date of diagnosis to the earliest occurrence of refractory disease, progressive disease, or death from any cause. The 2-year PFS meant alive and progression-free two years after the diagnosis.
We calculated the sample size from the assumption of at least 100 to optimally 200 progressions [Citation17], comprising 30–50% of the cohort, which would occur during follow-up. Thus, the number of participants would be 300–600 patients. Predictor variables (age, LDH, stage, ECOG, and extranodal disease) were requisite for complete-case analysis.
The survival curves were analyzed and graphed with the Kaplan–Meier (KM) method and compared by a non-parametric log-rank test. The probability of predicted risk for each patient was calculated according to the IPI, R-IPI, and NCCN-IPI.
We externally validated and compared the predictive performance of 2-y PFS of the three models by discrimination, calibration, and ADS. Discrimination by Harrell‘s concordance index (c-index) [Citation18] measures the ability of the model to predict patients who would have progression earlier than those who would not. A c-index of 1 is perfect, 0.7 is acceptable, 0.6 is poor, and 0.5 is no better than a coin flip. We estimated the difference in the c-index by a linear combination [Citation19]. The calibration plot based on the flexible parametric model and Cox regression-derived hazard demonstrates how close the predicted progression agreed with the observed progression. Subtraction of progression-free survival between the lowest- and highest-risk groups resulted in the ADS [Citation4,Citation9].
The human research ethics committee of Thammasat University No.1 (Faculty of Medicine) and Mahidol University (Faculty of Medicine, Ramathibodi Hospital) reviewed and approved the study to research compliance (Thammasat No. COA 055/2561, dated 25 February 2018) Ramathibodi (MURA2018/85, dated 23 March 2018) with the Declaration of Helsinki and International Conference on Harmonization of Good Clinical Practice. This observational study collected data from the electronic medical record. There was no intervention other than routine clinical practice, and no more than minimal risk was involved. Consent was waived for the study.
Results
The study enrolled 292 patients diagnosed with de novo DLBCL, NOS and treated with R-CHOP. All patients had ECOG, LDH, and staging at diagnosis, thus we did not exclude any. The median age was 63 years (range 20–95) with 57% older than 60 years. Those aged at least 80 years (n = 20) received R-mini-CHOP. Many of our patients had elevated LDH (67%), stage III/IV disease (59%), and non-germinal center B-cell type (non-GCB) (65%). Staging at diagnosis was from physical examination, CT, and BM biopsy. Response assessment imaging was from PET-CT in 56 patients (19%) and CT in the remaining. The median follow-up time was 3.6 years (range, 0.1–8.4). One patient received the first cycle of R-CHOP, had stroke, changed to palliative care, then a loss to follow-up. Patients who received incomplete R-CHOP course (n = 23) were due to refractory disease (n = 19), elderly (aged 80 years) with refractory disease and death (n = 1), stroke then palliative (n = 1), drug-induced pneumonitis after 4th cycle (n = 1), and lost to follow-up after 4th cycle (n = 1).
During R-CHOP treatment, 28 patients had refractory diseases and 6 died. The treatment responses at the end of R-CHOP were PD (n = 31), PR (n = 48), and CR (n = 184) (). The total refractory diseases (n = 81) were detected before end of R-CHOP (n = 28), at restaging (n = 31), after PR (n = 5), and after CR (n = 17). Additional therapies were second-line regimens (n = 92), involved site radiation therapy (n = 101), surgical resection (n = 39), and hematopoietic stem cell transplant (HCT) (n = 10). The second-line regimens included DHAP (dexamethasone, cisplatin, and cytarabine), ICE (ifosfamide, carboplatin, and etoposide), ESHAP (etoposide, methylprednisolone, cytarabine, and cisplatin), DA-EPOCH (etoposide, prednisone, vincristine, cyclophosphamide, and doxorubicin) +/- rituximab. The overall outcomes from the entire follow-up were 131 progressions, 81 refractory diseases, 35 relapses, 96 deaths, and 241 CR. For two years of follow-up, there were 105 progressions (40%) and 67 deaths (23%).
Figure 1. Flow of participants. CA: carcinoma, CR: complete response; DLBCL: diffuse large B-cell lymphoma; ECOG: Eastern-cooperative oncology group performance status; HCT: Hematopoietic stem cell transplant; HI: high-intermediate; IPI: international prognostic index; LDH: lactate dehydrogenase; LI: low-intermediate; NCCN-IPI: enhanced-IPI; PD: progressive disease; PR: partial response; RT: radiation therapy; R-CHOP: rituximab cyclophosphamide doxorubicin vincristine and prednisone; R-IPI: revised international prognostic index, t-AML: therapy-related acute myeloid leukemia, TB: tuberculosis.
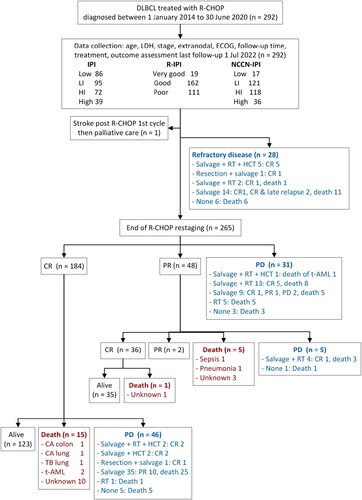
Those who experienced progression had a significantly higher proportion of elevated LDH (P = .001), stage III-IV (P < .001), ECOG PS ≥2 (P = 0.003), extranodal disease (P = .003) [Citation3] tract or lung (P = .030), bulky disease (P = .005), and non-germinal center B-cell type (P = .042) ().
Table 1. Participant characteristics with progression and without progression.
The causes of death in 96 patients were progressive disease (n = 75), therapy-related acute myeloid leukemia (t-AML) after HCT (n = 1), CR with t-AML (n = 2), CR with non-DLBCL or R-CHOP related cause (n = 4: pulmonary adenocarcinoma n = 1, colonic adenocarcinoma n = 1, pulmonary tuberculosis n = 1, and bacterial pneumonia n = 1), PR with unknown cause of death (n = 3), and CR with unknown cause of death (n = 11) ().
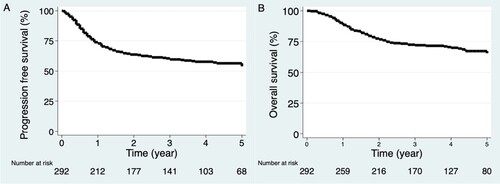
The KM curves for PFS and OS were similar with a high rate of progression (105/131, 80%) and death (67/96, 70%) occurring in the first two years. The 2-year survival estimates were PFS 63% (95% CI, 58–69%) and OS 77% (95% CI, 72–82%). The median PFS and OS were not reached ().
Figure 2. The 5-year survival probability. (A) Progression-free survival and (B) overall survival.
Survival curve
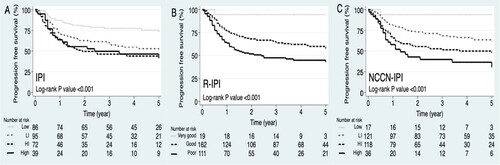
The survival curves of all three IPIs showed a significant difference between risk groups (IPI log-rank P < .001, R-IPI P < .001, and NCCN-IPI P < .001). However, the survival curves of IPI showed overlaps between HI and high-risk groups, while that of R-IPI and NCCN-IPI risk groups were well separated ().
Figure 3. The 5-year progression-free survivals for risk groups according to (A) IPI, (B) R-IPI, and (C) NCCN-IPI. HI high-intermediate, IPI international prognostic index, LI low-intermediate, NCCN-IPI enhanced-IPI, R-IPI revised-IPI.
The absolute difference in survival
The 2-y PFS ADSs between the lowest- and highest-risk groups were IPI 25% (80% vs 55%), R-IPI 42% (94% vs 52%), and NCCN-IPI 52% (94% vs 42%). Only the NCCN-IPI identified a risk group with less than a 50% chance of survival (highest-risk IPI 55%, R-IPI 52%, and NCCN-IPI 42%) ().
Table 2. Risk stratification, predicted outcome, and absolute difference in survival of 2-year progression-free survival by IPI, R-IPI, and NCCN-IPI.
Discrimination
The NCCN-IPI had the highest ability to differentiate between patients who would or who would not have disease progression within two years by c-index 0.6216 (95% CI 0.5727–0.6706), followed by IPI 0.6104 (0.5590–0.6618), and lastly R-IPI 0.6004 (0.5524–0.6484). However, NCCN-IPI c-index was not significantly higher than both IPI (P = .463) and R-IPI (P = .215) ().
Table 3. Discrimination at 2-year progression-free survival by IPI, R-IPI, and NCCN-IPI.
Calibration
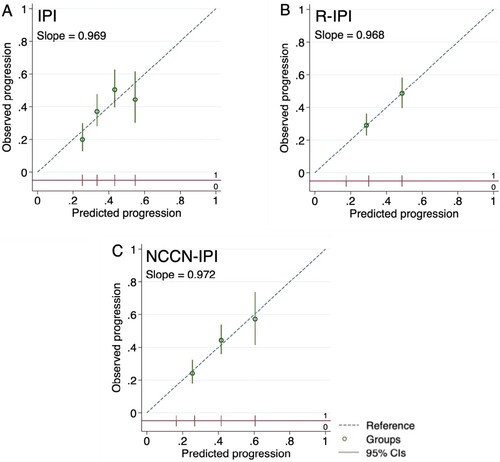
The calibration plots of all three models lie close to or on a diagonal line at 45 degrees, especially R-IPI and NCCN-IPI, indicating nearly perfect agreement between mean predicted and mean observed 2-y progression according to risk groups. The strength of calibration of R-IPI and NCCN-IPI is moderate. The IPI showed overestimation in high-risk (0.55 vs 0.45) and low-risk (0.25 vs 0.20), and underestimation in high-intermediate (0.43 vs 0.50) and low-intermediate (0.33 vs 0.38). The effects of predictors were, on average like the original model setting (calibration slope IPI 0.969, R-IPI 0.968, and NCCN-IPI 0.972) ().
Figure 4. Calibration plots for prediction of 2-year progression of (A) IPI, (B) R-IPI, and (C) NCCN-IPI. Predicted progressions are on the x-axis, and observed progressions are on the y-axis. The circles indicate the mean predicted probability with the vertical line as the 95% confidence interval of the risk groups. The risk group distributions are vertical lines at the bottom of the graph, parallel to the x-axis. (A) Four circles represented mean low, low-intermediate, high-intermediate, and high-risk groups from left to right, respectively. (B) Two circles of R-IPI represented good and poor-risk groups. (C) Three circles of NCCN-IPI represented low-intermediate, high-intermediate, and high-risk groups. Plots (B) and (C) omitted very good R-IPI and low NCCN-IPI groups as progression occurred at less than 10%.
Discussion
NCCN-IPI, IPI, and R-IPI are widely accepted and easy to use. They apply the same readily available predictive clinical factors. Old age at diagnosis is associated with unfavorable molecular features such as activated B-cell gene expression profile subtype and cytogenetic complexity [Citation20]. Elevated LDH is a poor predictive factor of survival outcome [Citation21]. NCCN-IPI categorized age and LDH into incremental scores to capture the increased risk of mortality based on the Cox proportional hazard (CPH) model [Citation4], wherein IPI and R-IPI are dichotomous [Citation2,Citation3]. In European countries, North America, and China, NCCN-IPI was more efficient in predicting prognosis than IPI and R-IPI [Citation4,Citation7,Citation8,Citation9].
There was no external validation of the prognostic model study in DLBCL assessed and reported both discrimination and calibration according to the TRIPOD checklist. Our results represent current real-world practice in the resource-limited setting of developing countries. The study‘s limitations are lack of PET-CT in staging, low availability (19%) of PET-CT in response assessment, and retrospective design in 50% of the cohort. Assessment by CT may under stage and pose confounding effect. The retrospective design could lead to selection bias.
Compared to previous studies, our participants had a higher proportion of elevated LDH (67% vs 52% [Citation7] to 59% [Citation9]) and different outcome measures (PFS vs OS [Citation4,Citation7–9]). Our population was similar to previous studies in age (median 63–67 years and age range 19–95 years, and proportion of age >60 years from 56 to 60%), stage III-IV (55–66%), extranodal by NCCN-IPI (38%), ECOG 2–4 (26–37%), and high-risk NCCN (4–14%) [Citation7–9]. In predicting 2-y PFS, the NCCN-IPI had the highest c-index (0.6216), which was not significantly different from R-IPI (0.6004, P = .215) and IPI (0.6104, P = .463). Previous studies’ c-index for OS ranged from 0.632 [Citation9] to 0.67 [Citation8]. The discrimination of a prognostic prediction model with a c-index of around 0.6 is poor. The 4 parsimonious model updating studies with a c-index higher than 0.7 were GELTAMO-IPI [Citation22], Lipo-PI [Citation23], Kang [Citation24], and CPH [Citation8].
GELTAMO-IPI added normalized Beta-2 microglobulin (Beta-2) and dropped extranodal disease because primary extranodal presentation and extranodal involvement did not have an independent prognostic effect, thus maintaining five variables and four risk groups [Citation22]. The scores were age ≥65 to ≤79 = 1, ≥ 80 = 2; LDH >1 = 1; ECOG 2 = 1, 3-4 = 2; Beta-2 > 1 = 1; stage III-IV = 1; the maximal score is 7 and there are 4 risk groups; scores 0 low, 1–3 LI, 4 HI, and ≥5 high. In the reclassification calibration statistic (the Hosmer-Lemeshow goodness-of-fit and P) between GELTAMO-IPI and NCCN-IPI, the higher P indicated better discrimination. GELTAMO-IPI was more accurate than NCCN-IPI in the high-risk group with an observed 5-y OS of 41%; GELTAMO-IPI predicted 39% (X2 9.54; P = .299) while NCCN-IPI predicted 49% (χ2 16.40; P = .037) [Citation22]. For external validation in Chinese patients in the prediction of 3-yr OS, the c-indices were GELTAMO-IPI 0.721 vs NCCN-IPI 0.671, and for 3-y PFS GELTAMO-IPI 0.700 vs NCCN-IPI 0.664 [Citation25].
The lipoprotein prognostic index (Lipo-PI) added low-density lipoprotein (LDL) and high-density lipoprotein (HDL) to NCCN-IPI (7 variables). Low HDL and low LDL were allocated 2 points; low HDL alone or low LDL alone were allocated 1 point; those within normal limits were allocated 0 point. The role of lipid metabolism in cancer development is not fully understood. This new scoring system has a total score of 10. The four risk groups are scores 0–2 low, 3–4 LI, 5–6 HI, and ≥7 high. In predicting 5-yr OS, the c-indices were Lipo-IP 0.830 vs NCCN-IPI 0.766 [Citation23].
Kang included five variables (age >60, LDH ratio >1, ECOG ≥2, stage III-IV, and Beta-2 > 2.5 mg/L) with one 1-score each, a total score of 5. The four risk groups were 0 low, 1 LI, 2–3 HI, and 4–5 high. In the prediction of 5-y OS, the c-indices were Kang 0.739 vs NCCN-IPI 0.710 [Citation24].
CPH model incorporated the same five factors as NCCN-IPI, maintaining the linearity of continuous variables of age and normalized LDH, implemented in the interactive web page for Nordic countries (lymphomapredictor.org). CPH model increased the c-index in the prediction of OS (c-index CPH 0.73 vs NCCN-IPI 0.67) [Citation8]. Since baseline survival of the CPH model is from the Nordic population, thus use is limited in other geographic areas.
We concluded that NCCN-IPI is the best prognostic index compared to IPI and R-IPI as prior studies. However, the prognostic model for DLBCL patients treated with R-CHOP requires updating or integrating biomarkers to improve discrimination to the acceptable level (c-index 0.7). Suggestions for future external validation in the developing country setting are recruiting participants from a multicentre study, prospective data collection, PET-CT staging and response assessment, and the addition of baselines B2M or other potential biomarkers.
Acknowledgements
N.W., N.K., P.N., P.B., and P.K. conceptualized the research project. N.W., N.K., P.N., P.B., W.L., L.B., S.S., P.C., T.P., and S.C. collected data. N.W. and P.B. diagnosed lymphoma. N.W. analyzed and visualized data under supervision of P.K. N.W. wrote the original draft. All authors read and approved the final manuscript.
Disclosure statement
No potential conflict of interest was reported by the author(s).
Data availability statement
The data that support the findings of this study are available from the corresponding author, upon reasonable request.
Additional information
Notes on contributors
Naree Warnnissorn
Naree Warnnissorn is an Associate Professor of Anatomic Pathology at Faculty of Medicine, Thammasat University, Thailand. Her clinical practice interest is in hematopathology. Her research interests include pathology and prognosis of lymphoma, leukemia, and myeloma. Her most cited publication entitled ‘Non-Hodgkin lymphoma in South East Asia: An analysis of the histopathology, clinical features, and survival from Thailand’.
Nonglak Kanitsap
Nonglak Kanitsap is an Associate Professor of Hematology at Faculty of Medicine, Thammasat University, Thailand. Her most cited publication entitled ‘Non-Hodgkin lymphoma in South East Asia: An analysis of the histopathology, clinical features, and survival from Thailand’.
Pimjai Niparuck
Pimjai Niparuck is an Associate Professor of Hematology at Faculty of Medicine, Ramathibodi Hospital, Mahidol University, Thailand. Her most cited publication entitled ‘Incidence of thromboembolism in patients with COVID-19: A systematic review and meta-analysis’.
Paisarn Boonsakan
Paisarn Boonsakan is an Assistant Professor of Anatomic Pathology at Ramathibodi Hospital, Mahidol University, Thailand. His most cited publication entitled ‘Extranodal NK/T-cell lymphoma, nasal type, includes cases of natural killer cell and αβ, γδ, and αβ/γδ t-cell origin: A comprehensive clinicopathologic and phenotypic study’.
Prapasri Kulalert
Prapasri Kulalert is an instructor at Department of Clinical Epidemiology, Faculty of Medicine, Thammasat University, Thailand. Her most cited article entitled ‘Evaluating the impact of allergic rhinitis on quality of life among Thai students’.
Wasithep Limvorapitak
Wasithep Limvorapitak is an Associate Professor of Hematology at Faculty of Medicine, Thammasat University, Thailand. His most cited publication entitled ‘Outcomes of intermediate risk karyotype acute myeloid leukemia in first remission undergoing autologous stem cell transplantation compared with allogeneic stem cell transplantation and chemotherapy consolidation: A retrospective, propensity-score adjusted analysis’.
Lantarima Bhoopat
Lantarima Bhoopat is an instructor at Hematology Division, Department of Internal Medicine, Faculty of Medicine, Thammasat University, Thailand. Her most cited publication entitled ‘Low vegetable intake is strongly associated with venous thromboembolism in Thai population’.
Supawee Saengboon
Supawee Saengboon) is an instructor at Hematology Division, Department of Internal Medicine, Faculty of Medicine, Thammasat University, Thailand. Her most cited publication entitled ‘Spontaneous heparin-induced thrombocytopaenia with adrenal haemorrhage following orthopaedic surgery: a case report and literature review’.
Pichika Chantrathammachart
Pichika Chantrathammachart is an instructor at Division of Hematology, Department of Medicine, at Faculty of Medicine, Ramathibodi Hospital, Mahidol University, Thailand. Her most cited publication entitled ‘Tumor-derived tissue factor activates coagulation and enhances thrombosis in a mouse xenograft model of human pancreatic cancer’.
Teeraya Puavilai
Teeraya Puavilai is an instructor at Division of Hematology, Department of Medicine,Faculty of Medicine, Ramathibodi Hospital, Mahidol University, Thailand. Her most cited publication entitled ‘Extranodal NK/T-cell lymphoma, nasal type, includes cases of natural killer cell and αβ, γδ, and αβ/γδ t-cell origin: A comprehensive clinicopathologic and phenotypic study’.
Suporn Chuncharunee
Suporn Chuncharunee is an Associate Professor of Hematology at Faculty of Medicine, Ramathibodi Hospital, Mahidol University, Thailand. His most cited publication entitled ‘Panobinostat plus bortezomib and dexamethasone versus placebo plus bortezomib and dexamethasone in patients with relapsed or relapsed and refractory multiple myeloma: a multicentre, randomised, double-blind phase 3 trial’.
References
- Coiffier B, Sarkozy C. Diffuse large B-cell lymphoma: R-CHOP failure-what to do? Hematology Am Soc Hematol Educ Program. 2016;1:366–378.
- International Non-Hodgkin‘s Lymphoma Prognostic Factors P. A predictive model for aggressive non-Hodgkin‘s lymphoma. N Engl J Med. 1993;329(14):987–994.
- Sehn LH, Berry B, Chhanabhai M, et al. The revised international prognostic index (R-IPI) is a better predictor of outcome than the standard IPI for patients with diffuse large B-cell lymphoma treated with R-CHOP. Blood. 2007;109(5):1857–1861.
- Zhou Z, Sehn LH, Rademaker AW, et al. An enhanced international prognostic index (NCCN-IPI) for patients with diffuse large B-cell lymphoma treated in the rituximab era. Blood. 2014;123(6):837–842.
- Moons KG, Altman DG, Reitsma JB, et al. Transparent reporting of a multivariable prediction model for individual prognosis or diagnosis (TRIPOD): explanation and elaboration. Ann Intern Med. 2015;162(1):W1–73.
- Steyerberg EW. Evaluation of performance. In: Clinical prediction models a practical approach to development, validation, and updating. Springer; 2019. p. 277–308.
- Song JL, Wei XL, Zhang YK, et al. [The prognostic value of the international prognostic index, the national comprehensive cancer network IPI and the age-adjusted IPI in diffuse large B cell lymphoma]. Zhonghua Xue Ye Xue Za Zhi. 2018;39(9):739–744.
- Biccler J, Eloranta S, de Nully Brown P, et al. Simplicity at the cost of predictive accuracy in diffuse large B-cell lymphoma: a critical assessment of the R-IPI, IPI, and NCCN-IPI. Cancer Med. 2018;7(1):114–122.
- Ruppert AS, Dixon JG, Salles G, et al. International prognostic indices in diffuse large B-cell lymphoma: a comparison of IPI, R-IPI, and NCCN-IPI. Blood. 2020;135(23):2041–2048.
- Maurer MJ, Habermann TM, Shi Q, et al. Progression-free survival at 24 months (PFS24) and subsequent outcome for patients with diffuse large B-cell lymphoma (DLBCL) enrolled on randomized clinical trials. Ann Oncol. 2018;29(8):1822–1827.
- Sehn LH, Salles G. Diffuse large B-cell lymphoma. N Engl J Med. 2021;384(9):842–858.
- Zhu J, Yang Y, Tao J, et al. Association of progression-free or event-free survival with overall survival in diffuse large B-cell lymphoma after immunochemotherapy: a systematic review. Leukemia. 2020;34(10):2576–2591.
- Stein HCJK, Warnke RA, Gatter KC, et al. Diffuse large B-cell lymphoma, NOS. In: Swerdlow SHCE, Harris NL, Jaffe ES, Pilari SA, Stein H, Thiele J, Vardiman JW, editors. WHO classification of tumours of hematopoietic and lymphoid tissues. 4th ed. Lyon: International Agency for Research on Cancer; 2008. p. 233–238.
- Gascoyne RDCJKC, Campo E, Rosenwald A, et al. Diffuse large B-cell lymphoma, NOS. In: Swerdlow SHCE, Harris NL, Jaffe ES, Pilari SA, Stein H, Thiele J, Arber DA, Hasserjian RP, Le Beau MM, Orazi A, Siebert R, editors. WHO classification of tumours of hematopoietic and lymphoid tissues. Revised 4th ed. Lyon: International Agency for Research on Cancer; 2017. p. 291–297.
- Cheson BD, Fisher RI, Barrington SF, et al. Recommendations for initial evaluation, staging, and response assessment of Hodgkin and non-Hodgkin lymphoma: the Lugano classification. J Clin Oncol. 2014;32(27):3059–3068.
- Chotipanich CPC, Kunawudhi A, Theerakulpisut D. Appropriate use of F18-FDG PET/CT in oncology, cardiology, and neurology in Thailand: report and recommendations from the health intervention and technology assessment program. J Med Assoc Thai. 2019;102(7):820–839.
- Collins GS, Ogundimu EO, Altman DG. Sample size considerations for the external validation of a multivariable prognostic model: a resampling study. Stat Med. 2016;35(2):214–226.
- Harrell FE J, Califf R, Pryor D, et al. Evaluating the yield of medical tests. JAMA. 1982;247(18):2543–2546.
- Newson RB. Comparing the predictive powers of survival models using Harrell‘s C or Somers’ D. Stata J. 2010;10(3):339–358.
- Klapper W, Kreuz M, Kohler CW, et al. Patient age at diagnosis is associated with the molecular characteristics of diffuse large B-cell lymphoma. Blood. 2012;119(8):1882–1887.
- Gordon LI, Andersen J, Colgan J, et al. Advanced diffuse non-Hodgkin‘s lymphoma. Analysis of prognostic factors by the international index and by lactic dehydrogenase in an intergroup study. Cancer. 1995;75(3):865–873.
- Montalban C, Diaz-Lopez A, Dlouhy I, et al. Validation of the NCCN-IPI for diffuse large B-cell lymphoma (DLBCL): the addition of beta2 -microglobulin yields a more accurate GELTAMO-IPI. Br J Haematol. 2017;176(6):918–928.
- Gao R, Liang JH, Wang L, et al. Low serum cholesterol levels predict inferior prognosis and improve NCCN-IPI scoring in diffuse large B cell lymphoma. Int J Cancer. 2018;143(8):1884–1895.
- Kang J, Yoon S, Suh C. Relevance of prognostic index with beta2-microglobulin for patients with diffuse large B-cell lymphoma in the rituximab era. Blood Res. 2017;52(4):276–284.
- Feng YX, Su LP. [Prognostic value of international prognostic index, revised international prognostic index, enhanced international prognostic index and Grupo Espanol de Linfomas/trasplante autologo de medula osea-international prognostic index for diffuse large B-cell lymphoma]. Zhonghua Zhong Liu Za Zhi. 2020;42(11):949–954.