
ABSTRACT
Objective:
Myelodysplastic syndrome (MDS) is a clonal bone marrow disorder with a high propensity to develop into acute myeloid leukemia (AML). Although abnormal microRNA expression has been implicated in MDS, the exact role of miR-181a-2-3p has not been entirely elucidated. Here, we investigated miR-181a-2-3p levels in bone marrow (BM), and described its utility as a potential indicator for MDS diagnosis and prognosis.
Methods:
We evaluated miR-181a-2-3p expression in BM samples of 54 newly diagnosed MDS cases, 16 sAML patients and 32 healthy donors and then assessed its association with clinical characteristics and its potential value for MDS diagnosis and prognosis.
Results:
Compared with healthy controls, miR-181a-2-3p levels were decreased in the total cohort of MDS patients. Additionally, in MDS patients with secondary AML (sAML), miR-181a-2-3p was over-expressed relative to levels in those without this form. The areas under the curve of receiver operating characteristic curves were 0.700 and 0.750 to distinguish MDS patients from controls and sAML from newly diagnosed MDS, respectively. Kaplan–Meier analysis showed a positive correlation between miR-181a-2-3p expression and overall survival (OS). Further, multivariate analysis indicated that miR-181a-2-3p was an independent prognostic index for MDS with respect to OS.
Conclusion:
Decreased miR-181a-2-3p expression in MDS patients may be considered as one of the underlying markers reflecting MDS progression and prognosis.
1. Introduction
Myelodysplastic syndrome (MDS), a group of malignant clonal disorders derived from hematopoietic stem cells, exhibit the characteristics of different degrees of ineffective hematopoiesis in bone marrow (BM) and hypocytosis, which are prone to progression to secondary acute myeloid leukemia (sAML) [Citation1,Citation2]. MDS is the most common hematological malignancy among the elderly (over 70 years old), often presenting with poor therapeutic response and shortened life span, seriously threatening human health [Citation3,Citation4]. Although the pathogenesis of MDS and the mechanism of transformation to AML are still unclear, somatic mutations, abnormal gene expression, epigenetic aberrations, molecular cytogenetic alterations, abnormal hematopoietic microenvironment, and defective immunologic mechanisms had been implicated [Citation5–7]. Because of the high heterogeneity of MDS results in different natural courses and clinical outcomes, it is paramount to establish valid risk and prognostic stratification tools using effective and sensitive biomarkers to guide management. Increasing data support the notion of a specific gene expression profile in MDS patients that can distinguish this disease from a normal condition or promote MDS-to-AML transformation, and a difference in gene expression between relatively low-risk and high-risk groups has been identified [Citation8,Citation9]. It is therefore necessary to identify novel molecular markers for the diagnosis and prognostic assessment of MDS.
MicroRNAs, a series of small non-coding RNAs, play an indispensable role in the cause and evolution of MDS [Citation10]. These molecules act via post-transcriptional regulation of gene expression (e.g. degrading target genes or inhibiting translation) and hematopoietic regulation at various stages (e.g. maturation, proliferation, differentiation, apoptosis, and leukemogenesis) [Citation11,Citation12]. In addition, miRNAs can serve as oncogene or tumor suppressor genes that are involved in the pathogenesis of MDS and sAML transformation. Therefore, they might be instrumental in diagnosis, prognostic assessments, and target therapy decisions for hematologic malignancies [Citation10,Citation13].
MiRNA-181a was reported to play crucial roles in various types of tumors. On the one hand, some studies found that upregulated miR-181a can drive the carcinogenic process in several cases (e.g. hepatocellular carcinoma cell, and breast cancer) [Citation14–17]. On the other hand, miR-181a has important functions in suppressing tumor development (e.g. non-small cell lung cancer and glioblastoma) [Citation18,Citation19]. In particular, the involvement of miR-181a-2-3p in the progression of solid tumors, such as cervical cancer [Citation20], papillary thyroid cancer [Citation21], and glioblastoma [Citation22], has been clearly proven in several studies. Chhabra R. found that miR-181a-2-3p is down-regulated in cervical cancer cells and plays an important role in maintaining the self-renewal of cervical cancer stem cells by affecting the PI3K/AKT/mTOR axis [Citation20]. In MDS, PI3K/AKT/mTOR axis is also one of the significant pathways regulating cells apoptosis [Citation23]. In our previous research, we performed miRNA microarray analysis to find differentially expressed microRNAs between MDS patients and normal controls, which showed that miR-181a-2-3p is downregulated [Citation24], but the role of this molecule in MDS has not been fully elucidated. In this work, we investigated the difference in miR-181a-2-3p levels between MDS patients and healthy individuals and asked whether this microRNA has diagnostic and prognostic significance for MDS.
2. Materials and methods
2.1. Ethics compliance
The study was approved by the Human Ethics Committee of The First Affiliated Hospital of Guangxi Medical University. Informed consent was obtained from all participants according to the Declaration of Helsinki.
2.2. Patients
BM samples were acquired from 32 healthy donors, 54 newly diagnosed MDS cases and 16 sAML patients transformed from MDS, from 2012 to 2017 in The First Affiliated Hospital of Guangxi Medical University, China. Thirty-two healthy volunteers [median age, 32 years; age range, 24–47 years; 15 males and 17 females] excluded hematopoietic stem cell diseases and major organic diseases. Diagnosis was based on the recommended criteria of the World Health Organization (2016). The prognostic scores were calculated using the Revised International Prognostic Scoring System (IPSS-R). Patient clinical information is summarized in .
Table 1. Clinical features of MDS patients.
2.3. RNA isolation
Bone marrow mononuclear cells (BM-MNCs) were isolated from 2 ml BM samples from 70 patients and 32 healthy individuals by lymphocyte separation solution (Solaibao, Beijing, China) with density gradient centrifugation. Total RNA was extracted from BM-MNCs using TRIzol reagent (Invitrogen, Carlsbad, CA, USA) following the manufacturer’s protocol.
2.4. qRT–PCR verification
Total RNA was reverse transcribed to cDNA using M-MuLV Reverse Transcriptase (Enzymatics, USA). Sense and antisense primers of target genes were designed by Primer 5.0. The primers used in our study were as follows: U6 forward (5′GCTTCGGCAGCACATATACTAAAAT3′), U6 reverse (5′CGCTTCACGAATTTGCGTGTCAT3′), miR-181a-2-3p forward (5′GGACCACTGACCGTTGAC3′), miR-181a-2-3p reverse (5′CAGTGCGTGTCGTGGAG3′). Real-time PCR was performed in the QuantStudio™ 5 Real-time PCR System (Applied Biosystems, USA) with conditions as follows: 10 min at 95°C; then, 40 cycles of 10 s at 95°C and 60 s at 60°C. Relative quantification was performed through the 2−ΔΔCt method and U6 was used for normalization.
2.5. Statistical analysis
Due to the non-normally distributed data, the Kruskal–Wallis test was conducted to analyze continuous variables, whereas the Pearson Chi-square and Fisher’s exact tests were performed for categorical variables. The receiver operating characteristic (ROC) curve and area under the curve (AUC) were served to determine the accuracy of miR-181a-2-3p for diagnosing MDS and sAML. The Kaplan–Meier method and log-rank test were carried out to calculate the cumulative survival rates, and Cox proportional hazard regression models based on univariate and multivariate analysis were constructed to determine the impact of various factors on the overall survival (OS). All data were statistically analyzed and visualized with the assistance of SPSS 23.0 (SPSS Inc., Chicago, IL, USA) and GraphPad Prism 8.0 (GraphPad Software Inc., La Jolla, CA, USA), respectively. Statistical significance was set at P < .05.
3. Results
3.1. MiR-181a-2-3p expression in each subgroup of MDS
The results of real-time PCR are represented in . MDS patients had a significantly lower level of miR-181a-2-3p expression than healthy individuals (P = .001, (A)). Meanwhile, miR-181a-2-3p expression in newly diagnosed MDS patients was downregulated compared to levels in both sAML patients (P = .003) and normal controls (P = .000), whereas miR-181a-2-3p levels in sAML were not significantly different from those in control subjects ((B)).
Figure 1. Expression of miR-181a-2-3p in each group. (A) Relative expression of miR-181a-2-3p in MDS patients (n = 70) and normal controls (n = 32). (B) Relative expression of miR-181a-2-3p in the newly diagnosed MDS group (n = 54), sAML group (n = 16), and normal controls group (n = 32). (C) Relative expression of miR-181a-2-3p in the relatively low risk group (n = 16), the relatively high risk group (n = 38), sAML group (n = 16), and normal controls group (n = 32). (D) Relative expression of miR-181a-2-3p in each WHO subtype of MDS patients.
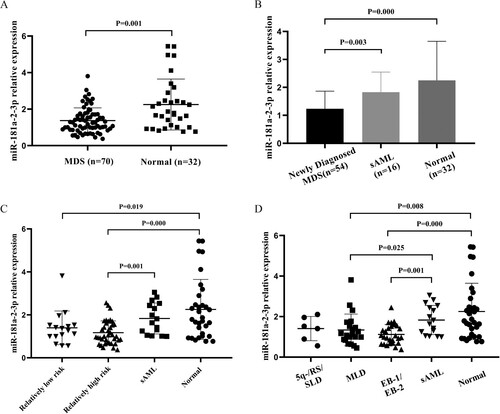
Seventy patients were divided into three and four subgroups separately based on IPSS-R and WHO classifications, and we observed significant differences between case subgroups, as well as between case subgroups and the control group ((C,D)). In particular, compared with normal controls, miR-181a-2-3p expression in both the relatively low (P = .019) and high risk group (P = .000) is downregulated. In the meantime, the latter is also decreased compared with sAML patients (P = .001). Moreover, both the sAML and normal group had higher miR-181a-2-3p expression than the MLD group and EB-1/EB-2 group (P < .05).
3.2. Correlation between miR-181a-2-3p and clinical parameters of MDS patients
All MDS cases were assigned to a low (n = 35) and high (n = 35) expression group based on the median miR-181a-2-3p level. The associations between miR-181a-2-3p and clinical characteristics are shown in . However, no significant relationship was found between miR-181a-2-3p and any clinical parameters.
Table 2. Comparison of clinical and molecular characteristics with miR-181-2-3p expression in MDS patients.
3.3. Diagnostic evaluation of miR-181a-2-3p for hierarchical diagnosis
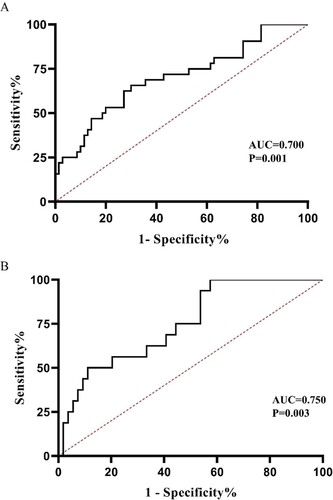
The ROC curve for the miR-181a-2-3p level to discriminate MDS patients from normal controls revealed that the AUC was 0.700 (95% CI = 0.586–0.813, P = .001; sensitivity = 65.6%; specificity = 70.0%). Furthermore, the AUC for differentiating sAML from newly diagnosed MDS was 0.750 (95% CI = 0.622–0.878, P = .003; sensitivity = 100%; specificity = 57.4%). These results suggested that miR-181a-2-3p expression might be a reference for MDS and sAML diagnosis, and a valuable biomarker for hierarchical diagnosis ().
Figure 2. Areas under the curve (AUC) of receiver operating characteristic (ROC) curves using miR-181a-2-3p for (A) differentiating patients with MDS from normal controls, and (B) distinguishing sAML from newly diagnosed MDS patients.
3.4. Prognostic value of miR-181a-2-3p in MDS
To achieve a greater effect on prognostic assessment and risk stratification, we excluded sAML cases from 70 MDS patients and then divided 54 newly diagnosed MDS patients into two groups based on the median expression of miR-181a-2-3p. Kaplan–Meier survival curves revealed that cases with low miR-181a-2-3p expression had worse OS than those with high expression (). In the Cox proportional hazard model (), univariate analysis suggested that low miR-181a-2-3p predicted unfavorable prognosis (HR 2.264, 95% CI 1.186–4.319, P = .013). Further, multivariable analysis indicated that miR-181a-2-3p expression was an independent prognostic factor for OS in newly diagnosed MDS patients.
Figure 3. Kaplan–Meier survival curves of newly diagnosed MDS patients (n = 54) with different levels of miR-181a-2-3p expression.
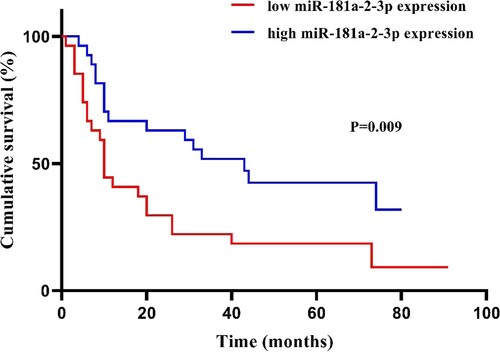
Table 3. Uni/multivariate analysis of overall survival for MDS patients excluded sAML.
4. Discussion
Several studies have considered miRNAs as principal drivers that might trigger the progression of various blood system diseases. Thus, exploring the altered expression of specific miRNAs over the disease course can provide biomarkers and therapeutic targets for hematologic disorders. There are six members in the miR-181 family, specifically miR-181a-1/2, miR-181b-1/2, miR-181c and miR-181d [Citation14]. Interestingly, owing to their high sequence homology, miR-181a-1 and miR-181a-2 have identical mature sequence [Citation25]. It is well established that miR-181a takes part in diverse biological processes, like cell cellular metabolism, multiplication, apoptosis, immune response, and drug-resistance [Citation25–27].
To the best of our knowledge, studies on differences in miR-181a-2-3p levels between MDS patients and control individuals are rare, and this problem was addressed for the first time in the current study. We discovered that the average of BM miR-181a-2-3p expression was significantly decreased in MDS patients. In the subgroups based on IPSS-R, both the relatively low and high risk MDS groups were greatly lower than healthy controls, indicating that miR-181a-2-3p may be involved in the pathogenesis of MDS as a form of epigenetic changes.
It is also demonstrated that miR-181a-2-3p level in sAML patients was higher than that in new diagnosed MDS cases, whereas it was not significantly different from that in control subjects. Similarly, concerning malignant myeloid neoplasms, previous studies have corroborated its function in pathogenesis. Guo et al. revealed that some members of the miR-181 family (i.e. miR-181a-5p, miR-181d-5p and miR-181b-5p) were overexpressed in MDS patients that progress to AML, relative to levels in those who do not, and that this could distinguish between the two groups [Citation28]. Besides, there is substantial evidence proving the miR-181 members could serve as regulators of myeloid differentiation and participate in the pathogenesis of AML. In patients with French-American-British (FAB) M1, M2, and M3 subtypes of AML, miR-181 family members were increased, which could serve as potential therapeutic targets to regulate myeloid differentiation and drug-resistance [Citation29,Citation30]. In the pathogenesis of AML, the trend of up-regulation of miR-181 expression may be consistent with the up-regulation of miR-181a-2-3p in the transition from MDS to sAML. Based on literature and our results, we speculated that with the progress of disease and clone evolution, the reversible epigenetic modification occurs. Georgantas et al. suggested that overexpressed miR-181 family may play a negative regulatory role in hematopoiesis, such as proliferation and the differentiation of stem/progenitor cells and development of megakaryocytes [Citation31]. The transition from MDS to sAML is a complex and multifactorial process, and its subsequently upregulation may exert a significant impact on accelerating the process probably by impairing myeloid maturation, differentiation, and immune regulation [Citation28,Citation29,Citation32].
Furthermore, the ROC curve indicated that miR-181a-2-3p has reliable functions in distinguishing not only MDS subjects from control cases, but also sAML patients from newly diagnosed MDS cases. The AUC of the former is 0.700 and the latter is 0.750, indicating a good diagnostic accuracy of miR-181a-2-3p. In the correlation analysis of clinical parameters, it was found that miR-181a-2-3p expression was not statistically correlated with clinical parameters, probably because the sample size was not large enough. However, we observed that lower miR-181a-2-3p expression was strongly associated with poor clinical outcomes such that it can be considered as an independent adverse prognostic factor, suggesting that it is a way that may be independent of clinically relevant phenotypes to predict clinical outcomes. Prognostic stratification such as IPSS-R is widely used in clinical practice, and we found a new prognostic molecular marker different from IPSS-R criteria, which might guide patients’ prognostic stratification in a new way. We believe that miR-181a-2-3p may thus be used as a potential indicator for risk stratification, hierarchical diagnosis, and prognostic prediction.
In summary, our study clarified that the role of miR-181a-2-3p seems to be two-fold in MDS, which is strongly dependent on the disease course and the developmental stage of hematopoietic stem cell. During the early period of MDS, miR-181a-2-3p might serve as a tumor suppressor, with a lower level observed compared to that in the control group. However, with clonal evolution, its overexpression potentially contributes to MDS-to-AML transformation. In the present study, we not only provided a basis that it may be a new biomarker for hierarchical diagnosis and outcome prediction, but also provided insights into the pathogenesis or progress of MDS. Nevertheless, for a heterogeneous disorder, the current study has assessed a relatively small panel of patients. We will further assess a larger MDS group to confirm the results and make the conclusion more reliable. Besides, continuing explorations in vitro and in vivo are needed to probe into the precise function and mechanism of miR-181a-2-3p in MDS.
5. Conclusion
MiR-181a-2-3p is decreased in MDS patients whose downregulation correlates with a greater risk of poor prognosis. It might thus be a crucial biomarker for diagnosis and prognostic prediction.
Disclosure statement
No potential conflict of interest was reported by the author(s).
Additional information
Funding
References
- Tefferi A, Vardiman JW. Myelodysplastic Syndromes. N Engl J Med. 2009;361:1872–1885.
- Nolte F, Hofmann W-K. Molecular mechanisms involved in the progression of myelodysplastic syndrome. Future Oncol. 2010;6(3):445–455.
- Milunovic V, Rogulj IM, Planinc-Peraica A, et al. The role of microRNA in myelodysplastic syndromes: beyond DNA methylation and histone modification. Eur J Haematol. 2016;96(6):553–563.
- Pfeilstöcker M, Tuechler H, Sanz G, et al. Time-dependent changes in mortality and transformation risk in MDS. Blood. 2016;128(7):902–910.
- Papaemmanuil E, Gerstung M, Malcovati L, et al. Clinical and biological implications of driver mutations in myelodysplastic syndromes. Blood. 2013;122(22):3616–3627.
- Pati H, Veetil KK. Myelodysplastic syndrome/myeloproliferative neoplasm (MDS/MPN) overlap syndromes: molecular pathogenetic mechanisms and their implications. Ind J Hematol Blood Transf. 2019;35(1):3–11.
- Cargo CA, Rowbotham N, Evans PA, et al. Targeted sequencing identifies patients with preclinical MDS at high risk of disease progression. Blood. 2015;126(21):2362–2365.
- Theilgaard-Mönch K, Boultwood J, Ferrari S, et al. Gene expression profiling in MDS and AML: potential and future avenues. Leukemia. 2011;25:909–920.
- Pellagatti A, Fidler C, Wainscoat JS, et al. Gene expression profiling in the myelodysplastic syndromes. Hematology. 2005;10(4):281–287.
- Kuang X, Chi JLW. Deregulated microRNA expression and its pathogenetic implications for myelodysplastic syndromes. Hematology. 2016;21(10):593–602.
- Wallace JA, O’Connell RM. MicroRNAs and acute myeloid leukemia: therapeutic implications and emerging concepts. Blood. 2017;130(11):1290–1301.
- Alemdehy MF, Erkeland SJ. MicroRNAs: key players of normal and malignant myelopoiesis. Curr Opin Hematol. 2012;19(4):261–267.
- Liao R, Xu Y, Chen M, et al. Molecular mechanism of microRNA involvement in genesis of myelodysplastic syndrome and its transformation to acute myeloid leukemia. Hematology. 2013;18(4):191–197.
- Ji J, Yamashita T, Budhu A, et al. Identification of microRNA-181 by genome-wide screening as a critical player in EpCAM-positive hepatic cancer stem cells. Hepatology. 2009;50(2):472–480.
- Niu J, Xue A, Chi Y, et al. Induction of miRNA-181a by genotoxic treatments promotes chemotherapeutic resistance and metastasis in breast cancer. Oncogene. 2016;35(10):1302–1313.
- Bisso A, Faleschini M, Zampa F, et al. Oncogenic miR-181a/b affect the DNA damage response in aggressive breast cancer. Cell Cycle. 2013;12(11):1679–1687.
- Taylor MA, Sossey-Alaoui K, Thompson CL, et al. TGF-beta upregulates miR-181a expression to promote breast cancer metastasis. J Clin Invest. 2013;123(1):150–163.
- Huang P, Ye B, Yang Y, et al. MicroRNA-181 functions as a tumor suppressor in non-small cell lung cancer (NSCLC) by targeting Bcl-2. Tumour Biol. 2015;36(5):3381–3387.
- Huang SX, Zhao ZY, Weng GH, et al. Upregulation of miR-181a suppresses the formation of glioblastoma stem cells by targeting the Notch2 oncogene and correlates with good prognosis in patients with glioblastoma multiforme. Biochem Biophys Res Commun. 2017;486(4):1129–1136.
- Chhabra R. let-7i-5p, miR-181a-2-3p and EGF/PI3K/SOX2 axis coordinate to maintain cancer stem cell population in cervical cancer. Sci Rep. 2018;8(1):7840.
- Liu T, You X, Sui J, et al. Prognostic value of a two-microRNA signature for papillary thyroid cancer and a bioinformatic analysis of their possible functions. J Cell Biochem. 2018. Online ahead of print. doi:10.1002/jcb.27993.
- Rahul Agrawal PP, Jha P, Dwivedi V, et al. Hypoxic signature of microRNAs in glioblastoma: insights from small RNA deep sequencing. BMC Genomics. 2014;15(1):686.
- Yin J, Li X, Zhang Z, et al. SPAG6 silencing induces apoptosis in the myelodysplastic syndrome cell line SKM–1 via the PTEN/PI3K/AKT signaling pathway in vitro and in vivo. Int J Oncol. 2018;53(1):297–306.
- Wan C, Wen J, Huang Y, et al. Microarray analysis of differentially expressed microRNAs in myelodysplastic syndromes. Medicine (Baltimore). 2020;99(27):e20904.
- Henao-Mejia J, Williams A, Goff LA, et al. The microRNA miR-181 is a critical cellular metabolic rheostat essential for NKT cell ontogenesis and lymphocyte development and homeostasis. Immunity. 2013;38(5):984–997.
- Braicu C, Gulei D, Raduly L, et al. Altered expression of miR-181 affects cell fate and targets drug resistance-related mechanisms. Mol Aspects Med. 2019;70:90–105.
- Rezaei T, Amini M, Hashemi ZS, et al. microRNA-181 serves as a dual-role regulator in the development of human cancers. Free Radic Biol Med. 2020;152:432–454.
- Guo Y, Strickland SA, Mohan S, et al. MicroRNAs and tRNA-derived fragments predict the transformation of myelodysplastic syndromes to acute myeloid leukemia. Leuk Lymphoma. 2017;58(9):1–15.
- Su R, Lin HS, Zhang XH, et al. MiR-181 family: regulators of myeloid differentiation and acute myeloid leukemia as well as potential therapeutic targets. Oncogene. 2015;34(25):3226–3239.
- Nanbakhsh A, Visentin G, Olive D, et al. miR-181a modulates acute myeloid leukemia susceptibility to natural killer cells. Oncoimmunology. 2015;4(12):e996475.
- Sokol L, Caceres G, Volinia S, et al. Identification of a risk dependent microRNA expression signature in myelodysplastic syndromes. Br J Haematol. 2011;153(1):24–32.
- Cattaneo M, Pelosi E, Castelli G, et al. A miRNA Signature in Human Cord Blood Stem and Progenitor Cells as Potential Biomarker of Specific Acute Myeloid Leukemia Subtypes. J Cell Physiol. 2015;230(8):1770–1780.