
Abstract
Course: Undergraduate Communication Research Methods
Objectives: This activity introduces students to data sets by demonstrating how individual answers form data for classroom analysis. Students learn the process of variable operationalization, measures of central tendency, and data dispersion. This activity transforms the idea of “data” from an abstract concept to a concrete one by engaging students in an empirical learning activity.
Introduction and Rationale
Among the many difficulties beleaguering the communication research methods instructor is the problem of contextualizing abstract ideas. Comprehension of variable operationalization, the utility of the measures of central tendency, measures of dispersion, and the visual distribution of data sets are difficult, since students have not handled data. Students are also intimidated by statistical concepts, and erect barriers to their own methodological understanding (Denham, Citation1997). As a result, the process of conceptualizing a data set is frequently experienced as a cryptic and arcane procedure.
Educators should provide examples that go beyond demonstrations of relevance and invite students to interact with course content (Kramer & Pier, Citation1999; Sowey, Citation2001). Wulff and Wulff (Citation2004) report interactive examples are essential to achieving student learning outcomes. Inviting students to apply concepts is essential for establishing personal relevance of statistical concepts (Maier & Curtin, Citation2005). Making methodology and the process of “doing methods” concrete is important since concepts are abstract and “applications are not necessarily apparent” (p. 360). For example, students may learn methods concepts as if they were separate, single vocabulary terms, but struggle to piece the larger puzzle together. Lectures should illustrate how concepts relate to the greater methodological picture, using simple language.
This article makes several unique contributions to communication literature. First, compounding the difficulties associated with teaching research methods is the relative dearth of published materials related to the subject. When searching through 10 recent issues of Communication Teacher, eight activities are suggested for research methods. Of these, three (see Morrow, Kelly, & Skolits, Citation2013; Nelson & Fife, Citation2013; Rockwell, Citation2012) provide suggestions suitable for teaching quantitative methods. Previous publications focus on communicating abstract methodological concepts (see Andrews, Citation2013; Griffin & Cohen, Citation2012; Kelly & Davis, Citation2011; Tolman, Citation2013; Zaslow, Citation2012) rather than experiential activities and data collection.
This activity combines discussion of statistical concepts with application to real scenarios. After completion, students should understand several foundational research concepts. Ultimately, students will tangibly experience variable operationalization and learn how simple calculations (mean, median, mode, range, and standard deviation) provide meaningful information to researchers.
The Activity
Preparation and Materials
This single class activity asks students to rate the “awesomeness” of three slam dunks performed by NBA player Blake Griffin using an ambiguous scale. Essential materials include: a computer connected to a projector, the Internet, and Microsoft Excel.Footnote2 Preparation consists of developing a spreadsheet for the class presentation and searching the Internet for video stimuli for class comparison (our stimuli consisted of three video clips of NBA star Blake Griffin dunking on opponents). However, an instructor could find three photos of kittens, bunnies, puppies, or babies and ask students to rate them according to their levels of “cuteness.”
Begin preparations by creating an Excel spreadsheet. For instructors proficient in spreadsheet software, virtually no preparation time would be required for the activity beyond finding appropriate stimulus on the web. For educators less familiar with spreadsheet software, the necessary Excel formulas are provided to minimize preparation time. The following information included in each of the parentheses is the Excel formula needed to calculate mean, median, and mode.
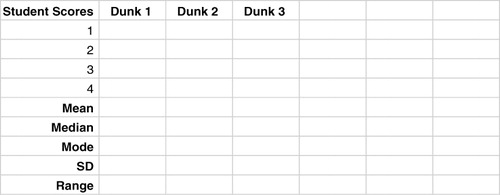
First, instructors should create three columns and label them “Dunk 1,” “Dunk 2,” and “Dunk 3,” respectively. Be sure to leave 20+ cells to allow space to record students' responses. At the bottom of these three columns, input Excel formulas to calculate the mean (=AVERAGE(A1:A5)), median (=MEDIAN(A1:A5)), mode (=MODE(A1:A5)), and standard deviation (=STDEV.S(A1:A5)) of each column's scores. Be sure to label the columns accordingly in the row below so students can see how their scores create each of these methodological terms. STDEV.S is the formula for calculating the standard deviation of a sample. STDEV.P is the formula for taking the standard deviation of a population. The difference is that for STDEV.S, the denominator is (n–1). For STDEV.P, the denominator is just (n). Although there will not be a column for the range, we recommend writing it on the spreadsheet so you remember to include it in the exercise. In the end, your spreadsheet should look something like our example below.
In-Class Activity Delivery
This activity is best conducted after introducing students to the idea of operationalization, measures of central tendency, and defining range and standard deviation. Begin class with a short review of each of these methodological concepts. Be sure to highlight the need for operational definitions of concepts for valid and reliable measurement.
After completing the short review of ideas, introduce the students to the “awesomeness scale.” Inform students that the scale runs from 1 to 50, with 1 being least awesome and 50 being most awesome. Next, open the computer web browser to the appropriate URL to watch the three preselected videos; ask students to rate each dunk according to the awesomeness scale by “calling out their ratings” for each dunk (input scores into the spreadsheet as they read scores aloud). Make sure the computer screen is visible over the projector so students can observe the changing values in the mean, median, mode, and standard deviation as data are recorded. After all data are entered, tell the students that each of their individual scores combined to create the “awesomeness” data set.
Next, transition into a discussion and encourage students to apply methodological terms and concepts to the larger class discussion. To understand the mode, ask: “What is the most frequently occurring number in our data set?” Next, ask students to identify the median. Encourage them to share how they discovered the median score. During this process, mention how extremely high or low scores impacted the mean. You may want to add extreme scores to illustrate changes in the larger data set. Remind them that the mean score is the most susceptible to extreme scores while the median is more resistant. Help students recognize measures of dispersion. Lead into a discussion of the range by asking what the lowest and the highest scores were. Point out the calculated standard deviation, illustrating how this score compares to the mean score. Explain the range and standard deviation as measures of dispersion, and illustrate how students' scores vary across the data set (Keyton, Citation2011). You should also demonstrate how two-thirds of the data from dunk ratings fell within ±1 SD from the mean.
End the first round of discussion by asking the class to explain why scores seemed to vary so much (ask students why the differences were so substantial/what criteria they used to evaluate the awesomeness of each dunk). This discussion reveals that students operationalized “awesomeness” differently. As a class, agree upon a single definition. During our class discussion, students agreed that the slam dunk awesomeness is defined by three criteria: (a) degree of difficulty, (b) the height of the player's jump, and (c) the force exerted on the rim. As one student said, “It's only awesome if he throws it down hard!” After students provide criteria regarding what constitutes the most awesome dunk, suggest that they have operationalized “awesomeness.”
Once you have defined how “awesomeness” is measured, have students rate the dunks a second time, according to the class definition. Collect and enter data until students note a consensus on the “most awesome” dunk has emerged. While the spread of scores will vary, the range and standard deviation will significantly decline. In our class, the scores dropped by more than 50%. In the concluding discussion, point out that the operationalization of “awesomeness” helped to standardize the measurement scale.
Debriefing
This data-set creation exercise provides an excellent opportunity to bolster students' comprehension of abstract methodological concepts by applying them to a data set. After completion, students should understand measures of central tendency and dispersion. They will also have a visual framework for how data points impact statistical scores. Typically, students also comprehend the role of variable operationalization after defining how “awesome dunks” are measured. Anecdotal evidence suggests that the activity helped students to remember measures of central tendency and dispersion, and provided them a visual framework for the data collection and analysis process. Our students commented on the exercise's effectiveness after completing the activity. One student shared, “I could see the data and data collection in action”—a genuine benefit for undergraduates attempting to navigate the research methods landscape. Another student in a post-activity interview said:
My feeling toward statistics coming into the class, and my bad relationship with it, made me feel like this was going to be like my statistics class all over again. I worried that I would be feeling negative about statistics and statistical procedures all semester. But SPSS activities like this awesomeness one helped me see how the numbers related to the defined terms. The activity made “data” less confusing.
Appraisal
This activity continues to be a successful research methods exercise. Students enjoy participating in research, data-set development, and engaged in lively discussion over variable operationalization. Students reported that this exercise helped them learn operationalization, measures of central tendency, and measures of dispersion. Another student shared, “once we decided what awesomeness was and how everyone's answers were relating to each other, I could see how the numbers illustrated the definitions. It was hard when we were doing it without a baseline definition, but once we decided on a definition, it all became clear. I understood what it meant for a dunk to be awesome and I saw how the numbers were closer together and farther apart.”
Successful instructors should be comfortable discussing methodological details, skilled at responding to questions, developing additional examples, and providing answers in a less-structured environment. This exercise requires 30 minutes to complete, but could be abbreviated by having only a subset of the class participate in the rating process. Alternatively, the exercise could be expanded to facilitate a detailed discussion of measures of central tendency or measurement reliability, by incorporating multiple measurement scales.
Notes
2 As an alternative to Excel, you could use SPSS or other statistical software if you have access and necessary expertise.
References and Suggested Readings
- Andrews, U. (2013). House rules: Using the television series “House” to teach research ethics. Communication Teacher, 27, 152–155. doi:10.1080/17404622.2013.782417
- Denham, B. (1997). Teaching research methods to undergraduates. Journalism and Mass Communication Educator, 51, 54–62. doi:10.1177/107769589605100407
- Griffin, T., & Cohen, D. (2012). Critical reading of the Web. Communication Teacher, 26, 5–9. doi:10.1080/17404622.2011.625360
- Kelly, S., & Davis, M. J. (2011). Just another brick in the wall … or not? A paradigm introduction activity. Communication Teacher, 25, 222–227. doi:10.1080/17404622.2011.601724
- Keyton, J. (2011). Communication research: Asking questions, finding answers (3rd ed.). New York, NY: McGraw Hill.
- Kramer, M. W., & Pier, P. M. (1999). Students' perceptions of effective and ineffective communication by college teachers. Southern Communication Journal, 65, 16–33. doi:10.1080/10417949909373153
- Maier, S. R., & Curtin, P. A. (2005). Self-efficacy theory: A prescriptive model for teaching research methods. Journalism & Mass Communication Educator, 59, 352–364.
- Morrow, J. A., Kelly, S., & Skolits, G. (2013). Reducing power differentials in the classroom using student-based quantitative research scenarios: Applications in undergraduate and graduate research methods classrooms. Communication Teacher, 27, 156–160. doi:10.1080/17404622.2013.775469
- Nelson, C. L., & Fife, E. M. (2013). Ratemyprofessors.com: A validity exercise. Communication Teacher, 27, 6–10. doi:10.1080/17404622.2012.730621
- Rockwell, S. C. (2012). Ghost hunting as a means to illustrate scientific methodology and enhance critical thinking. Communication Teacher, 26, 158–162. doi:10.1080/17404622.2011.650704
- Sowey, E. R. (2001). Striking demonstrations in teaching statistics. Journal of Statistics Education, 9(1). Retrieved from http://www.amstat.org/publications/jse/v9n1/sowey.html
- Tolman, E. G. (2013). Observing cell phone use and enhancing collaborative learning using a wiki. Communication Teacher, 27, 16–20. doi:10.1080/17404622.2012.737922
- Wulff, S. S., & Wulff, D. H. (2004). “Of course I'm communicating, I lecture every day”: Enhancing teaching and learning in introductory statistics.” Communication Education, 53(1), 93–102. doi:10.1080/0363452032000135797
- Zaslow, E. (2012). Using Barbie stories to develop and understanding of polysemy and encoding/decoding. Communication Teacher, 26, 194–198. doi:10.1080/17404622.2012.668202