
Abstract
In plants, the accelerated production of reactive oxygen species (ROS) is a common response to different stresses. We developed a computer method of leaf image analysis to automatically quantify the and H2O2 staining patterns in leaves. The quantification of histochemically detected ROS is given as a percentage of stained area partitioned according to the staining intensity and hence
accumulation. Thus, this method expands the routine histochemical detection of ROS in situ. The same procedure can be also used to assess necrotic infection symptoms. In plants infected with necrotizing pathogens leaves can be simultaneously examined for pathogen-induced
and H2O2 accumulation and infection development. This procedure allows rapid and accurate examination of many leaves and provides an advantage over the routine visual assessment of in situ histochemical detection of ROS and infection symptom development.
Introduction
In plants, the enhanced production of reactive oxygen species (ROS), especially superoxide anion radical () and hydrogen peroxide (H2O2), is induced by numerous environmental factors, and ROS have been documented to play a profound role in pathogenesis and in acclimation to abiotic stress (Pitzschke et al. Citation2006; Bolwell & Daudi Citation2009). However, due to their high reactivity and extremely short lifetimes the study of ROS production in plants is very difficult. The quantitative biochemical and chemiluminescence methods developed for ROS determination do not provide information on their localization in plant tissues and the assessment by microscopy is limited to small tissue sections. Moreover, literature data on actual H2O2 concentrations show great variability (Cheeseman Citation2006). The histochemical detection of ROS provides the opportunity to identify the specific sites of their in situ production in plant tissues, but it imposes limitations on their quantitative analysis. The interpretation of results often relies on subjective visual estimation of stained areas yielding only qualitative data. However, to precisely describe the differences in staining patterns between experimental groups some form of quantification is required. The methods based on dye extraction from the stained tissue are time and labor consuming.
The assessment of pathogen-induced disease severity often presents a similar problem. The most popular method to quantify infection symptoms is based on visual estimation by using a rating scale. This conventional assessment of infection development on leaves is subjective and its reproducibility is thus limited. Moreover, it may not always be sufficiently sensitive to distinguish discrete symptoms in the affected leaf areas that are difficult to quantify.
In recent years, imaging analysis has proven to be a useful tool in biology. Leaf image analysis is used as an objective and accurate alternative method to quantify the affected leaf areas. It enables to remove the element of human error from such assessments. However, leaf image analysis methods are often based on free available Scion Image application (Goodwin & Hsiang Citation2010) that needs a lot of time-consuming operations or a great level of knowledge in building appropriate macros to extract the region of interest. In this work, quantification of disease symptoms as well as nitroblue tetrazolium (NBT)- and 3,3′-diaminobenzidine (DAB)-stained areas was performed by subjecting leaf images to the automatic analysis, and classification aimed to extract colored regions corresponding to pathogen-induced disease symptoms and stress-induced H2O2 and accumulation, respectively. This method was tested on symptoms of angular leaf spot disease of cucumber as well as H2O2 and
staining patterns on leaves of cucumber and pumpkin plants exposed to infection or abiotic stress.
Materials and methods
Pumpkin (Cucurbita maxima) and cucumber (Cucumis sativus) plants were grown for three weeks in soil under growth chamber conditions (irradiance of 350 µmol m−2 s−1, photoperiod 16/8 h, 23°C). Pumpkin plants were inoculated by touching Erysiphe cichoracearum-infected leaves to target plants or subjected to drought stress by withholding watering for seven days. E. cichoracearum isolate was kindly provided by Dr B. Dyki, Institute of Horticulture, Skierniewice, Poland. Cucumber plants were inoculated with Pseudomonas syringae pv. lachrymans (strain no. IOR 1990 from the Bank of Plant Pathogens, Poznań, Poland). Bacteria for inoculation were cultured for 24 h on King B medium at 28°C with vigorous shaking, and centrifuged at 3500g for 10 min. The bacterial pellet was washed twice and resuspended in sterile water, and adjusted to 107 cfu/ml. Three fully expanded leaves of cucumber were inoculated with bacteria or sterile distilled water (control) using a needleless hypodermic syringe. Alternatively, cucumber plants were treated with 50 mM NaCl for seven days. Control plants were irrigated with water. Based on the rate of relative water content decrease (data not shown) the water stress induced by drought and 50 mM NaCl was classified as moderate (Hsiao Citation1973). The third true leaves of stressed and control pumpkin and cucumber plants were harvested at various times following inoculation and abiotic stress treatment and used for histochemical detection of ROS.
The presence of and H2O2 in detached leaves was detected histochemically using NBT (Unger et al. Citation2005) and DAB (Thordal-Christensen et al. Citation1997), respectively. The quantification of ROS production given as a percentage of stained leaf area was achieved by counting the leaf image pixels with known colors corresponding to the respective reaction products. The images of stained leaves were scanned to JPEG files using a standard flatbed scanner with 200/300 dpi and 24 bit/pixel resolutions and then were analyzed by an algorithm run in MATLAB environment on a Windows computer (Gocławski et al. Citation2012). Briefly, each leaf was placed on a scanner glass in a fixed direction, with the background color differing from the colors found inside of a leaf blade, namely blue for DAB and red for NBT staining. The leaf images were subjected to the automatic analysis and classification aimed to extract colored regions of ROS-mediated histochemical reactions. These regions were then partitioned into three fractions of pixels based on the color saturation corresponding to the staining intensity and hence ROS accumulation, defined as weak, medium, and intense. Before the extraction of selected regions, the leaf area was separated from its background based on the background-specific color. The leaf petiole not considered at the classification stage was eliminated programmatically after the detection as the extreme leaf contour protrusion (Gonzalez & Woods Citation2007). The automatic extraction of ROS reaction regions has been performed by a feed-forward type, two layer neural network (). The network input data were hue and saturation of each pixel taken as the two components of image Hue Saturation Value color space derived from original RGB image. The first network layer represented a self-organizing competitive Winner Takes All (WTA) network (Masters Citation1993; Osowski Citation2006), which divided leaf image pixels into several H, S color subclasses. It was concatenated with a linear network layer merging the color subclasses in two pixel groups, where one of them included ROS-mediated reaction pixels. The self-organization of the first layer preceded the supervised training of linear layer by Widrow-Hoff method applying the binary pattern image data (Masters Citation1993; Osowski Citation2006). The pattern images were prepared manually in Corel Photo-Paint application using the source images representative for the whole tested image population. The image analyser can also be applied without previous training of the network output layer. Then the first layer pixel subclasses can be merged interactively in a dedicated dialog window to achieve final classification of regions stained with DAB and NBT. The algorithm ensured classification with high accuracy as shown by the leaf pixel classification error of 1.42% (Gocławski et al. Citation2012).
![Figure 1. Leaf image analysis for the quantification of histochemically detected ROS: (a) schematic illustration of a two layer feed-forward network for the extraction of colored regions in a leaf blade. Kohonen (WTA [Winner Takes All]) – self-organized Kohonen network layer with M output subclasses, ADALINE – linear network layer with supervised learning, CM – WTA competitive module, W(1), W(2) – the weight arrays of the two network layers, H(P), S(P) – the network input data of each pixel Hue and Saturation, C(P’) =0 or 1 network output data; (b) the flowchart of the leaf image analysis algorithm. ANN, artificial neural network; ROS, reactive oxygen species.](/cms/asset/3315f63a-e3f0-4425-8c23-c7ac9e3079ab/tjpi_a_791729_f0001_oc.jpg)
The algorithm execution is independent of specific color of leaf blade regions. Which color regions are of interest depends only on learning image patterns prepared by specialists or on the human operator selection of hue-saturation clusters recognized by network WTA layer. To avoid the generation of false positive effects, in the proposed algorithm selected leaf blade regions are excluded automatically or optionally from artificial neural network (ANN) color classification (). This task is performed at the end of the pre-processing stage. Arbitrary selected areas to be removed should be individually marked as closed regions created by freehand drawing.
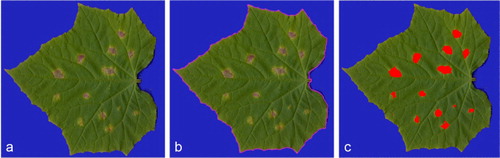
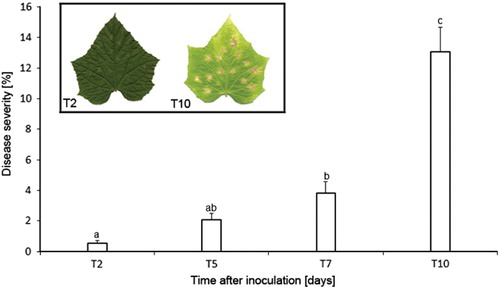
This software was also applicable to quantify P. syringae pv. lachrymans infection symptoms in cucumber leaves. Assessments were made 2, 5, 7, and 10 days after inoculation (T2, T5, T7, T10). First the blade area was separated from its background based on the background-specific color and quantified, followed by the identification and quantification of the area occupied by infection symptoms (). Disease severity was expressed as a percentage of total leaf area affected by pathogen-induced spots.
Results and discussion
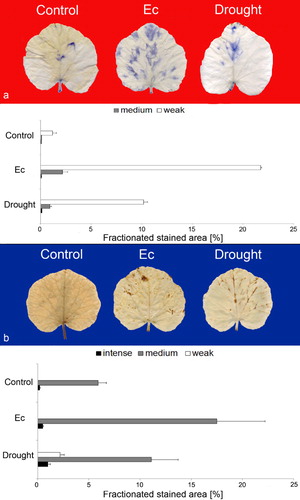
Among a wide variety of abiotic and biotic stressors, drought, salinity, and pathogens are important factors affecting plant health and productivity (Atkinson & Urwin Citation2012). Cucumber and pumpkin studied here are economically important vegetables of the Cucurbitaceae family, and both are sensitive to salinity and drought which impose water deficit followed by the secondary oxidative stress (Munns Citation2002). P. syringae pv. lachrymans, causing the angular leaf spot disease and the powdery mildew pathogen E. cichoracearum are important pathogens of Cucurbitaceae crops causing significant losses in cucurbits yield (Olczak-Woltman et al. Citation2008; Cook & Braun Citation2009). We used the pumpkin/E. cichoracearum/drought and cucumber/P. syringae pv. lachrymans/salinity interactions as models to automatically quantify the histochemically detected ROS and disease development. In pumpkin and cucumber leaves, the NBT and DAB staining procedures led to a weak background staining that was eliminated by the program. Five days after E. cichoracearum infection a marked increase in weak (18-fold) and medium (19-fold) NBT-stained area was observed, and was detected over the whole infected leaf (). In control pumpkin leaves the production of
was nearly absent. Although drought stress applied to pumpkin plants was sensed by roots it also induced ROS accumulation in leaves confirming that ROS can act as both local and systemic signals during environmental stress response (Pitzschke et al. Citation2006; Torres Citation2010). However, the NBT-staining intensity and the total stained area in leaves of drought-treated plants were reduced by more than 50% when compared to the infected ones (). As to H2O2, we found that in control it concentrated around the vascular bundles, whereas in E. cichoracearum-infected pumpkin leaves DAB-stained spots scattered over the leaf surface corresponding to the infection sites (data not shown). The percentage of leaf area showing DAB staining increased after infection. It was due to the 40% increase in medium DAB-stained surface and the simultaneously observed 3.3-fold increase in intense stained area (). The accumulation of ROS, especially H2O2 is usually recognized as a component of effective defense strategy against biotrophic pathogens (Glazebrook Citation2005). Drought-induced H2O2 generation was associated with vascular bundles as DAB-stained spots located almost exclusively along leaf veins. According to visual assessment the extent of DAB staining in infected and drought-treated pumpkin leaves was similar. However, the rigorous automated quantification revealed that the treatments had different effects on H2O2 production. In drought-treated leaves the total DAB-stained area was smaller by 25% than in the infected ones. Moreover, under abiotic stress the production of H2O2 was more heterogeneous as weak, medium, and intense DAB staining could be distinguished, whereas pathogenesis-related local H2O2 generation was stronger and the medium DAB staining which indicated a considerable accumulation of H2O2 accounted for 97% of the total stained area ().
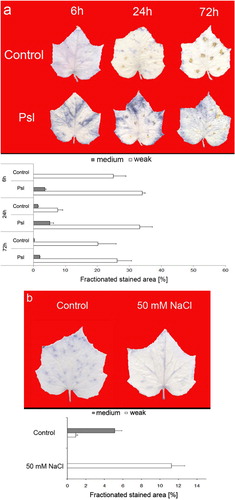
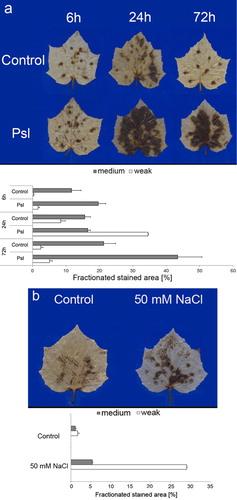
Similarly, quantitative evaluation of NBT- and DAB-stained leaf areas in cucumber revealed the heterogenicity of staining for infection and abiotic stress-induced H2O2 and providing an advantage of the devised method over the routine visual assessment of in situ histochemical detection of ROS. The insoluble formazan deposits and DAB precipitates found in control (mock-inoculated) cucumber leaves indicated the wound-induced production of
and H2O2, respectively ( and ). After P. syringae pv. lachrymans inoculation, a marked increase in
content was observed at 6 h and 24 h and the NBT-stained surface accounted for 38% and 37% of the total leaf area, respectively. Thereafter (72 h), the increase in formazan deposits indicating
accumulation was not visible in inoculated cucumber leaves (). These results confirmed the well-known temporal pattern of oxidative burst after infection (Torres Citation2010). In contrast, salt stress caused approximately two-fold increase in H2O2 concentration relative to control plants (). However, it is worth noting that this response was characterized by weak NBT-staining only, indicating that the salt-induced accumulation of
remained low. The application of biotic stress also provoked an enhanced generation of H2O2 (). The DAB-stained area and intensity of staining progressively increased and reached the maximum values, 72 h after P. syringae pv. lachrymans inoculation when 48% of the total leaf area was stained brown indicating H2O2 accumulation. As at 72 h medium staining accounted for 43% of the total DAB-stained leaf area, the production of H2O2 could be considered significant. These data indicate that the generation of both ROS was not restricted to the infection sites; however, the bacterial pathogen-induced
and H2O2 did not accumulate at the same rate and to the same extent. Abiotic stress-induced generation of H2O2 in cucumber leaves was significantly enhanced and the DAB-stained area accounted for 34% of the total leaf area; however, the majority of this area was light brown (). As similar results were found for NaCl-induced
production it appears that salt stress is a rather weak inducer of ROS in cucumber leaves. These results are in line with the observations that plants differentially enhance the generation of ROS depending on the quality of environmental stress (op den Camp et al. Citation2003).
The computer method was also successfully applied to monitor the development of angular leaf spot disease caused by P. syringae pv. lachrymans on cucumber leaves. The use of leaf area covered with infection symptoms was considered an appropriate measure of disease severity as under the experimental conditions disease development resulted in larger necrotic lesions rather than greater necrotic spotting. The quantification of angular leaf spot revealed a progressive increase in the leaf area covered by disease symptoms. The necrotic area increased from 0.5% two days after inoculation to 13% eight days later (). In the course of infection a slower symptom development phase from two to seven days after inoculation and a faster one thereafter were detected. When disease development was assessed, leaf tip and/or margin necrosis of nonpathogenic origin were not considered. They were marked as excluded for neural network classification by the interactive erosion of binary leaf blade mask ().
This study has shown that the developed leaf image analysis method is a versatile tool for quantifying both necrotic symptoms and histochemically detected ROS accumulation in plants under biotic and abiotic stresses. The proposed procedure is a general-purpose leaf imaging method that can be used for many other plant species and can be adapted for simultaneous quantification of other responses, for example, stress-induced cell death detected histochemically using Evans blue and GUS staining.
Related Research Data
References
- Atkinson, NJ, Urwin, PE. 2012. The interaction of plant biotic and abiotic stresses: from genes to the field. J Exp Bot. 63:3523–3543. 10.1093/jxb/ers100
- Bolwell, GP, Daudi, A. 2009. Reactive oxygen species in plant–pathogen interactions. In: del Río LA, Puppo A, editors. Reactive oxygen species in plant signaling, 113–133. Heidelberg: Springer-Verlag Berlin.
- Cheeseman, JM. 2006. Hydrogen peroxide concentrations in leaves under natural conditions. J Exp Bot. 57:2435–2444. 10.1093/jxb/erl004
- Cook, RTA, Braun, U. 2009. Conidial germination pattern in powdery mildews. Mycol Res. 113:616–636. 10.1016/j.mycres.2009.01.010
- Glazebrook, J. 2005. Contrasting mechanisms of defense against biotrophic and necrotrophic pathogens. Annu Rev Phytopathol. 43:205–227. 10.1146/annurev.phyto.43.040204.135923
- Gocławski, J, Sekulska-Nalewajko, J, Kuźniak, E. 2012. Neural network segmentation of images from stained cucurbits leaves with colour symptoms of biotic and abiotic stresses. Int J Appl Math Comput Sci. 22:669–684.
- Gonzalez, RC, Woods, RE. 2007. Digital image processing, 976–). Upper Saddle River, NJ: Prentice Hall.
- Goodwin, PH, Hsiang, T. 2010. Quantification of fungal infection of leaves with digital images and Scion image software. Meth Mol Biol. 638:125–135.
- Hsiao, TC. 1973. Plant responses to water stress. Annu Rev Plant Plysiol. 24:519–570. 10.1146/annurev.pp.24.060173.002511
- Masters, T. 1993. Practical neural network recipes in C++, 493–). San Diego, CA: Academic Press Inc.
- Munns, R. 2002. Comparative physiology of salt and water stress. Plant Cell Environ. 25:239–250. 10.1046/j.0016-8025.2001.00808.x
- Olczak-Woltman, H, Schollenberger, M, Mądry, W, Niemirowicz-Szczytt, K. 2008. Evaluation of cucumber (Cucumis sativus) cultivars grown in Eastern Europe and progress in breeding for resistance to angular leaf spot (Pseudomonas syringae pv. lachrymans). Eur J Plant Pathol. 122:385–393. 10.1007/s10658-008-9304-3
- op den Camp, RGL, Przybyla, D, Ochsenbein, C, Laloi, C, Kim, C, Danon, A, Wagner, D, Hideg, E, Göbel, C, Feussner, I, Nater, M, Apel, K. 2003. Rapid induction of distinct stress responses after the release of singlet oxygen in Arabidopsis. Plant Cell. 15:2320–2332. 10.1105/tpc.014662
- Osowski S. 2006. Neural networks for information processing. OWPW, Warsaw; 422p. (in Polish)
- Pitzschke, A, Fornazi, C, Hirt, H. 2006. Reactive oxygen species signalling in plants. Antioxid Redox Sign. 8:1757–1764. 10.1089/ars.2006.8.1757
- Thordal-Christensen, H, Zhang, Z, Wei, Y, Collinge, DB. 1997. Subcellular localization of H2O2 in plants: H2O2 accumulation in papillae and hypersensitive response during the barley-powdery mildew interaction. Plant J. 11:1187–1194. 10.1046/j.1365-313X.1997.11061187.x
- Torres, MA. 2010. ROS in biotic interactions. Physiol Plant. 138:414–429. 10.1111/j.1399-3054.2009.01326.x
- Unger, C, Kleta, S, Jandl, G, Tiedemann, A. 2005. Suppression of the defence-related oxidative burst in bean leaf tissue and bean suspension cells by the necrotrophic pathogen Botrytis cinerea. J Phytopathol. 153:15–26. 10.1111/j.1439-0434.2004.00922.x