
Abstract
The effect of treated municipal wastewater on the roots and the leaves of turnip was studied to compare the 50% and 100% wastewater of 34 ml/d Sewage Treatment Plant (STP) with different doses of potassic fertilizers. Turnip (Brassica rapa) was used as a test plant. A pot experiment was conducted, using a factorial randomized block design to investigate the growth and translocation of heavy metals to the leaves and the roots of turnip. The concentration of heavy metal in wastewater used for irrigation was within the limits. However, the concentration in the plant parts showed a significant rise due to continuous use of wastewater. The concentration of heavy metals in leaves and roots was at excessive levels at 40 and 55 days after sowing (DAS), while at 70 DAS, metal concentration was comparatively low. The range of heavy metals in wastewater irrigated plants was Cd = 1–16.3, Ni = 0–136, Fe = 263–1197, Cu = 0–18, Mn = 37–125, and Zn = 42–141 mg/kg. Concentration of heavy metals in plants was found in the order of Fe>Zn>Ni>Mn>Cu>Cd.
1. Introduction
The demand for water by agriculture has increased during recent decades as a result of growing populations and altered precipitation patterns (Forslund et al. Citation2010). A number of governmental authorities have turned their attention to the utilization of the secondary or tertiary treated effluent in order to alleviate water scarcity. Consequently, treated wastewater reuse for irrigation purposes is being widely implemented (Fatta-Kassinos et al. Citation2011) in many countries for recycling plant nutrients (Kalavrouziotis et al. Citation2012). The wastewater constitutes a significant plant nutrient source for soils of low fertility. The municipal wastewater could also be used for crop irrigation with minimum environmental consequences if it does not contain high levels of heavy metals. The treated municipal wastewater is rich in plant nutrients (N, P, K, S, etc.,) and is of considerable value when compared with an equivalent cost of fertilizers. It usually has low levels of heavy metals (Pb, Cd, Ni, Co, Cr, etc.,) (Kalavrouziotis et al. Citation2010). Wastewater may also contain increased K and S levels (Rattan et al. Citation2005) and may also contribute to the accumulation of organic matter up to 59% (Kalavrouziotis et al. Citation2008). The use of treated wastewater also provides a low-cost method for its disposal and conservation of this water through its recharge to groundwater. However, apart from these benefits, wastewater pollution by trace metals and toxic organic contaminants must also be taken into account. This wastewater is not only a source of irrigation water, but it is also a carrier of significant quantities of macro and micronutrients and organic matter.
Use of untreated or improperly treated wastewater in irrigation has been shown to affect soils, crops, food quality, safety (Khan et al. Citation2008), and the management of water (Batarseh et al. Citation2011). Industrial and domestic effluents are either used or disposed off on land for irrigation purposes that create both opportunities and problems. The main concerns are risk due to pathogens, heavy metals, and other chemicals that may be present in the wastewater (Nair et al. Citation2008). This practice can severely harm human health and the environment mainly due to not only the associated pathogens but also heavy metals and other undesirable constituents, depending on the source (Qadir et al. Citation2010). Heavy metals present in wastewater may be toxic to plants and disturb a wide range of biochemical and physiological processes, such as photosynthesis, pigment synthesis, protein metabolism, and membrane integrity if taken up at excessive levels (Yang et al. Citation2008). Nutrients, supplied via treated wastewater, may either favor plant growth by synergistically interacting with another element, or it may negatively affect, by antagonizing with it, i.e. by reducing its concentration, thus unfavorably affecting plant growth (Kalavrouziotis et al. Citation2008, Kalavrouziotis & Koukoulakis Citation2009). Numerous interactions occur in plants; their number and intensity may increase under the effect of various inputs such as the treated wastewater and fertilizers (Kalavrouziotis & Koukoulakis Citation2010). It was also found that the treated wastewater could act as a factor that intensified some of the interactions between heavy metals as well as macro and microelements in the soil and plants. These interactions could increase or decrease the level of the interacting heavy metals, depending on whether they were synergistic or antagonistic. Also, they could take place in the plant, in its various organs, i.e. roots, leaves, and heads or sprouts, thereby, contributing to the spatial distribution of the heavy metals in the plant – an issue of great importance, as it is related to human health (Kalavrouziotis et al. Citation2009). The toxicity due to heavy metals depends on the total concentration as well as the form or the species in which these are present in the soil, water, or wastewater. The ability of plants to accumulate trace elements in their edible parts varies between plant species and among genotypes within the species. Thus there are genetic controls over the trace elements concentrations found in edible portions of higher plants (Midrar-ul-Haq et al. Citation2005). The objective of the current study was to investigate the effect of 34 mL/d wastewater (STP located at Noida) on the growth as well as accumulation of heavy metals in turnip (Brassica rapa).
2. Materials and method
2.1. Preparation of experimental pots
Experiment was conducted in 72 pots of 25 cm diameter during the rabi season of 2008–2009. Pots were filled with 5 kg soil and mixed with 2% organic manure. Sufficient quantity of tap water was added to each pot to provide necessary moisture for germination. Nitrogen, phosphorus, potassium (NPK) doses were applied 24 hours in advance to avoid seed injury. In the month of September, 10 seeds of turnip (Brassica rapa) were sown at equal distances in each pot. The pots were then transferred to a field. Seeds germinated within 10 days afterward, leaving the healthiest one in each pot, and the other plants were removed. Sampling was done 40, 55, and 70 days after sowing (DAS) for growth parameters and heavy metals accumulation. There were eight sets of pots, and nine pots were maintained at each condition. The pots were then divided into two sets. One set was daily watered with 100 ml of treated wastewater (100% ww) while the other set was watered with a mixture of 50 ml wastewater and 50 ml of tap water (designated as 50% ww). The aim of this experiment was to study the effect of 50% and 100% wastewater with uniform basal dose of nitrogen (N50) and phosphorous (P25) and varying amount of potassium (K0, K12.5, K25, and K50). The scheme of treatments of wastewater and fertilizer doses applied in the experiment is given in .
Table 1. Scheme of applied treatments in experiment.
2.2. Wastewater and soil sample analysis
Wastewater samples were collected from Upflow Anaerobic Sludge Blanket (UASB) based in 34 mL/d Sewage Treatment Plant located at Noida (UP), India. Physicochemical parameters and heavy metals (Cd, Ni, Fe, Cu, Mn, and Zn) of treated effluent were analyzed using standard methods (APHA Citation1998). Measurements were made in triplicate. Equipment/instruments/methods listed in were used for parametric determinations. Analysis results are given in and . For coliform analysis, samples were collected in sterilized bottles. Bulk of the samples were collected in plastic bottles and transported in an icebox. Procedures listed in Standard Methods (APHA Citation1998) were followed for sample collection, preservation, transportation, and analysis. Samples for heavy metal analysis were collected in plastic bottles containing 2 ml HNO3 to maintain pH<2.0 and to prevent the precipitation of metals. Acidified samples (350 ml) were digested with HNO3 and filtered. The filtrate was aspirated into a Atomic Absorption Spectrophotometer (Model GBC Avanta M) for the analysis of Cd, Ni, Fe, Cu, Mn, and Zn.
Table 2. Instruments and methods used in experimentation.
Table 3. Characteristics of the treated municipal wastewater (TMWW) and soil used for the irrigation of turnip (Brassica rapa).
Samples of the soils were collected from the experimental pots prior to the experiment and addition of NPK and analyzed for pH, soil texture, total N, P, K, and heavy metals (Cd, Ni, Fe, Cu, Mn, and Zn). Soil samples were air-dried, ground, and passed through 2 mm sieve and analyzed by means of methods internationally accepted. Results are given in and . Measurements were made in triplicate. Equipment/instruments/methods listed in were used for parametric determinations.
Table 4. Heavy metals in wastewater soil and plant parts, critical plant concentration, and permissible limits of Indian standards of heavy metals.
2.3. Plant sample analysis
Three replicates of plant samples from each treatment were collected and gently washed with running tap water to remove the soil particles attached to the plant surfaces and, finally rinsed with deionised water. Subsequently, plant measurements were made. The plant growth was analyzed for root diameter, number of leaves, plant height, plant fresh weight, and plant dry weight. For heavy metal analysis, three replicates of plant samples (leaves and roots) were oven-dried at 70°C until a constant weight. Dried samples were crushed, digested, and then analyzed for Cd, Ni, Fe, Cu, Mn, and Zn by atomic absorption spectrophotometer (Model GBC Avanta M) as per the procedure given in Hach Manual (Citation1999).
2.4. Statistical analysis
The data were statistically analyzed according to Panse and Sukhtame (Citation1985). The ‘F’ test was applied to assess the significance of data at 5% level of probability (P≤0.05). The model of analysis of variance (ANOVA) and critical difference (CD) was also calculated to compare the mean values of various treatments.
3. Results and discussion
3.1. Physicochemical characteristics of wastewater and soil samples
The quality of wastewater was assessed with respect to various physicochemical properties and some of the heavy metals ( and ). The concentration of almost all the elements analyzed, especially the essential macro and micro nutrients, was within the permissible limits FAO/WHO/Pescod. It was further observed that wastewater also contained total coliform and fecal coliform in the range of 21×104–93×106. These values were much higher than the permissible limits (i.e. 1000 MPN/100 mL) specified by WHO for unrestricted irrigation (WHO Citation2006).
The texture of the soil was sandy loam. This has great influence on root growth and its ability to absorb water and nutrients in quantities sufficient for optimum growth which is most suited for root vegetables. The organic matter content was within the range of 0.75–0.90% as high organic carbon means immobilization of many metal ions. The presence of organic matter is important as it is also a source of plant nutrients in addition to its role to provide organic colloids of soil. Therefore, it increases the ion exchange capacity, water holding capacity, and soil fertility as it regulates the soil water and air supply, which in turn control the rate at which nutrients are absorbed by the roots. Values of soil pH fall in a range of 7.80–8.12 and the uptake of various plant nutrients is pH dependent. However, the soil contained 220–240 mg/kg P, 50–60 mg/kg K, and 156–230 mg/kg N, which may be an additional source of these macronutrients (). It may be pointed out that some of the factors known to affect the solubility and availability of nutrients include CEC, soil texture, pH, and organic matter content (Haghiri Citation1974; Williams et al. Citation1980; Verloo & Eeckhout Citation1990). On the basis of these characteristics, soil may be termed as suitable for crop cultivation except the pH as pointed out above.
3.2. Growth of turnip plant
Growth of the plant measured as plant fresh weight, root fresh weight, leaf fresh weight, plant height, leaf number, and root diameter is shown through . CD at 5% are given in . Irrigation with 100% wastewater proved less effective than 50% wastewater. Fifty percent ww proved effective in experiment for enhancing the growth parameters over 100% ww because without dilution, it proved harmful due to excessive ion contents. Thus the combination of 50% ww N50P25K25 recorded the maximum plant growth, which was also at par with 50% wwN50P25K12.5 showing the economy of K fertilizer, while higher K dose (K50) with 50% wastewater as well as with 100% wastewater was excessive as it decreased the plant growth. Fresh weights of the plants, roots, and root diameter increased with increase in growth period (). Plant height increased marginally () with the advancement of age of the plant. However, number of leaves () did not show any trend. The increase in leaf number from 40 to 55 days followed by a decline in some cases was observed, which may be due to the senescence in older leaves at the last stage of growth. Fresh weight of plant, roots, leaves, and root diameter increased up to harvest stage (70 DAS) of sampling. Among the various potassium levels K12.5 with 50% wastewater proved optimum for most of the growth characteristics shown in . Higher K dose (K50) was excessive, as it decreased the plant growth. Potassium has many roles to play because it is an activator of many enzymes that are essential for photosynthesis and respiration, and it also activates enzymes needed to form starch and proteins. This element is also a major contributor to the osmotic potential of cells and, therefore, to their turgor pressures an important feature of root crops. It may also be mentioned that K also promotes translocation of sugars from the leaves to the tubers of potatoes because of which starch content of the tubers is high with well-supplied K (Lachover & Arnon Citation1966).
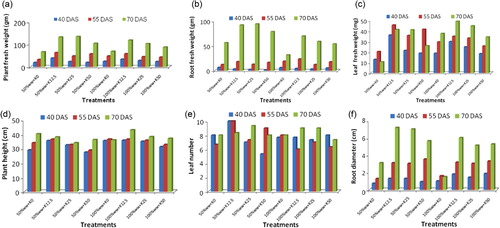
Table 5. CD at 5% at 40, 55, and 70 DAS of plant fresh weight, root fresh weight, leaf fresh weight and plant height, leaf number, and root diameter.
3.3. Distribution of heavy metals in plant parts
The concentration of heavy metals in leaves and roots of turnip at 40, 55, and 70 DAS is shown in (a–f). The range of heavy metal concentrations (mg/kg) in plant parts harvested on different days and a comparison with standards given by Kabata-Pendias and Pendias (1992) is tabulated in . CD of Cd, Ni, Fe, Cu, Mn, and Zn is tabulated in and . The range of heavy metals in wastewater-irrigated plants was Cd=1–16.3, Ni=0–136, Fe=263–1197, Cu=0–18, Mn=37–125, and Zn=42–141mg/kg. In our study, heavy metal concentration was in the order of Fe>Zn>Ni>Mn>Cu>Cd. Grytsyuk et al. (Citation2006), Zheng et al. (Citation2007), Arora et al. (Citation2008), and Khan et al. (Citation2003) reported more or less a similar trend while working on various vegetables, including turnip. In our findings, Fe content was maximum because of its high concentration in soil and wastewater compared to other elements. Like Fe, chelated Zn is important for its transport to root surface for uptake, and its availability is predominantly governed by the pH and adsorbed Zn on soil colloids. It may also be observed that primary and secondary minerals that dissolve initially provide Zn to the soil solution for its availability which may also be responsible for comparatively higher Zn content. Zn was followed by Ni may be due to use of sewage sludge and result in higher levels of Ni. In addition, it is also readily taken up by most plant species (Havlin et al. Citation1999). It was followed by Mn. In general, higher concentration of Mn may be because it is easily taken up by the plants when it occurs in soluble form. Lower concentration of Cd after Cu may be due to their greater dependability on solubility and soil pH. Most of the heavy metals decreased with the advancement of age in edible parts of the plant. This decreasing trend can be ascribed to the exponential increase in growth, and as a result of dilution with growth effect, even higher quantities of elements appear to be less when expressed on per unit basis (Moorby & Besford Citation1983). Ni content in leaf and Cu content in root were increased with growth which may be because of the selective properties of ion absorption in plants (Devlin & Witham Citation1986). However, even on using the same species, the uptake by plants does not necessarily correlate with the bioavailable metal concentration in the soil or the total metal concentration. This is probably due to the genotype with inherent capability of different metal uptakes, as pointed out above, as in the case of Ni and Cu. It may also be added that plants also differ in their transport of ions, resulting in differences in concentration in plant parts (Greger Citation2004), as observed in the present study also, where the heavy metals fluctuated between the root and the leaf, depending upon the growth stage, availability of individual element, and also their interactions. In many cases, heavy metal concentration was more in plants grown under 50% ww than the 100% ww in case of leaf and root. This was not surprising because metal uptake may differ in relation to external concentration and genotypes. It may also be pointed out that uptake is not linear in relation to increase in wastewater concentration in many cases, which may be because metals are bound in the tissues, causing saturation which is governed by the rate at which the metal is conducted away. Therefore, the uptake efficiency is more at a low concentration which was observed in solution culture (Greger et al. Citation1991) as well as in soil (Greger Citation1997) for Cd. It may be because of low metal concentration per absorption area giving low competition between the ions at the uptake sites while the opposite occurs at high concentration.
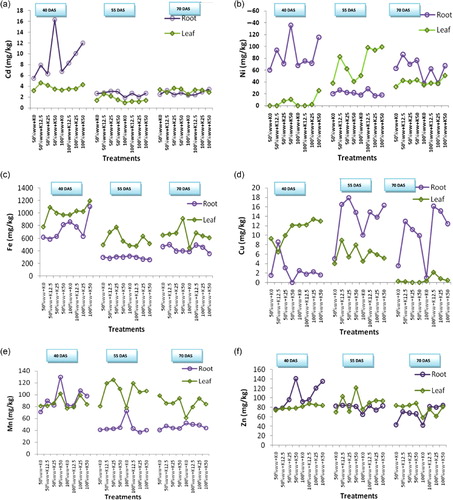
Table 6. CD at 5% at 40, 55, and 70 DAS for Cd, Ni, and Fe.
Table 7. CD at 5% at 40, 55, and 70 DAS for Cu, Mn, and Zn.
3.3.1. Cadmium accumulation in plant parts
In root at 40 and 55 DAS, 50% ww showed maximum concentration, while at 70 DAS, it was 100% ww. At 40 DAS, 50% wwK50N50P25 accumulated higher Cd content, and it was critically different with other interactions, It was followed by 100% ww K50N50P25, 100% ww K25N50P25, and 100% ww K12.5N50P25. At 55 DAS, 50% ww K25N50P25 accumulated more and had similar effect with 50% ww K50N50P25 followed by 50% ww K12.5N50P25, and the last treatment had similar effect with 100% ww K12.5N50P25, 100% ww K50N50P25, and 50% ww K0N0P0, while at 70 DAS, the combination 100% ww K50N50P25 recorded maximum effect, and it was followed by 50% ww K12.5N50P25 and 100% ww K25N50P25. In case of leaf, 50% ww gave more value. Among the K doses, K12.5 at 40 and 55 DAS, while K25 at 70 DAS, showed maximum heavy metal content. Among the interactions of wastewater and potassium, 50% ww K12.5N50P25 accumulated higher Cd and was at par with 100% ww K50N50P25. At 55 DAS, 50% ww K12.5N50P25 had more, and it was critically different with other treatments, while at 70 DAS, 100% ww K12.5N50P25 accumulated more Cd content and was equally effective with 50% ww K25N50P25, 50% ww K50N50P25, and the last treatments was at par with 50% ww. Cd concentration was more in root at 40 and 55 DAS, while at 70 DAS, it was more or less similar in both organs (). Its concentration generally increased with K doses in root as well as in leaf and generally decreased with growth. Cd concentration was increased with K doses in case of root, and Cd concentration was more in the root than the leaf, which was also in agreement with the work of Demirezen and Aksoy (Citation2004) and Kalavrouziotis et al. (Citation2008). On the contrary, at harvest stage, Cd was surprisingly below the toxic levels. It was obviously due to the increased root fresh weight, increased root diameter, and plant fresh weight at this stage, which was supposed to be responsible for its dilution, although the total Cd content could have remained unchanged. It may be relevant here to point out the work of Chaney and Hornick (Citation1977), who have reviewed the work on Cd and reported much difference in the ability to absorb it, where lowest concentration was observed in rice, sudan grass, and clover and higher in spinach and turnip. On the contrary, Cd in leaf was below the toxic levels at last stage of sampling, as it was generally retained by the roots instead of transporting it toward the shoot.
3.3.2. Nickel accumulation in plant parts
The concentration of Ni generally increased with K doses in both leaf and root. Its concentration increased at 55 DAS, while it decreased at the harvest stage. Ni content was more in root at 40 and 70 DAS, while at 55 DAS, it was more in leaf. In case of root, 50% ww showed higher concentration at all the three stages, and among the K doses, K50 at 40 DAS, while at 55 and 70 DAS, K12.5 accumulated more. In case of interactions at 40 DAS, 50% ww K50N50P25 had maximum Ni, which was critically different with other treatments. At 55 DAS, the interaction of 100% ww K12.5N50P25 accumulated higher content and was statistically similar with 50% ww K12.5N50P25. At 70 DAS, 50% ww K12.5N50P25 proved more effective and was critically different with other treatments, followed by 50% ww K50N50P25 and 50% ww K25N50P25. In case of leaf, 100% ww accumulated maximum Ni content and K50 recorded more Ni at 40 and 70 DAS, while at 55 DAS, it was K12.5. The combination of 100% ww K50N50P25 accumulated maximum Ni and was critically different with other interactions followed by 50% ww K50N50P25, 50% ww K25N50P25, 100% ww K25N50P25, and 50%ww K0N0P0. While at 55 DAS, 100% ww K50N50P25 accumulated more, and it was statistically at par with 100% ww K12.5N50P25 and 100% ww K25N50P25. At 70 DAS, 100% ww K50N50P25 proved more effective, and it was followed by 50% ww K50N50P25. Its concentration was more in root at 40 and 70 DAS, while at 55 DAS, it was more in leaf (). It may be because of its easy mobility in plant parts, therefore, after initial growth up to 40 DAS, where its concentration was higher, it was transported more toward the leaves at 55 DAS, stage. However, at harvest stage, due to senescence in some of the older leaves, it was transported back toward the root. In our findings, Ni content ranges from 0 to 136 mg/kg, while Shacklette (Citation1980) reported that the Ni content in vegetables ranges from 0.2 to 3.7 ppm (DW). In our study, data indicated that metal accumulated by turnip plants was largely retained in roots as indicated by translocation factor (TF) values which were <1 at 40 and 70 DAS, while at 55 DAS, and TF value in general was >1.
3.3.3. Iron accumulation in plant parts
In root, Fe content decreased at the second stage and again increased at the harvest stage. While in case of leaf, it generally decreased with growth. At 55 and 70 DAS, its concentration was more or less similar. Fe content was more in leaf than in root. Among the fertilizer doses at 40 DAS, K50 showed maximum Fe content, while at 70 DAS, K12.5 accumulated more. Among the interactions, 100% ww K50N50P25 gave higher Fe content, and it was critically different with other treatments. At the second stage, 100% ww K0N0P0 gave more Fe, and it was statistically equal with 50% ww K25N50P25, and the last treatment was equaled by 50% ww K50N50P25 and 100% ww K12.5N50P25. While at 70 DAS, 50% ww K12.5N50P25 accumulated maximum Fe and was equal in effect with 100% ww K12.5N50P25 and 50% ww K0N0P0. In case of leaf, at 40 DAS, 100% ww proved effective, while at 55 and 70 DAS, 50% ww registered higher Fe content (). At 40 and 70 DAS, K50 accumulated more, while at 55 DAS, K25 gave more in leaf. At 40 DAS, interaction of 100% ww K50N50P25 registered maximum Fe content, and it was critically different with other combinations followed by 50% ww K12.5N50P25, 100% ww K12.5N50P25, and 100% ww K25N50P25, and the last was at par with 50% ww K25N50P25, 100% ww K0N0P0, and 50% ww K50N50P25. At the second stage, 50% ww K25N50P25 was critically different with the others, and it was followed by 50% ww K12.5N50P25, 100% ww K25N50P25, and 50% ww K50N50P25. While at 70 DAS, 50% ww K50N50P25 accumulated more Fe. It differed with other interactions and followed by 100% ww K12.5N50P25, which was statistically similar with 50% ww K25N50P25, 50% ww K12.5N50P25, 50% ww K0N0P0, and 100% ww K25N50P25. In our results, Fe contents increases under K fertilizers, and the increase may be because of their roles in enhancing the root growth and thereby the surface area for its greater absorption (Tisdele et al. Citation1995). The TF values were generally >1 and shows more accumulation in the leaf than the root. About 75% of total leaf Fe is associated with chloroplast and up to 90% of Fe leaves occur with lipoprotein of chloroplast and mitochondria membrane, therefore, its presence in larger amount in leaves was understandable (Havlin et al. Citation1999).
3.3.4. Copper accumulation in plant parts
In root, its concentration generally decreased with growth, and at 40 and 70 DAS, generally decreased with K doses, while at 55 DAS, it increased in some cases. In case of leaf, its concentration decreased with growth (). Concentration of Cu increased with K doses at 40 DAS, while at 55 DAS, it generally decreased. Cu concentration was more in the root than in the leaf at 55 and 70 DAS. In the root, 50% ww was at 40 DAS, while at 55 and 70 DAS, 100% ww showed maximum Cu content. Among the potassium doses at 55 DAS, K25 had more, while at 40 and 70 DAS, it was in K12.5. Among the interactions, 50% ww K12.5N50P25 accumulated maximum Cu content and was followed by 50% ww K25N50P25 and was critically different with the other treatments. At the later stage, 50% ww K25N50P25 proved more effective, and it was critically different with other combinations followed by 50% ww K12.5N50P25. The last combination was at par with 100% ww K50N50P25, while at 70 DAS, 100% ww K12.5N50P25 gave more Cu content. In the case of leaf at 40 and 70 DAS, 100% ww accumulated higher Cu, while at 55 DAS, it was 50% ww. Among the potassium doses, K50 accumulated maximum Cu content at 40 DAS, while at 55 and 70 DAS, it was K12.5. Among the interactions, 100% ww K25N50P25 by giving an increase of 43.55% higher Cu content and was statistically similar with 100% ww K50N50P25. The last treatment was at par with 100% ww K12.5N50P25. At the second stage, 50% ww K12.5N50P25 registered more Cu in the leaf, and it was critically different with other treatments. At 70 DAS, 100% ww K12.5N50P25 accumulated maximum Cu content, followed by 100% ww K25N50P25, 100% ww K50N50P25, and 100% ww K0N0P0. While in the case of K, its concentration was generally decreased with increase in doses due to its interaction with K, where potassic fertilizers can also induce Cu deficiency (Tisdele et al. Citation1995). The TF value was generally <1 at 55 and 70 DAS, as the Cu mobility within plant tissues strongly depends on the level of Cu supply, and it has low mobility relative to other elements in plants. In addition, the distribution of Cu within plants is highly variable as within roots, and Cu is associated mainly with cell walls and is largely immobile. The majority of the plant species, therefore, can accumulate more Cu especially in the root as observed at the later two stages, while at an early stage, TF value was >1. The highest concentrations of Cu in shoots are always in phases of intensive growth which was evident in our study at 40 days.
3.3.5. Manganese accumulation in plant parts
At the first stage, its concentration was more or less similar in root and leaf, but at 55 and 70 DAS, it was more in leaf. Its concentration generally increased with K doses in root and leaf at 40 DAS, while at 55 and 70 DAS, it generally decreased in the root. Mn concentration also decreased with growth, while at 55 and 70 DAS, it was more or less similar in root (). In the leaf at 40 and 70 DAS, its content was more or less similar, while at 55 DAS, it showed higher values. At 40 DAS, 50% ww, while at 55 and 70 DAS, 100% ww accumulated higher Mn content in root. At 40 DAS, K50 gave higher content, while at 70 DAS, K12.5 accumulated more. Among the interactions at 40 DAS, 50% ww K50N50P25 had more Mn content, and it was critically different with other combinations followed by 100% ww K25N50P25 and 100% ww K50N50P25. At 55 DAS, 100% ww K0N0P0 registered more content and was critically different with others, followed by 50% ww K50N50P25. At 70 DAS, 100% ww K0N0P0 gave the maximum value, and it was equally effective with 100% ww K12.5N50P25 and 100% ww K25N50P25. The last treatment was at par with 50% ww K12.5N50P25 which in turn was at par with 50% ww K25 N50P25 and 100% ww K50N50P25. In case of leaf, 50% ww gave more Mn content by giving an increase over 100%ww at all the sampling stages. Among the potassium doses at 40 DAS, K50 recorded higher Mn content which was equally effective with K25. At 55 DAS, K12.5 was equal to K25, in effect of Mn accumulation. While at 70 DAS, K25 accumulated higher Mn and was equally effective with K50. Among the interactions, 50% ww K50N50P25 accumulated maximum Mn and was statistically similar with 100% ww K25N50P25. At 55 DAS, it was 50% ww K25N50P25, which was statistically similar with 100% ww K12.5N50P25 and 50%wwK12.5N50P25. At the last stage, 50% ww K0N0P0 accumulated more Mn and was equally effective with 50% ww K50N50P25 and 100% ww K25N50P25. It may also be added that differences in Mn content under different concentrations of wastewater were due to differential absorption by the root (Bowen Citation1979) It may be pointed out that potassic fertilizer has a great role in Mn and its uptake which was reflected during the observations in the experiment, and it can be so strong that it produces toxicity in sensitive crops (Tisdele et al. Citation1995). The TF values in general were >1, although it is reverse in some cases. It may be because Mn concentration fluctuates greatly within the plant parts and within the vegetative period. It is not only an effect of the plant characteristics but also of the pool of available Mn which is controlled basically by soil properties. Although it is relatively immobile like iron, its mobility varies depending upon its supply.
3.3.6. Zinc accumulation in plant parts
In leaf, Zn concentration generally increased with K doses at all the three stages. Its concentration was more or less similar in leaf and root. The concentration generally decreased with growth. In root, at 40 and 55 DAS, 50% ww was responsible for maximum Zn content, and at 70 DAS, it was 100% ww. At 40 DAS, K50 registered maximum content at 55 DAS, and K12.5 accumulated more Zn and was statistically equal to K50. While at 70 DAS, K12.5 was statistically at par with other K doses (). Among the interactions, Zn content was more in 50% ww K50N50P25, and it was statistically similar with other interactions, followed by 100% ww K50N50P25, 100% ww K25N50P25, and 50% ww K25N50P25. The last treatment was at par with 100% ww K12.5N50P25 and 100% ww K0N0P0. At 55 DAS, 50% ww K12.5N50P25 had more Zn content, and it was statistically similar with 100% ww K12.5N50P25, 50% ww K25N50P25, 100% ww K50N50P25, 50% ww K0N0P0, and 50% ww K50N50P25. While at the last stage, 100% ww K50N50P25 gave more value, which was also statistically equal to 100% ww K12.5N50P25 and 100% ww K25N50P25. In case of leaf, at 40 DAS, it was 100% ww, whereas at 55 and 70 DAS, 50% ww accumulated higher Zn content. At 55 and 70 DAS, K50 was also critically different with other treatments. At 55 DAS, interaction of 50% ww K50N50P25 registered higher Zn content, followed by 50% ww K12.5N50P25 and 100% ww K25N50P25. The last treatment was also at par with 100% ww K50N50P25 and 100% ww K12.5N50P25, while at the last sampling, it was 50% ww K50N50P25. It was also equal in effect with 50% ww K25N50P25, 50% ww K0N0P0, and 50% ww K12.5N50P25. The TF values were generally <1. Therefore, the roots often contained much more Zn than the tops, particularly when plants are grown in Zn-rich conditions. With luxury levels of soil Zn, this element may be translocated from the roots and accumulated by the tops of the plant. Therefore, the rate of Zn absorption differs greatly among both plant species and growth medium.
4. Conclusion
The following conclusions could be drawn in relation to the evaluation of the treated municipal wastewater on turnip plants.
Heavy metals Cd, Ni, Fe, Cu, Mn, and Zn were within the permissible limits for irrigation water. The microbiological examination of the wastewater revealed the presence of some pathogenic microorganisms, therefore, the growers may be warned to be careful during irrigation operation.
Irrigation with treated effluent increased the concentration of heavy metals in the plant parts. The rate of accumulation of heavy metals in leaves and roots is observed to be depended on the relative efficiency or transfer factor of these metal ions from soil to roots and leaves.
Wastewater irrigation increased the growth parameters, plant fresh weight, root fresh weight, leaf fresh weight, and root diameter increased with advancement of the plant. Further, concentration of heavy metal reduced with growth of biomass of root and leaves. In general, accumulation is observed more in roots than in leaves, and the dilution increased rapidly after 40 DAS. Therefore, the early stage of harvesting may lead to more heavy metal contamination, and, therefore, a poor food quality and higher health risk, specially, when used in food intake for the long term.
Fifty percent ww proved best over 100% ww, therefore, it can be used after dilution. The combination of 50% ww K25 proved beneficial in enhancing the growth which was at par with 50% ww K12.5, indicating the usefulness of wastewater where 12.5 kg K/ha could be saved.
The levels of Cd, Ni, and Zn in the leaves and roots were found to be more than the toxic limits given by Kabata-Pendias and Pendias (Citation1992). In leaf, Cd, Cu, and Mn concentration was below the toxic level. Heavy metal concentration was found in the order of Fe>Zn>Ni>Mn>Cu>Cd. The results show that there is a risk associated with consumption of turnip, therefore, it is not advisable to consume turnip cultivated under this water. However, more work is needed in this respect to accurately quantify the seriousness and severity of pollution.
References
- APHA. 1998. Standard method for the examination of water and wastewater. 20th ed. Washington (DC): American Health Association.
- Arora KR. 2000. Soil mechanics and foundation engineering. 5th ed. Delhi: Standard Publishers Distributors.
- Arora M, Kiran B, Rani S, Rani A, Kaur B, Mittal N. 2008. Heavy metal accumulation in vegetables irrigated with water from different sources. Food Chem. 111:811–815. 10.1016/j.foodchem.2008.04.049
- Awasthi SK. 2000. Prevention of Food Adulteration Act No. 37 of 1954. Central and State rules as amended for 1999. 3rd ed. New Delhi: Ashoka Law House.
- Ayers RS, Westcot DW. 1994. Waste quality for agriculture: FAO irrigation and drainage. Pap. 29 Rev. 1:1–130.
- Batarseh MI, Rawajfeh A, Ioannis KK, Prodromos KH. 2011. Treated municipal wastewater irrigation impact on olive trees (Olea Europaea L.) at Al-Tafilah, Jordan. Water Air Soil Pollut. 217:185–196. 10.1007/s11270-010-0578-7
- Bear FE. 1964. Chemistry of the soil. 2nd ed. New Delhi, Mumbai, and Kolkata: Oxford and IHB Publishing Company Pvt. Ltd.
- Behera PK. 2006. Soil and solid waste analysis: a laboratory manual. New Delhi: Dominant publishers and distributors.
- Bowen HJM. 1979. Environmental chemistry of the elements. New York, NY: Academic Press. 333 p.
- Chaney RL, Hornick SB. 1977. Accumulation and effects of cadmium on crops. Paper presented at: International Cadmium Conference. San Francisco. 125 p.
- Demirezen D, Aksoy A. 2004. Accumulation of heavy metals in Typha angustifolia (L) and Potamogeton pectinatus (L.) living in Sultan Marsh (Kayseri, Turkey). J Chemosphere. 56:685–696. 10.1016/j.chemosphere.2004.04.011
- Devlin RM, Witham FH. 1986. Plant physiology. 4th ed. Shahadara, New Delhi: C.B.S. Publishers and Distributors.
- Fatta-Kassinos D, Kalavrouziotis IK, Koukoulakis PH, Vasquez MI. 2011. The risks associated with wastewater reuse and xenobiotics in the agroecological environment. J Sci Total Environ. 409:3555–3563. 10.1016/j.scitotenv.2010.03.036
- Forslund A, Ensink JHJ, Battilani A, Kljujev I, Gola S, Raicevic V, Jovanovic Z, Stikic R, Sandei L, Fletcher T, Dalsgaard A. 2010. Faecal contamination and hygiene aspect associated with the use of treated wastewater and canal water for irrigation of potatoes (Solanum tuberosum). Agric Water Manag. 98:440–450. 10.1016/j.agwat.2010.10.007
- Greger M. 1997. Willow as phytoremediator of heavy metal contaminated soil. In: Proceedings of the 2nd international conference on element cycling in the environment; Warsaw. p. 167–172.
- Greger M. 2004. Metal availability, uptake, transport and accumulation in plants. In: Prasad MNV, editor. Heavy metal stress in plants. 2nd ed. New Delhi: Narosa Publishing House; p. 462.
- Greger M, Brammer E, Lindberg S, Larsson G, Idestam-Almquist J. 1991. Uptake and physiological effects of cadmium in sugar beet (Beta vulgaris) related to mineral provision. J Exp Bot. 42:729–737. 10.1093/jxb/42.6.729
- Grytsyuk N, Arapis G, Perepelyatnikova L, Ivanova T, Vynogradska V. 2006. Heavy metals effects on forage crops yields and estimation of elements accumulation in plants as affected by soil. Sci Total Environ. 354(2–3):224–231. 10.1016/j.scitotenv.2005.01.007
- Hach Manual. 1999. Digesdahl digestion apparatus. models 23130-20. Loveland (CO): Hach company.
- Haghiri F. 1974. Plant uptake of cadmium as influenced by cation exchange capacity, organic matter, zinc and soil temperature. J Environ Qual. 3:180–182. 10.2134/jeq1974.00472425000300020021x
- Havlin JL, Beaton JD, Tisdale LT, Nelson WL. 1999. Soil fertility and fertilization: An Introduction to Nutrient Management. 6th ed. Singapore: Pearson Education (Singapore) Pvt. Ltd.
- Kabata-Pendias A, Pendias H. 1992. Trace elements in soils and plants. 2nd ed. Boca Raton (FL): CRC Press.
- Kalavrouziotis IK, Koukoulakis PH. 2009. Distribution of elemental interactions in Brussels sprouts plants under the treated municipal wastewater. J Plant Interact. 4:219–231. 10.1080/17429140902914127
- Kalavrouziotis IK, Koukoulakis PH. 2010. Elemental antagonism in vegetables under treated municipal wastewater. J Plant Interact. 5:101–109. 10.1080/17429140903438092
- Kalavrouziotis IK, Koukoulakis P, Kostakioti E. 2012. Assessment of metal transfer factor under irrigation with treated municipal wastewater. J Agric Water Manag. 103:114–119. 10.1016/j.agwat.2011.11.002
- Kalavrouziotis IK, Koukoulakis PH, Mehra A. 2010. Quantification of elemental interaction effects on Brussels sprouts under treated municipal wastewater. Desalination. 254:6–11. 10.1016/j.desal.2009.12.026
- Kalavrouziotis IK, Koukoulakis PH, Papadopoulos AH, Mehra A. 2009. Heavy metal accumulation in Brussels sprouts after irrigation with treated municipal waste water. J Plant Interact. 4:41–48. 10.1080/17429140802528357
- Kalavrouziotis IK, Robolas P, Koukoulakis PH, Papadopoulos AH. 2008. Effect of municipal reclaimed wastewater on the macro and micro elements status of soil and of Brassica oleracea var. Italica, and B. oleracea var. Gemmifera. J Agric Water Manag. 95:419–426. 10.1016/j.agwat.2007.11.004
- Khan NA, Gupta L, Javid S, Singh S, Khan M, Inam A, Samiullah. 2003. Effects of sewage wastewater on morphophysiology and yield of Spinacia and Trigonella. Indian J Plant Physiol. 8:74–78.
- Khan S, Cao Q, Zheng YM, Huang YZ Zhu YG. 2008. Health risks of heavy metals in contaminated soils and food crops irrigated with wastewater in Beijing, China. J Environ Pollut. 152:686–692. 10.1016/j.envpol.2007.06.056
- Lachover D, Arnon I. 1966. Observations on the relationship between heavy potassium deficiency and poor quality of several agricultural products of major crops. In: Mengel K, Kirkby EA, editors. Principles of plant nutrition. 4th ed. New Delhi: Panima Publishing Corporation; p. 439–464.
- Mengel K, Kirkby EA. 1996. Principles of Plant Nutrition. 4th Ed. Panima Publishing Corporation, New Delhi.
- Midrar-ul-Haq, Khattak RA, Puno HK, Saif MS, Menon KS Sial NB. 2005. Toxicity of trace elements in different vegetables grown on potentially contaminated sites of the Korangi industrial area, Karachi Pakistan. J Plant Sci. 4:132–135.
- Moorby J, Besford RT. 1983. Mineral nutrition and growth. In: Lauchli A, Bieleski RL, editors. Encylopaedia of plant physiology. Vol. 15B; New York, NY: Springer Verlag; p. 481–572.
- Nair J, Levitan J, Oyama N. 2008. Zinc and copper uptake by silver beet grown in secondary treated effluent. J Bioresour Technol. 99:2537–2543. 10.1016/j.biortech.2007.04.043
- Panse VG, Sukhtame PV. 1985. Statistical methods for agricultural workers. 4th ed. New Delhi: Indian Council of Agricultural Research (ICAR).
- Pescod MB, 1992. Wastewater treatment and use in agriculture- FAO irrigation and drainage paper 47. Rome: Food and Agriculture Organization of the United Nations. 125 p.
- Qadir M, Wichelns D, Raschid-Sally L, McCornick PJ, Drechsel P, Bahri A, Minhas PS. 2010. The challenges of wastewater irrigation in developing countries. J Agric Water Manag. 97:561–568. 10.1016/j.agwat.2008.11.004
- Rattan RK, Datta SP, Chhonkar PK, Suribabu K, Singh AK. 2005. Long term impact of irrigation with sewage effluents on heavy metal content in soils, crops and groundwater a case study. J Agric Ecosyst Environ. 109:310–322. 10.1016/j.agee.2005.02.025
- Shacklette HT. 1980. Elements in fruits and vegetables from area of commercial production in the United States. US Goel Surv Prof Pap. 1178:149 p.
- Tisdele SL, Nelson WL, Beaton JD, Havlin JL. 1995. Soil fertility and fertilizers. 5th ed. New Delhi, India: Prentice-Hall of India Pvt. Ltd.
- Verloo M, Eeckhout M. 1990. Metal species transformations in soil: An analytical approach. Int J Environ Anal Che. 39:179–186. doi:10.1080/03067319008027695
- Walkley AJ, Black IA. 1934. Estimation of soil organic carbon by the carbonic acid titration method. Soil Sci 37:29–38.
- Williams DE, Vlamis J, Purkite AH, Corey JE. 1980. Trace element accumulation movement, and distribution in the soil profile from massive applications of sewage sludge. J Soil Sci. 1292:119–132.
- World Health Organisation [WHO]. 2006. Guidelines for the safe use of wastewater, excreta and grey water. Vol. 2. Geneva: WHO.
- Yang Q-W, Lan C-Y, Shu W-S. 2008. Copper and Zinc in a paddy field and their potential ecological impacts affected by wastewater from a lead/Zinc mine, P.R. China. J Environ Monitoring Assess. 147:65–73. doi:10.1007/s10661-007-0098-0
- Zheng N, Wang Q, Zheng D. 2007. Health risk of Hg, Pd, Cd, Zn, and Cu to the inhabitants around Huludao Zinc plant in China via consumption of vegetables. J Sci Total Environ. 383:81–89. doi:10.1016/j.scitotenv.2007.05.002