
Abstract
The beneficial effects of forages containing condensed tannins (CTs) on ruminants are well documented, but the chemical features of CT that yield benefits have not been defined. Some evaluations of limited numbers of highly purified compounds have resulted in positive correlations between CT molecular weight (MW) and biological activity, while others have failed to show a correlation. The objectives of this study were to determine if MW of CT could predict biological activity relative to protein precipitability. MW of condensed tannin, protein-precipitable phenolics (PPP), and the amount of protein bound (PB) were determined for nine species of warm-season perennial legumes. There was no correlation between PPP or PB and MW (R2 0.11 and R2 0.02, respectively). However, CT concentration did correlate with PPP and PB (R2 0.81 and R2 0.69, respectively). It was concluded that CT MW does not explain the variation in protein precipitation by CT from the forage legumes surveyed.
1. Introduction
Incorporating rangeland legumes into ruminant production systems has the potential to increase availability of forage crude protein (CP) and metabolizable energy to the animal (Foster et al. Citation2007; Muir et al. Citation2011), and to decrease methane gas production (Tedeschi et al. Citation2011). These effects are generally attributed to the condensed tannins (CTs) that are characteristic of warm-season perennial legumes (Wolfe et al. Citation2008). Despite some reports of antinutritional effects of forage CT on ruminants (Barry & Mcnabb Citation1999; McSweeney et al. Citation2005; Krueger et al. Citation2010), positive effects of dietary CT dominate the current literature (Perez-Maldonado & Norton Citation1996; Min et al. Citation2005; Gurbuz et al. Citation2008).
Dose–response relationships that support the hypothesis that the benefits of forage legumes to ruminants derive from CT have been demonstrated in many studies. Rumen degradability of CP declines as the level of forage CT in the rumen is increased (Azuhnwi et al. Citation2012). There is a dose–response effect of CT on methanogenesis (Tiemann et al. Citation2008). Terrill et al. (Citation2009) reported a dose–response effect of Lespedeza cuneata CT as an anthelmintic. Although the dose–response relationship is strong within each of these studies, the variation in the effects of CT from different plants suggests that there are qualitative as well as quantitative effects.
The hypothesis that CT activity is dependent on structure as well as concentration is supported by several studies that directly compared CT from different species (Cenci et al. Citation2007; Brunet et al. Citation2008; Tiemann et al. Citation2008; Cortes et al. Citation2009). Although the data suggest that the different effects of CT from different plants result from differences in CT structure, other variables obscure the structural relationships. Test system variables such as animal condition, type of plant, other dietary factors such as CP, and environmental factors play a dominant role in animal studies.
Like other polyphenolic compounds, CTs are highly reactive. Although oxidative activity of CT has been the primary focus of human health literature (Koleckar et al. Citation2008), in animal nutrition attention is focused on protein binding. There is an indirect evidence that protein binding is the key biological activity of CT in ruminants. Protein precipitation is a complex function of molecular characteristics of the tannin including its polarity, molecular weight, degree of galloylation, and flexibility (Hagerman et al. Citation1998; Soares et al. Citation2007; Hagerman Citation2012). Any of these factors may be responsible for the differential biological activities of different tannins. The importance of molecular weight in determining protein precipitation by tannins has been demonstrated for groups of closely related compounds (da Silva et al. Citation1991; Kawamoto et al. Citation1995; Sarni-Manchado et al. Citation1999). In general, larger molecular weight tannins precipitate protein more efficiently than lower molecular weight tannins. The objectives of this study were to further test the relationship between molecular weight and biological activity of CT from warm-season perennial legumes using protein precipitation as the surrogate for biological activity and using gel permeation chromatography (GPC) to assess molecular weight of the mixtures of CT extracted from these important forage legumes. Attention was given to identify warm-season perennial legumes that produce biologically active CT and potentially increase the efficiency of protein utilization by ruminants.
2. Materials and methods
2.1. Experimental forages
The plant material consisted of leaves from North American native Leucaena retusa Benth. (littleleaf leadtree), Desmanthus illinoensis (Michx.) MacMill. Ex B.L. Rob. & Fernald (Illinois bundleflower), Lespedeza stuevei Nutt. (tall lespedeza), Mimosa strigillosa Torr. & A. Gray (powderpuff), Neptunia lutea (Leavenworth) Benth. (yellow puff), two ecotypes (STP5, Cross-timbers; STX, South Texas) of Acacia angustissima var. hirta (Nutt.) B.L. Rob (Prairie acacia), and Desmodium paniculatum (L.) DC. var. paniculatum (panicledleaf ticktrefoil), collected in Stephenville, Texas, USA (32°15′N, 98°12′W, altitude 395 m). Arachis glabrata Benth. (rhizoma peanut), selected as a negative control due to its typical low CT concentration, and L. cuneata (Dum. Cours.) G. Don (sericea lespedeza) are introduced species, also collected in Stephenville. The plant stands for these perennial species were all over 4 years old and grown on Windthorst sandy loam soil (Udic Paleustalf: 10 mg/kg N, 13 mg/kg P, 206 mg/kg K, 1416 mg/kg Ca, 247 mg/kg Mg, 15 mg/kg S, 152 mg/kg Na, 10.12 mg/kg Fe, 0.59 mg/kg Zn, 1.10 mg/kg Mn, and 0.22 mg/kg Cu using Mehlich III extraction; Mehlich Citation1984). Leaves were dried at 55°C in a forced air oven for 48 h, then ground to pass a 1-mm screen in a sheer mill (Wiley Arthur H. Thomas Co., Philadelphia, PA, USA) and stored for later chemical analysis. Plants were sampled over a two-day period on 17 and 18 August 2011. Plant samples consisted of only green live-leaf material inclusive of all portions (upper, intermediate, and lower) of the plants sampled. Composites were made to accumulate enough leaf material to extract an adequate amount of CT and to perform the following assays.
2.2. CT purification and quantification
CTs were extracted from plant tissue (25 g) with 70:30 (v/v) acetone:water. Acetone was removed by evaporation under reduced pressure and replaced by methanol. CTs were purified from each plant species using Sephadex LH-20 (GE Healthcare Bio-Sciences Corp., Piscataway, NJ, USA) (Strumeyer & Malin Citation1975). Each extract was mixed with Sephadex LH-20 that was equilibrated in methanol, and the slurry was washed with methanol until the absorbance at 280 nm reached baseline. The tannins were released from the Sephadex by washing with 70:30 (v/v) acetone:water, and the purified tannins were lyophilized. The purified CTs from each individual species were used to develop species-specific standards for the acid butanol assays and for molecular weight determinations.
Total CT concentrations were determined for two replicated samples of each plant species as described by Terrill et al. (Citation1992). Extractable CT (ECT) was extracted from 250 mg of plant tissue with 10 mL of 70:30 (v/v) acetone:water followed by 10 mL of diethyl ether. Protein-bound CT (PBCT) was extracted from the residue with 10 mL of sodium dodecyl sulfate (1% w/v)–mercaptoethanol (5% v/v) containing Tris hydrochloride (0.01 M). Fiber-bound CT (FBCT) was determined using the residue after ECT and PBCT extraction. CTs in each fraction were determined based on absorbance at 550 nm following reaction with butanol–HCl (5% v/v HCl).
2.3. CT molecular weight
Molecular weights of CT from each species were determined by GPC (Waters, Milford, MA, USA) as described by Huang et al. (Citation2010) using a PLgel 3-µm Mixed-E column (Agilent Technologies, Santa Clara, CA, USA) and tetrahydrofuran as the mobile phase. Purified CT extracts were dissolved in tetrahydrofuran up to a final concentration of 0.5 mg/mL and 50 µL was injected at a flow rate of 1.0 mL/min at 25°C. Relative weight-average molecular weights (MW) were calculated based on a calibration curve developed using Polystyrene Low EasiVials (Agilent Technologies, Santa Clara, CA, USA) comprising polystyrene standards ranging from 162 to 38,640 Da.
2.4. Protein precipitability
The scaled-down method described by Hagerman and Butler (Citation1978) was used to determine protein precipitability of CT in three replicate crude plant extracts. Protein precipitation was determined using crude extracts, because of limitations in the quantity of purified tannin. In preliminary experiments, purified tannin from each plant had similar protein precipitation activity to the crude extracts.
2.4.1. Crude plant extracts
Crude plant extracts were prepared for each plant species by extracting 50 mg of plant tissue with 1 mL of 50:50 (v/v) methanol:water on a rotator for 15 min followed by centrifugation at 16,000×g for 5 min at 4°C.
2.4.2. Protein precipitation
To determine protein-precipitable phenolics (PPP) or PB, 50 µl of supernatant from crude plant extracts was combined with 250 µL Buffer A (0.20 M acetic acid, 0.17 M NaCl, pH 4.9), 50-µL bovine serum albumin (BSA) (5 mg/mL in Buffer A), and 50-µL 50:50 (v/v) methanol:water, and incubated at room temperature for 30 min before centrifuging at 16,000×g for 5 min at 4°C. Supernatants were removed by vacuum aspiration and the protein-phenolic pellet was washed with 100 µL Buffer A before re-centrifuging and aspirating.
To determine PPP, the pellets were dissolved in 800 µL of sodium dodecyl sulfate (1% w/v)–triethanolamine (5% v/v) before adding 200 µL of FeCl3 (0.01 M FeCl3 in 0.01 M HCl). Absorbances at 510 nm were read after 15 min. Standard curves for PPP were prepared with stock solutions of CT extracts (1 mg/mL) in deionized water. Levels of 100–700 µL of CT solution were combined with 250 µL Buffer A (0.20 M acetic acid, 0.17 M NaCl, pH 4.9), 50 µL BSA (5 mg/mL in Buffer A) and brought to a final volume of 1 mL with deionized water, and incubated at room temperature for 30 min before centrifuging at 16,000×g for 5 min at 4°C. Supernatants were removed by vacuum aspiration and the protein-phenolic pellet was washed with 100 µL Buffer A before re-centrifuging and aspirating. Pellets were dissolved in 800 µL of sodium dodecyl sulfate (1% w/v)–triethanolamine (5% v/v) before adding 200 µL of FeCl3 (0.01 M FeCl3 in 0.01 M HCl). Absorbances at 510 nm were read after 15 min.
To determine PB, the precipitation reaction was carried out exactly as described above, but the BSA protein–CT pellet was analyzed for N to determine precipitated protein. The pellet was vortexed in 500 µL Buffer A and the solution was transferred into a preweighed foil cup and allowed to dry. The dried protein-phenolic residue was analyzed for N using an Elementar Vario Macro C:N analyzer (Elementar Americas, Inc., Mt. Laurel, NJ, USA). Percent N was converted to protein by multiplying it by 6.25.
2.5. Statistical analyses
The GLIMMIX procedure of SAS (SAS Inst. Inc., Cary, NC, USA) was used for statistical analysis of levels of CT in each species. The model included the main effect of plant species while ECT, PBCT, FBCT, and total CT (TCT) were included as dependent variables. Least square means were estimated using the least squares means (LSMEANS) statement and when significant effects were detected in the model (P ≤ 0.05), the LINES option was used for mean separation. The GLIMMIX procedure of SAS was used for statistical analysis of PPP and protein precipitated (PB and PB to PPP ratio). Replicates consisted of three separate plant tissue extracts, separated by day and assay preparation, on which duplicate lab analyses were performed. The model included the main effect of plant species on the dependent variables PPP, PB, and PB/PPP. Least square means were estimated using the LSMEANS statement and when significant effects were detected in the model (P ≤ 0.05), the LINES option was used for mean separation. PROC REG of SAS was used for regression analysis.
3. Results and discussion
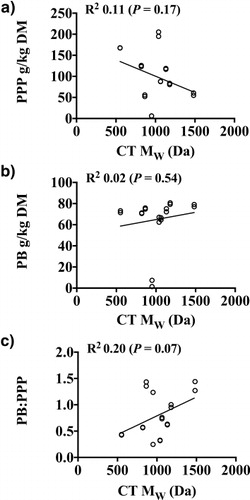
The concentrations of TCT in warm-season perennial legumes () ranged from 3.2% to 12.5%, with the greatest concentrations found in D. paniculatum, M. strigillosa, and L. stuevei. A. glabrata, a non-CT negative control, was confirmed to be CT-free. The apparent weight-average molecular weights of CT purified from these legumes, relative to polystyrene standards, ranged from 552 to 1483 Da ().
Table 1. Legume condensed tannin constituents.
The two most widely used methods for establishing the molecular weight of CT are thiolysis followed by quantitative HPLC analysis of the extender and terminal units (Li et al. Citation2010) or GPC (Bae et al. Citation1994). Thiolysis provides accurate estimates of the mean degree of polymerization, but not the molecular weight distribution (Kennedy & Taylor Citation2003). GPC has been limited by lack of well-characterized standards that have chromatographic behavior similar to CT (Stringano et al. Citation2011). Preliminary analysis of the CT from the forage legumes used in this study revealed that several of the samples were not efficiently depolymerized under standard thiolytic conditions (unpublished data), suggesting either unusual extender units (Venter et al. Citation2012) or recalcitrant interflavan bonds (Yokota et al. Citation2013). Accurate degree of polymerization cannot be established by thiolysis if the reaction is incomplete, so GPC was chosen to determine molecular weights for the CT from the forage legumes surveyed ().
Conditions and standards similar to those used by Huang et al. (Citation2010) were used for GPC to establish apparent molecular weights for the CT from the plants surveyed, which ranged from about 600 to 1500 Da, with similar ranges for either Mn or Mw (). The estimated degree of polymerization based on these apparent molecular weights would be only 2–4 for a typical procyanidin or prodelphinidin. However, the extraction and purification method may have eliminated oligomers namely the Sephadex LH-20 sorption chromatography step (Salminen et al. Citation2011), resulting in low estimates of MW.
Three problems that plague GPC methods for polyphenols including CT have recently been reviewed (Stringano et al. Citation2011). First, polyphenols may interact with chromatographic stationary phases, such as PL-gel, leading to overestimates in molecular weight (Williams et al. Citation1983). Second, calibration plots generated using commercially available standards such as polystyrene tend to underestimate CT sizes (Li et al. Citation2010). Finally, the relationship between hydrodynamic volume and molecular weight appears to be a complex function of the subunit composition for different polyphenols, so even with CT standards it is difficult to generate a reliable calibration plot (Kennedy & Taylor Citation2003). Partial solutions to these problems include the use of complex mobile phases for GPC (Kennedy & Taylor Citation2003) and polyphenols from diverse sources to generate calibration plots (Stringano et al. Citation2011), but it was concluded that even with these approaches, GPC provides an estimate of apparent molecular weight. The data obtained by GPC using polystyrene standards and a simple solvent system were used as measures of relative molecular weight, and to determine whether there was a relationship between these values and the protein-precipitation behavior of the CT from forage legumes.
PPP, PB, and PB/PPP in legume CT extracts () were assessed. The plant species could be divided into three groups based on the PB. Six species, M. strigillosa, N. lutea, L. cuneata, D. illinoensis, A. angustissima STX, and L. stuevei, had PB about 17 times the PB of L. retusa. The other two tannin-containing species had PB about 15 times that of L. retusa. It is possible that these three groups of plants with high, moderate, and low PB might have high, moderate, and low biological values, respectively, using measures related to ruminal escape protein.
The values for PPP were parallel to the values for PB, with just a few large exceptions. Similar to PB, L. retusa had the least PPP, about 15 times less than the PPP for the moderate PPP group. Similar to PB, L. stuevei had a very high PPP, but D. paniculatum, which had a moderate PB, had the highest PPP. M. strigillosa had a high PPP despite having the least PB of the high PB group. The range of values for the high PPP species was about 1.7-fold, while the range for PB was only about 1.1-fold, reflecting more variability in PPP than for PB.
The ratio between PB and PPP reveals the efficiency of action by the tannins, with a large ratio indicating a very efficient protein-precipitating agent. The two species with the largest PB/PPP, D. illinoensis and L. cuneata, had a high PB and a moderate PPP, while the species with the smallest ratio, D. paniculatum, had a moderate PB but very high PPP. The species with the least PPP and PB, L. retusa, had an intermediate ratio. At this time, it is not clear whether the PB, the PPP, or the ratio more accurately predicts biological activity.
The protein-precipitation data were combined with the apparent molecular weight data from GPC to test the hypothesis about the relationship between tannin size and protein binding. In the present study, there was no correlation between PPP, PB or the ratio PB/PPP and the apparent MW of CT (). CTs extracted from L. cuneata had the greatest apparent Mw of all species surveyed, had a high PB, and only had a moderate PPP. CTs extracted from L. stuevei had the lowest MW, a high PB, and greater PPP than L. cuneata. D. paniculatum had the greatest PPP and had a large apparent MW, but had a moderate PB and the smallest PB/PPP. While there was no relationship between apparent MW and PB, PPP, or PB/PPP, L. cuneata had the greatest MW CT, which was among the largest PB/PPP. The lack of overall correlation suggests that there are other factors involved.
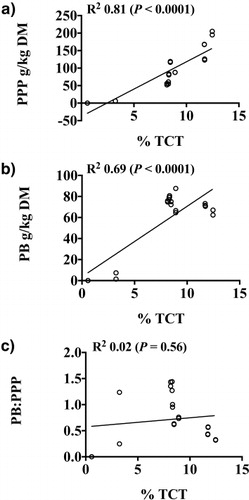
The amount of acid butanol–reactive tannin, TCT, in each plant species had strong, positive correlations with PPP and PB (a and b). D. paniculatum had the greatest TCT and PPP but moderate PB, whereas L. retusa had the least TCT, PPP, and PB. The correlations of PB and PPP with TCT agree with Tharayil et al. (Citation2011) who reported positive correlations between CT and protein precipitation for extracts of leaf litter from Acer rubrum. In contrast, however, Martin and Martin (Citation1982) measured the phenolic, proanthocyanidin, and protein-precipitating constituents in extracts from foliage of six Quercus species and reported no correlation between CT and protein-precipitating capacity. It is possible that the lack of correlation reported was a function of the proanthocyanidin assay used (Hillis & Swain Citation1959), which may have only accounted for the ECT and not the PBCT or FBCT fractions, or the protein-precipitation method used (Hagerman & Butler Citation1978), which differed from the radial diffusion assay (Hagerman Citation1987) used by Tharayil et al. (Citation2011).
A second objective of this study was to identify warm-season perennial legumes that produce biologically active CT and potentially increase the efficiency of protein utilization by ruminants, with special attention given to the use of North American native species. Four of the seven North American native warm-season perennial legumes included in this study had greater PPP than the introduced species L. cuneata, which has proven biological activity. However, only three of the seven native species, N. lutea, D. illinoensis, and A. angustissima STX, had equal PB to L. cuneata.
Ruminants consuming a diet that includes legumes containing biologically active CT could experience an increase in the overall efficiency of protein utilization due to decreased ruminal protein degradation, resulting in more plant protein entering the lower gastrointestinal tract (GIT) and increased intestinal absorption of amino acids (Perez-Maldonado & Norton Citation1996). An additional advantage is decreased loss of nitrogen (N) from ammonia (NH3), following ruminal proteolysis and amino acid deamination (Min et al. Citation2005; Gurbuz et al. Citation2008). Protein–CT complexes that form in the rumen but dissociate in the abomasum could alter protein digestibility. Spalinger et al. (Citation2010) reported that feeding plants containing CT reduced protein digestibility in moose by 38%. However, Kariuki and Norton (Citation2008) reported that CT–protein complexes become dissociated in the GIT, where protein degradation and subsequent amino acid absorption can occur. It is possible that the reduction in protein digestibility observed by Spalinger et al. (Citation2010) was a result of CT re-complexing with endogenous proteins in the lower GIT due to the lack of any mechanism for CT to undergo digestion in the GIT (Kariuki & Norton Citation2008).
CT–protein complexes may also cause a shift in N excretion from urinary ammonia (NH3–N), which has potentially detrimental effects on the environment, to fecal N. Perez-Maldonado and Norton (Citation1996) reported that in sheep and goats fed diets containing D. intortum or C. calothyrsus containing TCT at 0.95 and 2.25%, respectively, there was as much as a 14% increase in fecal N excretion. In agreement, Dschaak et al. (Citation2011) reported that in lactating dairy cows supplemented with Schinopsis spp. (Quebracho) tannin extract at a concentration of 3% of the diet, there was a shift in N excretion. It is possible that N absorption by ruminants consuming CT is decreased, resulting in apparent shifts from urinary N to fecal N. However, Perez-Maldonado and Norton (Citation1996) reported 19% greater absorption of N in sheep and goats fed diets containing CT.
In regard to increasing efficiency of protein utilization and potentially altering the form of N excreted by ruminants from that of urinary NH3 to fecal N, which is often incorporated into bacterial proteins, results from the present study indicate that ruminants would have to consume 1.2 times as much D. paniculatum or A. angustissima STP5 to achieve similar PB to that of L. cuneata or N. lutea. This may be a function of the protein-binding capacity of CT. The protein-binding capacity of PPP from L. cuneata was more than four times greater than that of D. paniculatum, which had a PPP concentration almost four times greater than that of L. cuneata. Differences in protein-binding capacity of PPP could translate into differences in biological value of forages consumed by ruminants, especially as it relates to ruminal escape protein.
4. Conclusions
The tannins in the plant species examined here were all CTs, which led us to initially speculate that there might be a strong relationship between apparent molecular weight and protein precipitation by CT contained in the crude plant extracts. The data do not support that hypothesis. Preliminary structural analysis using acid butanol or thiolysis to provide monomer composition suggests that although the tannins from these plants are all CTs, there is a significant structural diversity among them (unpublished data). As a result, it will be necessary to elucidate structural details to understand the molecular basis for different protein-precipitating abilities of the CT from these plant species.
North American warm-season perennial legumes that have promise for use in ruminant diets for the purpose of binding proteins were identified. Use of these legumes in ruminant production could potentially increase the efficiency of protein utilization by ruminants and alter the form of N excreted. Further in vivo evaluations of L. stuevei, M. strigillosa, N. lutea, D. illinoensis, D. paniculatum, and two ecotypes of A. angustissima var. hirta are warranted to determine if in vitro and in vivo data are correlated and to identify which species truly increase protein utilization by ruminants.
Acknowledgments
The authors would like to acknowledge Dudley and Angela Smith for providing the Dudley T. and Angela Smith Travel Grant, which funded travel to Miami University (Oxford, OH) for the purpose of conducting protein-precipitation experiments.
Related Research Data
References
- Azuhnwi BN, Thomann B, Arrigo Y, Boller B, Hess HD, Kreuzer M, Dohme-Meier F. 2012. Ruminal dry matter and crude protein degradation kinetics of five sainfoin (Onobrychis viciifolia Scop) accessions differing in condensed tannin content and obtained from different harvests. Anim Feed Sci Tech. 177:135–143. 10.1016/j.anifeedsci.2012.08.004
- Bae YS, Foo LY, Karchesy JJ. 1994. GPC of natural procyanidin oligomers and polymers. Holzforschung. 48:4–6. 10.1515/hfsg.1994.48.1.4
- Barry TN, Mcnabb WC. 1999. The implications of condensed tannins on the nutritive value of temperate forages fed to ruminants. Brit J Nutr. 81:263–272.
- Brunet S, Jackson F, Hoste H. 2008. Effects of sainfoin (Onobrychis viciifolia) extract and monomers of condensed tannins on the association of abomasal nematode larvae with fundic explants. Int J Parasitol. 38:783–790. 10.1016/j.ijpara.2007.10.018
- Cenci FB, Louvandini H, McManus CM, Dell'Porto A, Costa DM, Araujo SC, Minho AP, Abdalla AL. 2007. Effects of condensed tannin from Acacia mearnsii on sheep infected naturally with gastrointestinal helminthes. Vet Parasitol. 144:132–137. 10.1016/j.vetpar.2006.09.021
- Cortes JE, Moreno B, Pabon ML, Avila P, Kreuzer M, Hess HD, Carulla JE. 2009. Effects of purified condensed tannins extracted from Calliandra, Flemingia and Leucaena on ruminal and postruminal degradation of soybean meal as estimated in vitro. Anim Feed Sci Tech. 151:194–204. 10.1016/j.anifeedsci.2009.01.015
- Da Silva JMR, Cheynier V, Souquet JM, Moutounet M, Cabanis JC, Bourzeix M. 1991. Interaction of grape seed procyandins with various proteins in relation to wine fining. J Sci Food Agric. 57:111–125. 10.1002/jsfa.2740570113
- Dschaak CM, Williams CM, Holt MS, Eun JS, Young AJ, Min BR. 2011. Effects of supplementing condensed tannin extract on intake, digestion, ruminal fermentation, and milk production of lactating dairy cows. J Dairy Sci. 94:2508–2519. 10.3168/jds.2010-3818
- Foster JL, Muir JP, Lambert BD, Pawelek D. 2007. In situ and in vitro degradation of native Texas warm-season legumes and alfalfa in goats and steers fed a sorghum-sudan basal diet. Anim Feed Sci Tech. 133:228–239. 10.1016/j.anifeedsci.2006.04.005
- Gurbuz Y, Kaplan M, Davies DR. 2008. Effects of condensed tannin content on digestibility and determination of nutritive value of some selected native legumes species. J Anim Vet Adv. 7:854–862.
- Hagerman AE. 1987. Radial diffusion method for determining tannin in plant extracts. J Chem Ecol. 13:437–449. 10.1007/BF01880091
- Hagerman AE. 2012. Fifty years of polyphenol–protein complexes. Rec Adv Polyphenol Res. 3:71–97.
- Hagerman AE, Butler LG. 1978. Protein precipitation method for the quantitative determination of tannins. J Agric Food Chem. 26:809–812. 10.1021/jf60218a027
- Hagerman AE, Rice ME, Ritchard NT. 1998. Mechanisms of protein precipitation for two tannins, pentagalloyl glucose and epicatechin(16) (4 -> 8) catechin (procyanidin). J Agric Food Chem. 46:2590–2595. 10.1021/jf971097k
- Hillis WE, Swain T. 1959. The phenolic constituents of Prunus domestica: The Analysis of tissues of the victoria plum tree. J Sci Food Agric. 10:135–144. 10.1002/jsfa.2740100211
- Huang XD, Liang JB, Tan HY, Yahya R, Khamseekhiew B, Ho YW. 2010. Molecular weight and protein binding affinity of Leucaena condensed tannins and their effects on in vitro fermentation parameters. Anim Feed Sci Tech. 159:81–87. 10.1016/j.anifeedsci.2010.05.008
- Kariuki IW, Norton BW. 2008. The digestion of dietary protein bound by condensed tannins in the gastro-intestinal tract of sheep. Anim Feed Sci Tech. 142:197–209. 10.1016/j.anifeedsci.2007.08.006
- Kawamoto H, Nakatsubo F, Murakami K. 1995. Quantitative determination of tannin and protein in the precipitates by high-performance liquid chromatography. Phytochemistry. 40:1503–1505. 10.1016/0031-9422(95)00451-C
- Kennedy JA, Taylor AW. 2003. Analysis of proanthocyanidins by high-performance gel permeation chromatography. J Chromatogr. 995:99–107. 10.1016/S0021-9673(03)00420-5
- Koleckar V, Kubikova K, Rehakova Z, Kuca K, Jun D, Jahodar L, Opletal L. 2008. Condensed and hydrolysable tannins as antioxidants influencing the health. MiniRev Med Chem. 8:436–447. 10.2174/138955708784223486
- Krueger WK, Gutierrez-Banuelos H, Carstens GE, Min BR, Pinchak WE, Gomez RR, Anderson RC, Krueger NA, Forbes TDA. 2010. Effects of dietary tannin source on performance, feed efficiency, ruminal fermentation, and carcass and non-carcass traits in steers fed a high-grain diet. Anim Feed Sci Tech. 159:1–9. 10.1016/j.anifeedsci.2010.05.003
- Li C, Leverence R, Trombley JD, Xu S, Yang J, Tian Y, Reed JD, Hagerman AE. 2010. High molecular weight persimmon (Diospyros kaki L.) proanthocyanidin: a highly galloylated, A-linked tannin with an unusual flavonol terminal unit, myricetin. J Agric Food Chem. 58:9033–9042. 10.1021/jf102552b
- Martin JS, Martin MM. 1982. Tannin assays in ecological studies: lack of correlation between phenolics, proanthocyanidins and protein-precipitating constituents in mature foliage of six oak species. Oecologia. 54:205–211. 10.1007/BF00378394
- McSweeney CS, Gough J, Conlan LL, Hegarty MP, Palmer B, Krause DO. 2005. Nutritive value assessment of the tropical shrub legume Acacia angustissima: anti-nutritional compounds and in vitro digestibility. Anim Feed Sci Tech. 121:175–190. 10.1016/j.anifeedsci.2005.02.017
- Mehlich A. 1984. Mehlich 3 soil test extractant: a modification of Mehlich 2 extractant. Commun Soil Sci Plant Anal. 15:1409–1416. 10.1080/00103628409367568
- Min BR, Pinchak WE, Fulford JD, Puchala R. 2005. Wheat pasture bloat dynamics, in vitro ruminal gas production, and potential bloat mitigation with condensed tannins. J Anim Sci 83:1322–1331.
- Muir JP, Pitman WD, Foster JL. 2011. Sustainable, low-input, warm-season, grass-legume grassland mixtures: mission (nearly) impossible? Grass Forage Sci. 66:301–315. 10.1111/j.1365-2494.2011.00806.x
- Perez-Maldonado RA, Norton BW. 1996. The effects of condensed tannins from Desmodium intortum and Calliandra calothyrsus on protein and carbohydrate digestion in sheep and goats. Brit J Nutr. 76:515–533. 10.1079/BJN19960060
- Salminen JP, Karonen M, Sinkkonen J. 2011. Chemical ecology of tannins: recent developments in tannin chemistry reveal new structures and structure–activity patterns. Chem Eur J. 17:2806–2816. 10.1002/chem.201002662
- Sarni-Manchado P, Cheynier V, Moutounet M. 1999. Interactions of grape seed tannins with salivary proteins. J Agric Food Chem. 47:42–47. 10.1021/jf9805146
- Soares S, Mateus N, De Freitas V. 2007. Interaction of different polyphenols with bovine serum albumin (BSA) and human salivary alpha-amylase (HSA) by fluorescence quenching. J Agric Food Chem. 55:6726–6735. 10.1021/jf070905x
- Spalinger DE, Collins WB, Hanley TA, Cassara NE, Carnahan AM. 2010. The impact of tannins on protein, dry matter, and energy digestion in moose (Alces alces). Can J Zool. 88:977–987. 10.1139/Z10-064
- Stringano E, Gea A, Salminen JP, Mueller-Harvey I. 2011. Simple solution for a complex problem: proanthocyanidins, galloyl glucoses and ellagitannins fit on a single calibration curve in high performance-gel permeation chromatography. J Chromatogr. 1218:7804–7812. 10.1016/j.chroma.2011.08.082
- Strumeyer DH, Malin MJ. 1975. Condensed tannins in grain sorghum: isolation, fractionation, and characterization. J Agric Food Chem. 23:909–914. 10.1021/jf60201a019
- Tedeschi LO, Callaway TR, Muir JP, Anderson RC. 2011. Potential environmental benefits of feed additives and other strategies for ruminant production. R Bras Zootec. 40:291–309.
- Terrill TH, Dykes GS, Shaik SA, Miller JE, Kouakou B, Kannan G, Burke JM, Mosjidis JA. 2009. Efficacy of sericea lespedeza hay as a natural dewormer in goats: dose titration study. Vet Parasitol. 163:52–56. 10.1016/j.vetpar.2009.04.022
- Terrill TH, Rowan AM, Douglas GB, Barry TN. 1992. Determination of extractable and bound condensed tannin concentrations in forage plants, protein concentrate meals and cereal grains. J Sci Food Agric. 58:321–329. 10.1002/jsfa.2740580306
- Tharayil N, Suseela V, Triebwasser DJ, Preston CM, Gerard P, Dukes JS. 2011. Changes in the structural composition and reactivity of Acer rubrum leaf litter tannins exposed to warming and altered precipitation: climatic stress-induced tannins are more reactive. New Phytol. 191:132–145. 10.1111/j.1469-8137.2011.03667.x
- Tiemann TT, Lascano CE, Wettstein HR, Mayer AC, Kreuzer M, Hess HD. 2008. Effect of the tropical tannin-rich shrub legumes Calliandra calothyrsus and Flemingia macrophylla on methane emission and nitrogen and energy balance in growing lambs. Animal. 2:790–799. 10.1017/S1751731108001791
- Venter PB, Senekal ND, Kemp G, Amra-Jordaan M, Khan P, Bonnet SL, Van der Westhuizen JH. 2012. Analysis of commercial proanthocyanidins. Part 3: the chemical composition of wattle (Acacia mearnsii) bark extract. Phytochemistry. 83:153–167. 10.1016/j.phytochem.2012.07.012
- Williams VM, Porter LJ, Hemingway RW. 1983. Molecular weight profiles of proanthocyanicin polymers. Phytochemistry. 22:569–572.
- Wolfe RM, Terrill TH, Muir JP. 2008. Drying method and origin of standard affect condensed tannin (CT) concentrations in perennial herbaceous legumes using simplified butanol-HCl CT analysis. J Sci Food Agric. 88:1060–1067.
- Yokota K, Kimura H, Ogawa S, Akihiro T. 2013. Analysis of A-Type and B-Type highly polymeric proanthocyanidins and their biological activities as nutraceuticals. J Chem. Article ID 352042, 7 pages. http://dx.doi.org/10.1155/2013/352042.