
Abstract
Forest ecosystems play dominant roles in global carbon budget because of the large quantities stored in live biomass, detritus, and soil organic matter. Researchers in various countries have investigated regional and continental scale patterns of carbon (C) stocks in forest ecosystems; however, the relationship between stand age in different components (vegetation, forest floor detritus, and mineral soil) and C storage and sequestration remains poorly understood. In this paper, we assessed an age sequence of 18-, 20-, 25-, 38-, and 42-year-old Pinus tabulaeformis planted by analyzing the vertical distribution of different components biomass with similar site conditions on Mt. Taiyue, Shanxi, China. The results showed that biomass of P. tabulaeformis planted stands was ranged from 88.59 Mg ha−1 for the 25-year-old stand to 231.05 Mg ha−1 for the 42-year-old stand and the major biomass was in the stems. Biomass of the ground vegetation varied from 0.51 to 1.35 Mg C ha−1 between the five stands. The forest floor biomass increased with increasing stand age. The mean C concentration of total tree was 49.94%, which was higher than C concentrations of ground vegetation and forest floor. Different organs of trees C concentration were between 54.14% and 47.74%. C concentrations stored in the mineral soil for each stand experienced decline with increasing soil depth, but were age-independent. Total C storage of five planted forests ranged from 122.15 to 229.85 Mg C ha−1, of which 51.44–68.38% of C storage was in the soil and 28.46–45.21% in vegetation. The study provided not only with an estimation biomass of P. tabulaeformis planted forest in Mt. Taiyue, Shanxi, China, but also with accurately estimating forest C storage at ecosystem scale.
Introduction
Global warming and climate change have inspired an increasing concern on the study of global carbon (C) storage and C balance (Landsberg et al. Citation1995). Atmospheric carbon dioxide (CO2) concentration predicted to reach 550 µl l−1 by 2050 (Meehl et al. Citation2007; Oehme et al. Citation2013). There is a general agreement that forests can play multiple and significant roles in regulating atmospheric concentrations of carbon dioxide (Rotter & Danish Citation2002). Natural forests have been reduced from 46% of the earth's terrestrial ecosystems in preindustrial times to 28% today in the world (Winjum & Paul Citation1997). Reforestation and afforestation are expected to contribute to the mitigation of increasing CO2 concentrations in the atmosphere by sequestrating atmospheric C in tree biomass (Nabuurs et al. Citation2007) and in soil (Paul et al. Citation2002). Thus increasing the areas of forest land by afforestation is an alternative way to promote C storage (Brown et al. Citation1999). Based upon Winjum and Paul's estimates (Citation1997), planted forests in the world may take up 0.178 Pg C/yr. Recent research estimated that the C storage in China's planted forests amounted to 0.77 Pg C in 1999–2003, approximately occupying 7% of total C storage in the world forest plantations (Xu & Li Citation2010). Therefore, China's planted forests contribute significantly to global terrestrial C sinks (Zhang et al. Citation2000; Fang et al. Citation2001; Streets et al. Citation2001).
During the past couple of decades, numerous studies have improved our understanding of forest-atmosphere C exchange at large scales (Dixon et al. Citation1994; Jobbagy & Jackson Citation2000; Piao et al. Citation2005). However, little research was conducted on ecosystem-scale forest C budgets. Ecosystem-scale studies of C budgets can help evaluate this spatial heterogeneity and uncertainty and understand ecological processes and driving forces of the C cycle (Fang et al. Citation2007). To monitor the C stock in artificial forest ecosystem at ecosystem level could be helpful to the improvement of the precision of forest C sequestration evaluation (Huang et al. Citation2008). Stand age is a powerful predictor of ecosystem structure and function in even-aged stands (Bradford & Kastendick Citation2010) and may affect C storage in forest ecosystems (Pregitzer & Euskirchen Citation2004). In addition, various ecosystem components (vegetation properties, forest floor detritus, and mineral soil) respond differently to variations in these controlling factors (Zhu et al. Citation2010). Consequently, it is essential to understand the relationship between stand age in different components and C storage and sequestration.
Pinus tabulaeformis, which is one of the most commonly used species in forest plantations in China, is a woody perennial and is also an endemic and widespread conifer species in northern China (Xu Citation1990). Furthermore, P. tabulaeformis planted forest has a role in providing environmental service such as felling negative impacts on C cycle through the uptake and storage of C. Therefore, there is a need for accurate information concerning the C stocks in P. tabulaeformis planted forest. Previous studies have improved our understanding of the changes in biotic and ecological characteristics of P. tabulaeformis planted forests, including forest volume, biomass and net primary production at local scale (Ma Citation1983; Xiao Citation1990; Zhao & Zhou Citation2005), but little attention was paid on the dynamics of biomass and C storage with age structure variation. To quantify changes in C stocks and allocation in P. tabulaeformis planted forests in an age sequence will help us better predict the response of regional and global C balance to future climate change. Our objective was to characterize how stand age influences biomass and C storage and sequestration in chronosequences of even-aged P. tabulaeformis stands in Mt. Taiyue.
Materials and methods
Study description and experimental design
The study was conducted at a field site of the Mt. Taiyue in Shanxi, China (112°01′∼112°15′E, 36°31′∼36°43′N, elevation 1150–2088 m above sea level). The climate of the region is a continental monsoon type with a humid and rainy summer and a cold and snowy winter. The annual mean air temperature for the area is 8°C. The mean annual precipitation ranges between 600 and 650 mm, occurring mainly from July to September. The frost-free period lasts for 125 days in average, with an early frost in October and late frost in April. The soil type is a typical brown forest soil with a thickness of 60–110 cm. The study field is an artificial forest dominated by P. tabulaeformis that have been protected since the 1990s. Thinning is an important and common silviculture practice in P. tabulaeformis stand. Twice applied during the period after stand establishment, these management operations aim at the enhancement of tree growth, vitality, as well as stem and wood quality. The first thinning in the 25-year-old stand has been done after 24 years from establishment, while in both the 38- and 42-year-old stands after 22 years from establishment. And the second thinning in the 38- and 42-year-old stands was carried out after 36 years from establishment.
Field sampling was conducted in five sites with stand ages of 18, 20, 25, 38, and 42 years. In each stand, three 20 m × 30 m plots were laid out in July 2010. The plots consisted of the tree layer: the shrub layer and the herb layer. The dominant overstory vegetation in all stands was P. tabulaeformis. The shrub layer includes Elaeagnus umbellata and Rubus parvifolius and the herb layer includes Carex rigescens and Dendranthema chanetii. The detailed information of these forest stands is shown in .
Table 1. Characteristics of study for five planted stands of P. tabulaeformis forest in Taiyue Mt., Shanxi, China.
Data collection
Sampling
In each plot, the species of all live and dead trees with woody stems exceeding 3 cm breast-height diameter were identified. The diameter at breast height (DBH), tree height, and crown dimensions of each tree were measured and recorded, whereas sampling for shrub layer and herb layer conducted in five 2 m × 2 m subplots and 1 m × 1 m subplots respectively located randomly within 20 m × 30 m plot.
In early August 2010, a total of 19 trees with DBH ranging between 6.1 and 20.7 cm were selected for a destructive analysis of above- and below-ground biomass. The trees were chosen to represent the widest range of DBH and competition situations existing in the research site. Before the subject trees were cut, the DBH was measured. Then the sample trees were cut at a height of 20 cm above the ground. After felling, all branches were then clipped from the tree, separated into foliage and branches, and fresh weights were determined using balance. After all the branches were removed, the total tree length (H) was recorded, and then stems were cut into 1 m or 2 m sections and weights. A 2 cm thick disk was cut from the base of stem section and weighted on an electronic balance. Then subsamples of each component were oven-dried at 65°C to constant mass and weighed to the nearest 0.1 g. The entire root systems of sample trees were carefully excavated, further sorted into coarse (with a diameter ≥5 mm) and fine (with a diameter <5 mm) roots. The entire root system was washed lightly to remove soil and the dry mass of the sampled root was calculated by multiplying the wet mass of root by the dry/wet ratio of each sample.
In each plot, the biomass of tree was estimated using the allometry method. Biomass growth is highly relative to tree diameter at height. The relationship between biomass of each organ of tree and the tree diameter (D) is established. All relationships are nonlinear and highly significant (P < 0.001) for all components. The R2 values range from 0.941 to 0.983 ().
Table 2. Biomass equations for different components (stem, bark, branch, foliage, and root) and whole trees of P. tabulaeformis for planted forest in Taiyue Mt., Shanxi, China. Equation is expressed as LnW=a+bLn(D), where D is DBH (cm) of a tree.
In contrast, the biomass of ground vegetation was estimated trough destructive sampling. In destructive sampling, the vegetation in a given area was cut and weighed (fresh weight), and the subsamples of them was dried at 65°C, and weighed again after oven-drying.
Meanwhile, Forest floor materials including fine woody debris (< 2.5 cm in diameter), litter, and dead moss were collected from 5 randomly located subplots (1 m × 1 m) in each plot. Samples were oven-dried at 65°C to constant mass and weighted to the nearest 0.1 g.
Three soil pits down to 100 cm were excavated in each plot. Forest floor was removed before mineral soil sampling. One soil sample was taken at 0–10 cm, 10–20 cm, 20–30 cm, 30–50 cm, 50–70 cm, and 70–100 cm depths by using a stainless cylinder with 100 cm3. Bulk density was determined by drying for 12 h at 105°C. The other samples obtained were placed into plastic bags and air-dried after they were transported to the laboratory and then hand-sieved through a 2 mm screen to remove roots and other debris.
C concentrations
The C concentrations of all samples (tree and ground vegetation tissue, forest floor, and mineral soil) were analyzed for organic C by vario Macro Elemental Analyzer (Elementar Analysensysteme GmbH, Germany).
C content
Vegetation C content was calculated as the product of dry mass and C concentration of different components. Biomass of tree and ground vegetation were separately calculated and summed to estimated vegetation C density of the whole plot.
Forest floor C content was calculated as the product of dry mass and C concentration of samples.
Based on bulk density and organic matter content of each soil layer, we calculated total organic matter density in the top 1 m of each profile.
Total C storage consists of the sum of C stocks from all components, i.e. vegetation, forest floor, and soil organic matter. All values were represented in Megagram carbon per hectar (Mg C ha−1).
Data analysis
Statistical analyses were conducted using SPSS 15.0 software. One-way analysis of variance (ANOVA) (least-significant difference [LSD] test) was used to detect statistically significant differences of C storage among the five planted forests.
Results
Biomass in planted forests of P. tabulaeformis
With the logarithmic regression equations, the biomass of tree components was estimated in the five P. tabulaeformis stands (). Total tree biomass of these five stands was 100.40, 108.58, 77.33, 125.12, and 206.34 Mg ha−1 for the 18-, 20-, 25-, 38-, and 42-year-old stands, respectively. Stem biomass represented 47.63%, 49.55%, 50.56%, 59.02%, and 60.85% of total tree biomass in the 18-, 20-, 25-, 38-, and 42-year-old stands, respectively. Biomass distribution pattern among tree components for P. tabulaeformis species was distributed as stem>roots>branch>foliage>bark in the 18-, 20-, and 25-year-old stands, but bark biomass was higher than branch biomass in the 38- and 42-year-old stands which was mainly due to a rapid increase of stem. The root to shoot ratio of five stands ranged from 0.17 for the 42-year-old stand to 0.30 for the 18-year-old stand, with an average value of 0.24.
Table 3. Biomass (Mg ha−1) in tree, forest ground vegetation and floor in the 18-, 20-, 25-, 38-, and 42-year-old stands (stand mean ± within-stand SD).
A correlation of ground vegetation biomass with stand age was not observed across this chronosequence stands. Ground vegetation biomass ranged from 0.51 Mg ha−1 in the 20-year-old stand to 1.35 Mg ha−1 in the 38-year-old stand (). Forest floor biomass increased steadily across this chronosequence stands (), ranging from 7.96 to 23.91 Mg ha−1.
C concentrations by ecosystem component
The C concentrations of tree components were demonstrated in . Different components of tree have different C concentrations. Within tree components, higher C concentration was found in the branch than that in the other components, with a mean value of 54.14%. The C concentrations in the tree foliage had the lowest values compared to the other components. The mean C concentration of total tree was 49.94%.
Table 4. C concentrations in different organs of P. tabulaeformis.
The C concentrations of ground vegetation and forest floor in the five P. tabulaeformis planted stands were listed in . C concentration in shrub and herb was within a narrow range of 44.51–48.84% and 41.04–44.09% of dry biomass in five P. tabulaeformis planted stands. C concentrations of forest floor ranged from 37.78% in the 18-year-old stand to 43.35% in the 38-year-old stand (). On average, the highest C concentration was showed in shrub layer, while the lowest in the forest floor layer in each stand.
Table 5. C concentrations in ground vegetation and forest floor (%). (stand mean ± within-stand SD).
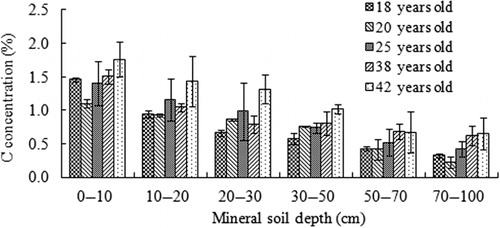
C concentrations stored in the mineral soil for each stand decreased with increasing soil depth classes from approximately 1.76% at 0–10 cm depth to 0.22% at 70–100 cm depth (). However, no further age-related increase observed between the 18- and 42-year-old stand, indicating no clear age-effect on the mineral soil C concentrations.
C storages
The C pools of the main ecosystem components in the five P. tabulaeformis planted stands were summarized in . Vegetation C content of five planted stands varied from 39.19 Mg C ha−1 in the 25-year-old stand to 103.92 Mg C ha−1 in the 42-year-old stand, most of which came from trees and less than 1% from ground vegetation. The ratio of root to shoot ecosystem C was 0.29, 0.28, 0.26, 0.19, and 0.17 for the 18-, 20-, 25-, 38-, and 42-year-old stands, respectively.
Table 6. C pools (Mg C ha−1) in and their allocation to organs for 18-, 20-, 25-, 38-, and 42-year-old stands.
The observed C content within forest floor across all age groups ranged from 2.92 to 7.68 Mg C ha−1. By comparing the trends, it was clear that the forest floor C content increases as the stand age increases and this was due to the increase of litter input and slow decomposition.
Mean total C content of mineral soil from 0 cm to 100 cm depth in the 8-, 19-, 30-, 35-, and 51-year-old stands was 68.52, 73.08, 94.17, 109.72, and 118.24 Mg C ha−1. The mineral soil C content within 0–10 cm was much greater when compared to the C content in other soil depths. Approximately 40% of mineral soil C was sequestrated within the upper 30 cm of each stand.
Total ecosystem C storage increased with age in the planted forests (). The mean total ecosystem C across all age classes was 160.21 Mg C ha−1. Variability in total ecosystem C was relatively low through the first three age classes, but was very high in the older age class. The variation of C stocks among the stands of different age was statistically significant according to one-way ANOVA test with confidence interval of 95%. There were no differences on the ecosystem C storage among the 18-, 20- and 25-year-old stands, whereas the C stocks of younger stands were significantly different with the 38- and 42-year-old stands.
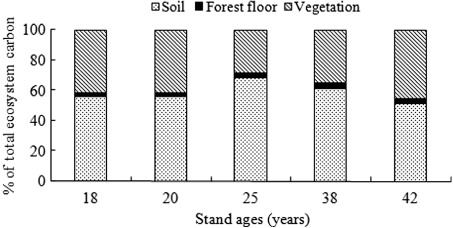
Different forest stands exhibited different patterns of C partitioning in ecosystem component. showed the relative contribution of each individual C pool to the total ecosystem C content in this chronosequence study. Mineral soil was the dominant C pool in the five stands. Allocation of total ecosystem C to vegetation, forest floor, and soil peaked in 42-year-old stand for vegetation (45.21%), 38-year-old stand for forest floor (3.93%), and 25-year-old stand for vegetation (68.38%), respectively.
Discussion
Biomass
Forest biomass is an important quantitative character for forest ecosystems. Stand age is the most important variable for estimating the different biomass components agrees with previously published studies (e.g. Pan et al. Citation2004; Xu & Li Citation2010). In our study, total tree biomass (stem, bark, branch, foliage, and root) was ranged from 77.33 Mg C ha−1 for 25-year-old stand to 200.12 Mg C ha−1 for 42-year-old stand. The result showed a rapid decline from the 20- to the 25-year-old stand, which might result from heavy thinning work at the age of 20–25 years for increasing the growth rate of trees in P. tabulaeformis planted forest, whereas there was a rapid increase from the 38- to the 42-year-old stand demonstrating a fast accumulation of tree biomass in middle-age stand. The proportion of stem to total tree biomass varied significantly in this chronosequence study. Hence, total tree biomass may be considerably underestimated by forest inventories that are normally limited to stem biomass. Meanwhile, tree root biomass accounted for approximately one-quarter of the total tree biomass in this chronosequence study on average, which highlights the importance of roots in a biomass estimation of P. tabulaeformis planted stands. The root to shoot ratio includes the effect of biomass accumulation in woody tissue over time and acts as an indication of cumulative biomass storage patterns (Litton et al. Citation2003). Previous studies have reported a linear relationship between aboveground and belowground biomass for maturing and old-growth trees on stand-level (Brown Citation2002; Peichl & Arain Citation2007). In our study, the average root to shoot ratio of 0.24 is also in accordance with the standard root to shoot ratio of 0.23 and 0.26 reported for coniferous species by Kurz et al. (Citation1996) and Cairns et al. (Citation1997), respectively.
Few studies measured ground vegetation (shrub and herb) and forest floor biomass in P. tabulaeformis planted stands. Overall, ground vegetation biomass in this chronosequence was relatively low compared to other studies. For example, Li et al. (Citation2011) estimated forest ground vegetation biomass (shrub, herb) of 2.34 and 3.76 Mg C ha−1 in 19- and 35-year-old Korean pine (Pinus koraiensis) stands, respectively. Furthermore, ground vegetation biomass was variable in this pine chronosequence. Such variation may depend on forest management, stand-specific canopy, and soil conditions, which affect light, water, and nutrient availability for the development of ground vegetation (Peichl & Arain Citation2006). In contrast, forest floor increased steadily across this chronosequence stands. The result was in accordance with the result from Böttcher and Springob (Citation2001), who reported that the forest floor biomass of pine in Northern Germany increases with stand age.
C concentration
Most researchers estimate C by assuming the C concentration of dry biomass to be a constant 45–50% by weight (Montagnini & Porras Citation1998; Losi et al. Citation2003). Recent analyses showed that the C concentration of tree components or tree species might be either above or below 50% (e.g. Bert & Danjon Citation2006; Zheng et al. Citation2008). C concentration of the tree components is within a range of 47.74–54.14% of dry biomass in our study, and with an average of 49.94%. However, Ma et al. (Citation2002) reported that C concentration of P. tabulaeformis tree was 51.05%, with a range of 49.58–53.11%. The potential cause of this inconsistency may be affected by the analysis method, stand age, pedoclimatic conditions, and origin (Bert & Danjon Citation2006). The mean C concentrations of herb and forest floor were lower than 45%. Therefore, applying standard C concentration of 45–50% may cause significant errors in up-scaling of C pools. For instance, assuming 50% C concentration for herb in the 38-year-old stand and for forest floor in the 42-year-old stand would result in a difference of 0.56 Mg C ha−1 (14%) and 11.96 Mg C ha−1 (56%), respectively. Thus, the accuracy of the C content assessments may be improved by using the specific C concentrations for individual components.
C storage
This is the first complete and thorough estimate of C partitioning in all ecosystem components (vegetation, forest floor, and soil) for P. tabulaeformis planted forests in an age sequence on Mt. Taiyue. Our results suggested that age plays an important role in influencing the overall ecosystem C storage and can provide insight into C sequestration (Pregitzer & Euskirchen Citation2004). Total ecosystem C in the 42-year-old stand was twice the amount of the 18-year-old stand indicating a large C sequestration potential during this phase of stand maturing. Consistent with other coniferous chronosequence studies (Sun et al. Citation2004; Bradford et al. Citation2008), we found forest floor C accumulated substantially as stand develops in five stands. Although, C storage in forest floor was small (i.e. 7.68 Mg C ha−1 in the 42-year-old stand) compared to C storage in vegetation biomass within this chronosequence, it may be a significant component on larger scales, affect C transfer from tree to forest soil C pools. Therefore, the forest floor should not be discounted with regard to C sequestration. Apart from live biomass, mineral soil provided large C pools (Johnson et al. Citation2003; Oliver et al. Citation2004). Changes in soil C storage have been reported from a number of studies based on stand chronosequences. In contrast to Vesterdal et al. (Citation2006), who found that soils can contribute about 30% of the total C sequestration in afforested ecosystems, we found that soil C content comprised the main proportion of the total C sequestration in this pine chronosequence. In addition, C storage in mineral soil increased steadily in the five stands. If the C accumulation trends observed in our age sequence continue, the mineral soil C may further increase with stand age. This underlines the importance of including precise estimates of mineral soil C storage in ecosystem C accounting.
Conclusions
Tree biomass became the dominating ecosystem C pool due to few understory plants in this pine age sequence. Total biomass of ecosystem increased considerably between the age of 38 and 42 as consequence of specific forest thinning strategies in these planted forests. Thus, the phase of stand maturing between the age of 38 and 42 may be considered most important for C sequestration due to an increase in the ecosystem biomass. The highest C concentration was found in tree branch, while the lowest C concentration was observed in the forest floor. Vegetation C increased quickly at older ages, but leveled off at young ages. Accumulation of C in forest floor increased with stand age. Similarly, total mineral soil C content all exhibited increasing trends along stand age, and approximately 40% of total mineral soil C content was sequestrated within the upper 30 cm of each stand. Our results highlight the importance of considering the successional development of forest ecosystem C pools, when estimating C sink potentials over their complete life cycle.
Acknowledgments
This project is supported by National Forestry Public Welfare Profession Scientific Research Project (no. 201104008), National Bureau of Forestry 948 project (no. 2010-4-15), the Fundamental Research Funds for the Central Universities (no. TD2011-07), and CFERN&GENE Award Funds on Ecological Paper. The authors thank all those who provided helpful suggestions and critical comments on this manuscript and anonymous reviewers. We also thank the Lingkong Mountain National Nature Reserve for their support in fieldworks. The English language was revised by Dr. Osbert Jianxin Sun and Dr. Gerrit Hazenberg.
Related Research Data
References
- Bert D, Danjon F. 2006. Carbon concentration variations in the roots, stem and crown of mature Pinus pinaster (Ait.). Forest Ecol Manag. 222:279–295. 10.1016/j.foreco.2005.10.030
- Böttcher J, Springob G. 2001. A carbon balance model for organic layers of acid forest soils. J Plant Nutr Soil Sc. 164:399–405. 10.1002/1522-2624(200108)164:4%3C399::AID-JPLN399%3E3.0.CO;2-6
- Bradford JB, Birdsey RA, Joyce LA, Ryan MG. 2008. Tree age, disturbance history and carbon stocks and fluxes in subalpine rocky mountain forests. Global Change Biol. 14:2882–2897. 10.1111/j.1365-2486.2008.01686.x
- Bradford JB, Kastendick DN. 2010. Age-related patterns of forest complexity and carbon storage in pine and aspen-birch ecosystems of northern Minnesota, USA. Can J Forest Res. 40:401–409. 10.1139/X10-002
- Brown S. 2002. Measuring carbon in forest: current status and future challenges. Environ Pollut. 116:363–372. 10.1016/S0269-7491(01)00212-3
- Brown SL, Schroeder P, Kern JF. 1999. Spatial distribution of biomass in forests of the eastern USA. Forest Ecol Manag. 123:81–90. 10.1016/S0378-1127(99)00017-1
- Cairns MA, Browns S, Helmer EH, Baumgardner GA. 1997. Root biomass allocation in the world's upland forests. Oecologia. 111:1–11. 10.1007/s004420050201
- Dixon RK, Brown S, Houghton RA, Solomon AM, Trexler MC, Wisniewski J. 1994. Carbon pools and flux of global forest ecosystems. Science. 263:185–190. 10.1126/science.263.5144.185
- Fang JY, Chen AP, Peng CH, Zhao SQ, Ci LJ. 2001. Changes in forest biomass carbon storage in China between 1949 and 1998. Science. 292:2320–2322. 10.1126/science.1058629
- Fang JY, Liu GH, Zhu B, Wang XK, Liu SH. 2007. Carbon budgets of three temperate forest ecosystems in Dongling Mt., Beijing, China. Sci China Ser D. 50:92–101. 10.1007/s11430-007-2031-3
- Huang CD, Zhang J, Yang WQ, Zhang GQ. 2008. Characteristics of carbon stock in artificial forest ecosystem in Sichuan Province of China. Chinese J Appl Ecol. 19:1644–1650. Chinese.
- Jobbagy EG, Jackson RB. 2000. The vertical distribution in soil organic C and its relation to climate and vegetation. Ecol Appl. 10:423–436. 10.1890/1051-0761(2000)010[0423:TVDOSO]2.0.CO;2
- Johnson DW, Todd DE, Tolbert VR. 2003. Changes in ecosystem carbon and nitrogen in a loblolly pine plantation over the first 18 years. Soil Sci Soc Am J. 67:1594–1601. 10.2136/sssaj2003.1594
- Kurz WA, Beukema SJ, Apps MJ. 1996. Estimation of root biomass and dynamics for the carbon budget model of the Canadian forest sector. Can J Forest Res. 26:1973–1979. 10.1139/x26-223
- Landsberg JJ, Linder S, McMurtrie RE. 1995. Effects of global change on managed forest ecosystems in a globally changing environment. Canberra: Global Change and Terrestrial Ecosystems, Core Project of the IGBP. 1–17.
- Li XD, Myong JY, Yowhan S, Pil SP, Kyeong HL, Yeong MS, Rae HK, Mi JJ. 2011. Biomass and carbon storage in an age-sequence of Korean Pine (Pinus koraiensis) plantation forests in Central Korea. J Plant Biol. 54:33–42. 10.1007/s12374-010-9140-9
- Litton CM, Ryan MG, Tinker DB, Knight DH. 2003. Belowground and aboveground biomass in young postfire lodgepole pine forests of contrasting tree density. Can J Forest Res. 33:351–363. 10.1139/x02-181
- Losi CJ, Siccama TG, Condit R, Morales JE. 2003. Analysis of alternative methods for estimating carbon stock in young tropical plantations. Forest Ecol Manag. 184:355–368. 10.1016/S0378-1127(03)00160-9
- Ma QY. 1983. Determination of the biomass of individual trees in stands of Pinus Tabulaeformis plantation in North China. J Beijing Forest Coll. 4:1–16. Chinese.
- Ma QY, Cheng XL, Wang J. 2002. Carbon content rate in constructive species of main forest types in northern China. J Beijing Forest Univ. 24:96–100. Chinese.
- Meehl GA, Stocker TF, Collins WD, Friedlingstein P, Gaye AT, Gregory JM, Kitoh A, Knutti R, Murphy JM, Noda A, et al. 2007. Global climate projections. In: Solomon S, et al., editors. Climate change 2007: The physical science basis. Contribution of working group I to the fourth assessment report of the intergovernmental panel on climate change. Cambridge: Cambridge University Press, United Kingdom and New York, NY, USA; p. 747–845.
- Montagnini F, Porras C. 1998. Evaluating the role of plantations as carbon sinks: an example of an integrative approach from the humid tropics. Environ Manage. 22:459–470. 10.1007/s002679900119
- Nabuurs GJ, Masera O, Andrasko K, Benitez-Ponce P, Boer R, Dutschke M, Elsiddig E, Ford-Robertson RJ, Frumhoff P, Karjalainen T, et al. 2007. Forestry. In: Metz B, Davidson OR, Bosch PR, Dave R and Meyer LA, editors. Climate change 2007: mitigation. Contribution of working group III to the fourth assessment report of the intergovernmental panel on climate change. Cambridge, UK and New York: Cambridge University Press; p. 541–584.
- Oehme V, Högya P, Zebitzb CPW, Fangmeiera A. 2013. Effects of elevated atmospheric CO2 concentrations on phloem sap composition of spring crops and aphid performance. J Plant Interact. 8:74–84. 10.1080/17429145.2012.736200
- Oliver GR, Pearce SH, Kimberly MO, Ford-Robertson JB, Robertson KA, Beets PN, Garrett LG. 2004. Variation in soil carbon in pine plantations and implications for monitoring soil carbon stocks in relation to land-use change and forest site management in New Zealand. Forest Ecol Manag. 203:283–295. 10.1016/j.foreco.2004.07.045
- Pan YD, Luo TX, Birdsey R, Hom J, Melillo J. 2004. New estimates of carbon storage and sequestration in China's forests: effects of age-class and method on inventory-based carbon estimation. Climatic Change. 67:211–236. 10.1007/s10584-004-2799-5
- Paul KI, Polglase PJ, Nyakuengama JG, Khanna PK. 2002. Change in soil carbon following afforestation. Forest Ecol Manag. 168:241–257. 10.1016/S0378-1127(01)00740-X
- Peichl M, Arain MA. 2006. Above- and belowground ecosystem biomass and carbon pools in an age-sequence of temperate pine plantation forests. Agr Forest Meteorol. 140:51–63. 10.1016/j.agrformet.2006.08.004
- Peichl M, Arain MA. 2007. Allometry and partitioning of above- and belowground tree biomass in an age-sequence of white pine forests. Forest Ecol Manag. 253:68–80. 10.1016/j.foreco.2007.07.003
- Piao SL, Fang JY, Zhu B, Tan K. 2005. Forest biomass carbon stocks in China over the past 2 decades, estimation based on integrated inventory and satellite data. J Geophys Res. 110:G01006. 10.1029/2005JG000014
- Pregitzer KS, Euskirchen ES. 2004. Carbon cycling and storage in world forests: biome patterns related to forest age. Global Change Biol. 10:2052–2077. 10.1111/j.1365-2486.2004.00866.x
- Rotter J, Danish K. 2002. Forest, carbon and the Kyoto protocol's clean development mechanism. J Forest. 98:38–47.
- Streets DG, Jiang KJ, Hu XL, Sinton JE, Zhang XQ, Xu DY, Jacobson MZ, Hansen JE. 2001. Recent reductions in China's greenhouse gas emission. Science. 294:1835–1837. 10.1126/science.1065226
- Sun OJ, Campbell J, Law BE, Wolf V. 2004. Dynamics of carbon stocks in soils and detritus across chronosequences of different forest types in the Pacific Northwest, USA. Global Change Biol. 10:1470–1481. 10.1111/j.1365-2486.2004.00829.x
- Vesterdal L, Rosenqvist L, vander Salm C, Hansen K, Groenenberg BJ, Johansson MB. 2006. Carbon sequestration in soil and biomass following afforestation: experiences from oak and Norway spruce chronosequences in Denmark, Sweden, and the Netherlands. In: Heil G, Muys B, Hansen K, editors. Environmental effects of afforestation. Field observations, modelling and spatial decision support. Berlin: Springer; p. 999.
- Winjum JK, Paul ES. 1997. Forest plantations of the world: their extent, ecological attributes, and carbon storage. Agr Forest Meteorol. 84:153–167. 10.1016/S0168-1923(96)02383-0
- Xiao Y. 1990. Comparative studies on biomass and productivity of Pinus tabulaeformis plantations in different climatic zones in Shannxi province. Acta Phytoecol Et Geobot Sin. 14:237–246.
- Xu HC. 1990. Pinus tabulaeformis. Beijing: China Forestry Publishing House. Chinese.
- Xu XL, Li KR. 2010. Biomass carbon sequestration by planted forests in China. Chinese Geogr Sci. 20:289–297. 10.1007/s11769-010-0401-9
- Zhang PC, Shao GF, Zhao G, Master DCL, Parker GR, Dunning JB, Li QL. 2000. China's forest policy for the 21st century. Science. 288:2135–2136. 10.1126/science.288.5474.2135
- Zhao M, Zhou G. 2005. Estimation of biomass and net primary productivity of major planted forests in China based on forest inventory data. Forest Ecol Manag. 207:295–313. 10.1016/j.foreco.2004.10.049
- Zheng H, Ouyang Z, Xu W, Wang X, Miao H, Li X, Tian Y. 2008. Variation of carbon storage by different reforestation types in the hilly red soil region of southern China. Forest Ecol Manag. 255:1113–1121. 10.1016/j.foreco.2007.10.015
- Zhu B, Wang XP, Fang JY, Piao SL, Shen HH, Zhao SQ, Peng CH. 2010. Altitudinal changes in carbon storage of temperate forests on Mt. Changbai, Northeast China. J Plant Res. 123:439–452. 10.1007/s10265-009-0301-1