
Abstract
Artemisinin, a natural product isolated from aerial parts of Artemisia annua L. plant, is a potent antimalarial drug against drug-resistant malaria. In recent times, the demand (101–119 MT) for artemisinin is exponentially increasing with the increased incidence of drug-resistant malaria throughout the world, especially African and Asian continents. However, the commercial production of artemisinin-based combination therapies has limitation because of the presence of low concentration of artemisinin in plants. Therefore, transgenic lines of A. annua L. plants over-expressing both HMG-Co A reductase (hmgr) and amorpha-4, 11-diene synthase (ads) genes were developed to enhance the content of artemisinin. The selected transgenic lines (TR4, TR5, and TR7) were found to accumulate higher artemisinin (0.97–1.2%) as compared to the non-transgenic plants (0.63%). The secondary metabolite profiles of these lines were also investigated employing gas chromatography mass spectrometry, which revealed a clear difference in these metabolites in transgenic and non-transgenic lines of A. annua L. at different growth and developmental stages. The major metabolites reported in these lines at pre-flowering stage were related to essential oil and chlorophyll biosynthesis (71.33% in TR5 transgenic lines vs. 61.70% in non-transgenic line). Based on these results, we concluded that over-expression of both hmgr and ads genes in A. annua L. plants results not only increase in artemisinin content, but also enhances synthesis of other isoprenoid including essential oil. It is also evident from this study that the novel artemisinin-rich varieties of A. annua L. could be developed by suppressing essential oil biosynthesis, so that more carbon could preferentially be diverted from mevalonate pathway to artemisinin biosynthesis.
| Abbreviations | ||
| ACT | = | artemisinin based combination therapy |
| ADS | = | amorpha-4,11-diene synthase enzyme |
| HMGR | = | hydroxy methyl glutaryl coenzyme A reductase |
| HPLC | = | high performance liquid chromatography |
| HPTLC | = | high performance thin layer chromatography |
| MVA | = | mevalonate |
| RT-PCR | = | reverse transcriptase polymerase chain reaction |
| GC–MS | = | gas chromatography mass spectrometry |
Introduction
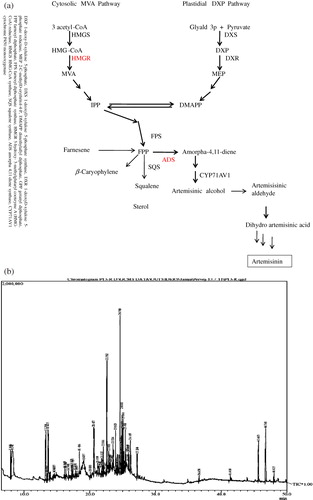
Artemisinin, an endoperoxide sesquiterpene lactone, is a novel antimalarial natural product (drug) isolated from the aerial parts of Artemisia annua L. plants (Abdin et al. Citation2003). However, the presence of low concentration (0.01–1.1%) of artemisinin and A. annua plant being the only natural source of it is the major constrains in commercialization of artemisinin-based combination therapies (ACTs) recommended by WHO for treating drug-resistant malaria (Weathers et al. Citation2010). Considerable efforts have been made worldwide to improve artemisinin biosynthesis in order to enhance its production and accumulation in the plants. So far, several approaches such as biochemical as well molecular have been used to increase the artemisinin content, but the transgenic technology employed to enhance the rate-limiting steps of artemisinin biosynthesis () was considered as one of the most appropriate strategy (Banerjee et al. Citation1997; Chen et al. Citation1999, Citation2000; Geng et al. Citation2001; Wang et al. Citation2004, Citation2007; Brown & Sy Citation2004, Citation2007; Bertea et al. Citation2005; Zhang et al. Citation2008; Teoh et al. Citation2009; Alam & Abdin Citation2011).
Besides artemisinin, A. annua plant biosynthesize and accumulate a great variety of volatile secondary metabolites from the components of essential oils and other isoprenoids. The metabolic fingerprinting of these secondary metabolites has allowed the identification of several sesquiterpenoids, flavonoids, coumarins, triterpenoids, steroids, phenolic compounds, purines, lipids, and aliphatic compounds (Sipahimalani et al. Citation1991; Christen & Veuthey Citation2001; Van Nieuwerburgh et al. Citation2006; Akhila Citation2007). Of the various analytical procedures developed to characterize the variation in the composition and level of these metabolites (Schauer & Fernie Citation2006), GC and GC/MS have been most widely applied for metabolic profiling of various plant species (Sipahimalani et al. Citation1991; Christen & Veuthey Citation2001; Van Nieuwerburgh et al. Citation2006).
To understand the impact of over-expression of genes encoding the rate-limiting enzymes of mevalonate and artemisinin biosynthetic pathways, it is imperative to evaluate the changes in the secondary metabolite profile of transgenic A. annua plant in comparison to normal plant. To the best of our knowledge, so far only one study is available on this aspect, but the transgenic plants used are over-expressing only farnesyl diphosphate synthase, an enzyme of mevalonate pathway (Ma et al. Citation2008). In the present study, therefore, an attempt has been made to determine the metabolic profiles and artemisinin content in transgenic A. annua plants overexpressing both hmgr and ads genes in comparison to non-transgenic (normal) plants employing GC–MS and High performance liquid chromatography (HPLC).
Materials and method
Plant materials
Among the transgenic lines developed in our laboratory, the high artemisinin-yielding lines [TR4 (1.73 mg/g DW), TR5 (1.72 mg/g), and TR7 (1.59 mg/g)] and non-transgenic (W, 0.2 mg/g DW) A. annua L. were used in the present study. These plants were transferred into pots containing vermiculite, perlite, and soilrite (1:1:1) and kept in transgenic containment facility at 25 ± 2°C under 5000 lux light intensity (using fluorescent lamps and 16/8 h light/dark period for further growth).
Extraction of metabolites and derivatization
The leaves from pot grown plants were harvested at rosette, bolting, and pre-flowering stages. These were quickly frozen in liquid N2 and stored at −80°C for later use. The extraction of metabolites from the stored leaf samples was done using the method of Ma et al. (Citation2008). The frozen leaves were milled in liquid nitrogen and lyophilized. One gram of lyophilized leaf powder was taken into 15-mL glass tube, and then 5 mL of methanol–chloroform mixture (1:1 volume ratio) and 200 µL capric acid (0.4 mg/mL) were added to it. The mixture was sonicated for 1 h and allowed to cool at room temperature. The extraction solution thus obtained was centrifuged at 18,000 rpm for 10 min to obtain a clear supernatant solution. One milliliter of the solution was freeze–dried for 30 min. Silylation was accomplished by adding 100 µL of N,O-Bis(trimethylsilyl)trifluoroacetamide and 100 µL of dimethylformamide to this solution (but it is freeze–dried) and heating in water bath at 80°C for 30 min.
GC–MS
The GC-separation and detection of metabolites present in the samples were achieved by ramping the temperature from 100°C to 300°C at a rate 10°C/min on a Rtx-5 SIL MS capillary column (Restek, USA) (5% phenyl-95% polymethylsiloxane, 60 m × 0.25 mm i.d.; 0.25 μm film thickness). The GCQP 2010 PLUS mass spectrometer electron ionization mode (Quadrupole mass spectrometer Shimadzu, Japan) was operated under the following conditions: m/z 40–950 mass range; 0.5 sec scan cycle time; 280°C transfer line temperature; 250°C manifold temperature; and 150°C ion trap temperature.
Identification of metabolites
The metabolites were identified by comparison of their retention indices and mass spectra with those of standard libraries (Wiley6 Citation1989 and NIST02 Citation2008). The GC–MS data were handled by using the method of Ma et al. (Citation2008). The calculation of metabolites level was determined by peak area ratio of samples and area of internal standard with reference to fixed sample weight vs. actual weight of each sample.
Artemisinin estimation
One gram dried leaf powder from each sample was used for the estimation of artemisinin content using the method of Zhao and Zeng (Citation1986). The leaves samples were extracted with 10 mL petroleum either in shaking water bath at 40°C for 12 hrs. Petroleum either fractioned layer pooled and concentrated under reduced pressure. The concentrated fraction was defatted with CH3CN (1 mL × 3). Precipitated fat was filtered out and filtrate was concentrated under reduced pressure again. The gummy residue was dissolved in 1 mL of methanol. One hundred microlitre aliquot of each sample was taken and to this 4 mL of 0.3% NaOH was added. This solution was incubated in shaking water bath at 50°C for 30 min, thereafter cooled and neutralized with glacial acetic acid (0.1 M in 20 MeOH). The pH of the solution was maintained at 6.8. The derivatized artemisinin was analyzed and quantified using HPLC (Waters, USA) with reverse phase column (C18, 5 µm, 4.6 × 250 mm) with premixed methanol and 100 mM K-Phosphate buffer (pH 6.5) in the ratio of 60:40 as mobile phase at constant flow rate of 1 mL min−1 with the detector (Waters, 2487 Dual Absorbance detector) set at 260 nm. The artemisinin was quantified with the help of standard curve prepared by using different concentrations (10–50 µg) of pure artemisinin procured from Sigma Aldrich, USA. Artemisinin content was expressed in % gm−1 DW of leaves.
HMG-CoA reductase (HMGR) and amorpha-4, 11- diene synthase (ADS) assay
These enzymes HMGR and ADS were assayed as described by Alam and Abdin (Citation2011) and their activities were expressed as nmol MVA formed h−1 mg−1 protein and µmol AD formed h−1 mg−1 protein, respectively.
Estimation of total mevalonate pool
MVA was extracted from leaf samples of transgenic and non-transgenic A. annua plants by the modified method of Wills and Scurr Citation1975 (MaujiRam et al. Citation2010). Fresh leaf tissues were chopped (1−2 mm) and homogenized for 4 min with 3 mL g−1 chilled buffer solution (0.2 M KCl-HCl; pH 1.5). The homogenate was filtered through two layers of muslin cloth. The pH of filtrate was again adjusted to 1.5 using conc. H2SO4, and thereafter, it was incubated at 35°C for 18 hrs to allow full conversion of MVA to mevalonic acid lactone (MVAL). The filtrate was extracted with ethyl acetate (3 × 200 mL). Ethyl acetate fraction was filtered through filter paper Whatman No. 42 and solvent was evaporated by rotary evaporation at 35°C and 20–25 mm Hg to small volume. The residual ethyl acetate fraction was stored at 4°C for analysis or directly used for estimation of MVAL with the help of high performance thin layer high performance system. Sample solution was applied on a thin layer chromatography (TLC) plate under a flow of nitrogen gas using a semiautomatic spotter. The TLC plate was developed and analyzed as described under the chromatographic conditions. The amount of MVAL present in the sample solution was determined by fitting the area value of peak corresponding to MVAL into the equation of the line representing the calibration curve of MVAL. All determination was performed in triplicate. Mevalonate content was expressed as µg g−1 dw.
RNA extraction and reverse transcriptase polymerase chain reaction (RT-PCR) analysis
Total RNA was isolated from leaf samples of transgenic and non-transgenic A. annua plants using RNeasy Plant Mini Kit according to the manufacturer's instructions (Qiagen, USA). Thereafter, it was subjected to RT-PCR by using one step RT-PCR kit (Qiagen) with specific primers; 5′GGGGATCCATGGACTCTCGCCGGCGATC3′ (Forward) and 5′GGGTCGACTCATCACTCTCTAACTGAGAG3′ (Reverse) for hmgr; and 5′ATGTCACTTACAGA AGAAAAACCTATTC3′ (Forward) and 5′TCATATACTCATAGGATAAACG3′ (Reverse) for ads. The PCR conditions employed were: 94°C for 1 min, 55°C for 1 min, and 72°C for 1 min (35 cycles) for hmgr; and 94°C for 1 min, 55°C for 1 min, and 72°C for 3 min (40 cycles) for ads. The amplified PCR products were separated on 1.2% agarose gel, stained with EtBr and visualized in Gel documentation system (UViTech, USA).
Results
The secondary metabolites of the transgenic (TR4, TR5, and TR7 lines) and non-transgenic (W) plants of A. annua were determined at rosette, bolting, and flowering stages employing GC–MS. The concentrations of these metabolites were reported by giving the percentage of the peak areas relative to the total peak area of the compounds together. At each stage, leaf samples in triplicate were collected from the plants grown in transgenic containment facility and subjected to GC–MS analysis. In total, 34 metabolites from isoprenoid pathway were identified, which represented 99.0% of the total emission, i.e. sum of GC/MS peak areas excluding solvent peaks (). The major metabolites and related compounds detected at preflowering stage were caryophylene, camphor, phytol, and farnesene (75.83% in transgenic and 61.70% in nontransgenic plants), followed by metabolites from artemisinin biosynthetic pathway (7.88% in transgenic and 5.93% in non-transgenic plants) () and the precursor, squalene (SQ) of sterol biosynthesis (1.27% in transgenic and 2.09% in non-transgenic plants). Similar trend was also observed in the metabolite composition of transgenic and non-transgenic plants at other developmental stages, but their concentrations increased from rosette to bolting stage (, , and ). The transgenic line, TR5 was reported to have highest concentration of these metabolites (74.2%), followed by TR4 (71.71%), TR7 (68.11%), and non-transgenic plant (W) (; ). Thus, transgenic lines of A. annua had lower amount of squalene but higher contents of metabolites related to essential oil and chlorophyll biosynthesis as compared to non-transgenic plants (, and ; ). It is interesting to note here that squalene is the precursor of sterol biosynthesis, which is a competing pathway for farnesyl pyrophosphate (FPP) with artemisinin biosynthesis.
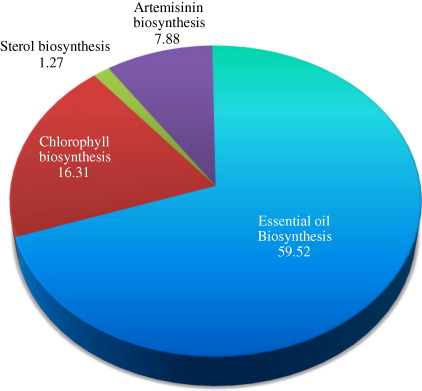
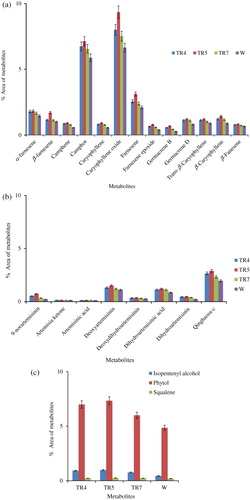
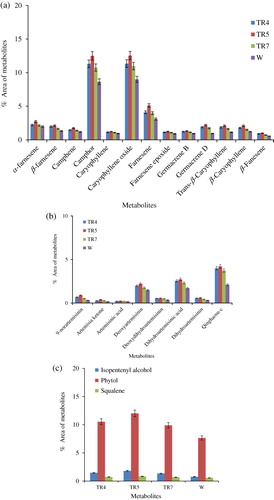
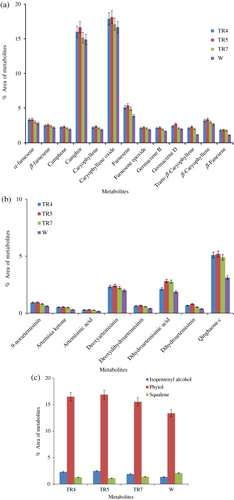
Table 1. The GC–MS profile of isoprenoids in transgenic and non-transgenic Artemisia annua L. plants. Values are means of three replicates at pre-flowering stage.
It has to be emphasized here that artemisinin, being a ‘non-volatile’ sesquiterpenoid with peculiar chemical functionalities, could not be detected in the chromatograms obtained from GC/MS analyses in our study. A similar observation has also been made by Reale et al. (Citation2011). Therefore, the artemisinin contents in leaf samples were determined by HPLC. The artemisinin content gradually increased during different developmental stages and was maximum at pre-flowering stage in both transgenic and non-transgenic plants. The highest artemisinin content was observed in transgenic line TR5 (1.2%), followed by TR4 (1.05%) and TR7 (0.97%); while only 0.63% of artemisinin was recorded in non-transgenic plant (W) of A. annua.
To confirm the expression of HMG-CoA reductase (hmgr) and amorpha 4, 11-diene synthase (ads) genes, RT-PCR analyses were performed using total RNA samples isolated from the leaves at pre-flowering stage of transgenic and non-transgenic lines of A. annua. The RT-PCR analyses showed that the both hmgr and ads genes were expressed differentially in transgenic lines, while no amplification signal was observed in non-transgenic line (W) with hmgr specific primers ( and ). Moreover, TR4, TR5, and TR7 transgenic lines had also shown higher HMGR (34.14%, 55.21%, and 32.87%, respectively) and ADS activities (36.24%, 38.81%, and 33.44%, respectively) as well as higher mevalonate content (47.69%, 58.97%, and 44.48%, respectively) in comparison to the non-transgenic line ( and ).
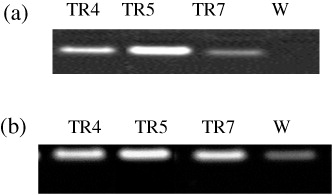
Table 2. HMGR activity and mevalonate content in the leaves of transgenic (TR) and non-transgenic (W) plants of A. annua L. grown in polyhouse at pre-flowering stage.
Table 3. Amorpha-4,11-diene synthase (ADS) activity and Artemisinin content (%) in the leaves of non-transgenic (W) and transgenic of A. annua L. plants grown in polyhouse at pre-flowering stage.
Discussion
The production of isoprenoids is tightly regulated by the activities of rate-limiting enzymes, which play a regulatory role in the biogenesis of these metabolites. Based on the earlier studies, mevalonate pathway operating in cytosol was reported to be the major contributor of carbon to the biosynthesis of isoprenoids (Kudakasseril et al. Citation1987; Akhila et al. Citation1990). While isoprenoids synthesized in plastids were shown to draw carbon mainly from Rohmer pathway operating in plastids. Further, a crosstalk between the mevalonate and the Rohmer pathway was suggested to provide carbon for the biosynthesis of artemisinin (Towler & Weathers Citation2007; Schramek et al. Citation2010). However, recent studies conducted in our laboratory have shown that ∼80% of the carbon was contributed by mevalonate pathway to the biosynthesis of artemisinin and modulation of HMGR activity, a key rate-limiting enzyme of this pathway. The enhanced production of HMGR led to increase the cellular MVA pool and artemisinin accumulation in A. annua plants because of the expression of hmgr gene in these plants (Aquil et al. Citation2009; MaujiRam et al. Citation2010; Nafis et al. Citation2011). There are now increasing evidences confirming that the carbon from mevalonate pathway is utilized in the biosynthesis of many other isoprenoids such as phytoalexins, lycopene, phytosterols, etc. (Arsenault et al. Citation2010). It is, therefore, expected that there may be a strong competition among these pathways for the carbon from mevalonate pathway that may also limit artemisinin biosynthesis.
Keeping in view the above facts, we have overexpressed hmgr in A. annua to increase the cellular mevalonate pool. We have also over-expressed the ads encoding amorpha-4,11-diene synthase (ADS) enzyme, which catalyzes the first committed step in artemisinin biosynthesis and links it to the mevalonate pathway so that more carbon is diverted to the former. The three transgenic lines, namely TR4, TR5, and TR7, with high HMGR and ADS activities as well as high artemisinin contents were isolated and characterized (Alam & Abdin Citation2011). These transgenic lines, grown in transgenic containment facility, were used in this study and subjected to HPLC, GC–MS, and molecular analyses to evaluate the metabolite profile of isoprenoid pathway including artemisinin, mevalonate, and the levels of expression of hmgr as well as ads and the activity of the respective enzymes (HMGR and ADS).
The GC–MS and HPLC data, generated in present study, revealed that the transgenic lines in comparison to non-transgenic A. annua plants had higher levels of isoprenoids including artemisinin at all the developmental stages due to the higher expressions of trans hmgr and ads, increased activities of their respective enzymes (HMGR and ADS), and enhanced levels of mevalonate. Thus, confirming earlier findings of Alam and Abdin (Citation2011), Schramek et al. (Citation2010), Brown (Citation2010), and Olsson et al. (Citation2009). However, Ma et al. (Citation2008) have observed no change in the composition of these metabolites (, and ). In the present study, transgenic lines have also shown higher levels of metabolites of essential oil (59.52%), followed by phytol (16.31%), which is the component of chlorophyll. This clearly implies that diversion of more carbon has been occurring from mevalonate pathway as well as non-mevalonate methylerythritol phosphate pathways to the biosyntheses of essential oils and chlorophyll as they compete for carbon with artemisinin biosynthesis.
One of the interesting findings of our study is the presence of low level of squalene, the precursor of sterol biosynthesis, in the transgenic lines as compared to the non-transgenic A. annua plants (). Since artemisinin and sterol biosynthetic pathways compete for FPP, a product of mevalonate pathway and ADS is the enzyme that catalyzes the first committed step of artemisinin biosynthesis from FPP (Wallaart et al. Citation2001; Picaud et al. Citation2006); in the present study, more FPP could have been diverted toward artemisinin biosynthesis resulting in the increased accumulation of artemisinin in transgenic lines by over-expressing ads.
In the present study, the dihydroartemisinic acid concentration has also been observed in transgenic and non-transgenic plants, which are known as potential precursor (Ma et al. Citation2008) and possible may be bottleneck for enhanced synthesis of artemisinin. Our study, however, suggests that the suppression of essential oil biosynthesis should be the prime target in developing genetically engineered A. annua plants as it could lead to rich accumulation of artemisinin. This inference is based on the observation that transgenic lines (TR4, TR5, and TR7) having higher concentration of artemisinin content also had much higher concentration of metabolites of essential oil biosynthesis (59.52%) as compared to he concentration of dihydroartemisinic acid and other metabolites of isoprenoid pathway (; , and ).
The developmental stage of A. annua plant at which maximum artemisinin concentration could be found is also an important aspect. Majority of investigators have reported the highest artemisinin content at the pre-flowering stage (Liersch et al. Citation1986; Jha et al. Citation2010; Alam & Abdin Citation2011), while Morales et al. (Citation1993) have found the artemisinin peak at the full flowering stage. In the present study also, the highest concentration (1.23% in TR5 followed by TR4 and TR7) of artemisinin in the plant was observed at the pre-flowering stage (). However, these differences could probably be due to the genotypic differences in A. annua plants as well as the differences in environmental conditions prevailing in the regions of their cultivations.
The transgenic lines in our study have also shown higher enzyme activities (HMGR and ADS) compared to the non-transgenic plant, which could be due to the over-expression of transgenes (hmgr and ads). However, these transgenes had differential expression in transgenic lines, which could be due to their positional effect (Meyer Citation1995; Spiker & Thompson Citation1996).
Based on the results of present study, it can be conclude that comparative metabolic fingerprinting between transgenic and non-transgenic A. annua plants has led to a better understanding of the rate-limiting steps in artemisinin biosynthesis, and artemisinin rich variety of this plant could be developed by suppressing essential oil biosynthesis.
Acknowledgements
We are thankful to Dr. M. A. A. Khan Scientist NISCAIR, New Delhi, India for editing the manuscript. The financial support from DST, Government of India and M/s Ipca Pvt. Ltd., Mumbai, India is gratefully acknowledged. P.A. is thankful to Jamia Hamdard, New Delhi, India for providing Junior Research fellowship. We are also thankful to Dr. Ajay Kumar from AIRF, Jawaharlal Nehru University, New Delhi for providing GC–MS facility.
Related Research Data
References
- Abdin MZ, Israr M, Rehman RU, Jain SK. 2003. Artemisinin, a novel antimalarial drug: biochmical and molecular approaches for enhanced production. Planta Med. 69:289–299. 10.1055/s-2003-38871
- Akhila A. 2007. Metabolic engineering of biosynthetic pathways leading to isoprenoids: mono- and sesquiterpenes in plastids and cytosol. J Plant Interact. 2:195–204. 10.1080/17429140701670953
- Akhila A, Kumkum R, Thakur RS. 1990. Biosynthesis of artemisinic acid in Artemisia annua. Phytochemistry. 29:2129–2132. 10.1016/0031-9422(90)83020-2
- Alam P, Abdin MZ. 2011. Over-expression of HMG-CoA reductase and amorpha-4, 11-diene synthase genes in Artemisia annua L. and its influence on artemisinin content. Plant Cell Rep. 30:1919–1928. 10.1007/s00299-011-1099-6
- Aquil S, Husaini AM, Abdin MZ, Rather GM. 2009. Overexpression of the HMG-CoA reductase gene leads to enhanced artemisinin biosynthesis in transgenic Artemisia annua plants. Planta Med. 75:1–6. 10.1055/s-0029-1185775
- Arsenault PR, Vail DR, Wobbe KK, Weathers PJ. 2010. Effect of sugars on artemisinin production in Artemisia annua L.: transcription and metabolite measurements. Molecules. 15:2302–2318. 10.3390/molecules15042302
- Banerjee S, Zehra M, Gupta MM, Kumar S. 1997. Agrobacterium rhizogenes-mediated transformation of Artemisia annua: production of transgenic plants. Planta Med. 63:467–469. 10.1055/s-2006-957737
- Bertea CM, Freije JR, van der Woude H, Verstappen FW, Perk L, Marquez V, De Kraker JW, Posthumus MA, Jansen BJ, de Groot A, Franssen MC, Bouwmeester HJ. 2005. Identification of intermediates and enzymes involved in the early steps of artemisinin biosynthesis in Artemisia annua. Planta Med. 71:40–47. 10.1055/s-2005-837749
- Brown GD. 2010. The biosynthesis of artemisinin (Qinghaosu) and the phytochemistry of Artemisia annua L. (Qinghao). Molecules. 15:7603. 10.3390/molecules15117603
- Brown GD, Sy LK. 2004. In vivo transformations of dihydroartemisinic acid in Artemisia annua plants. Tetrahedron. 60:1139–1159. 10.1016/j.tet.2003.11.070
- Brown GD, Sy LK. 2007. In vivo transformations of artemisinic acid in Artemisia annua plants. Tetrahedron. 63:9548–9566. 10.1016/j.tet.2007.06.062
- Chen D, Ye H, Li G. 2000. Expression of a chimeric farnesyl diphosphate synthase gene in Artemisia annua L. transgenic plants via Agrobacterium tumefaciens-mediated transformation. Plant Sci. 155:179–185. 10.1016/S0168-9452(00)00217-X
- Chen DH, Liu CJ, Ye HC, Li GF, Liu BY, Meng YL, Chen XY. 1999. Ri-mediated transformation of Artemisia annua with a recombinant farnesyl diphosphate synthase gene for artemisinin production. Plant Cell Tissue Organ Cult. 7:157–162. 10.1023/A:1006326818509
- Christen P, Veuthey JL. 2001. New trends in extraction, identification and quantification of artemisinin and its derivatives. Curr Med Chem. 8:1827–1839. 10.2174/0929867013371563
- Geng S, Ma M, Ye HC, Liu BY, Li GF, Chong K. 2001. Effects of ipt gene expression on the physiological and chemical characteristics of Artemisia annua L. Plant Sci. 160:691–698. 10.1016/S0168-9452(00)00453-2
- Jha P, Ram M, Khan MA, Kiran U, Mahamooduzzafar, Abdin MZ. 2010. Impact of organic manure and chemical fertilizers on artemisinin content and yield in Artemisia annua L. Ind Crops Prod. 33:296–301. 10.1016/j.indcrop.2010.12.011
- Kudakasseril GJ, Lam L, Staba EJ. 1987. Effect of sterol inhibitors on the incorporation of 14C-isopentenyl pyrophosphate into artemisinin by a cell-free system from Artemisia annua tissue cultures and plants. Planta Med. 53:280–284. 10.1055/s-2006-962706
- Liersch R, Soicke H, Stehr C, Tullner HV. 1986. Formation of artemisinin in Artemisia annua during one vegetation period. Planta Med. 52:387–390. 10.1055/s-2007-969193
- Ma C, Wang H, Lu X, Xu G, Liu B. 2008. Metabolic fingerprinting investigation of Artemisia annua L. in different stages of development by gas chromatography and gas chromatography-mass spectrometry. J Chromatogr A. 1186:412–419. 10.1016/j.chroma.2007.09.023
- Meyer P. 1995. Understanding and controlling transgene expression. Trends Biotechnol. 13:332–337. 10.1016/S0167-7799(00)88977-5
- Morales MR, Charles DJ, Simon JE. 1993. Seasonal accumulation of artemisinin in Artemisia annua L. Acta Hort. 344:416–420.
- Nafis T, Akmal M, Ram M, Alam P, Ahlawat S, Mohammad A, Abdin MZ. 2011. Enhancement of artemisinin content by constitutive expression of HMG-CoA reductase gene in high-yielding strain of Artemisia annua L. Plant Biotechnol Rep. 5:53–60. 10.1007/s11816-010-0156-x
- NIST02. 2008. Mass spectral database. Gaithersburg (MD): National Institute of Standards and Technology.
- Olsson ME, Olofsson LM, Lindahl AL, Lundgren A, Brodelius M, Brodelius PE. 2009. Localization of enzymes of artemisinin biosynthesis to the apical cells of glandular secretory trichomes of Artemisa annua L. Phytochemistry. 70:1123. 10.1016/j.phytochem.2009.07.009
- Picaud S, Mercke P, He X, Sterner O, Brodelius M, Cane DE, Brodelius PE. 2006. Amorpha-4, 11-diene synthase: mechanism and stereochemistry of the enzymatic cyclization of farnesyl diphosphate. Arch Biochem Biophys. 448:150–155. 10.1016/j.abb.2005.07.015
- Ram M, Khan MA, Jha P, Khan S. 2010. HMG-CoA reductase limits artemisinin biosynthesis and accumulation in Artemisia annua L. Plants Acta Physiol Plant. 32:859–866. 10.1007/s11738-010-0470-5
- Reale S, Fasciani P, Pace L, De Angelis F, Marcozzi G. 2011. Volatile fingerprints of artemisinin-rich Artemisia annua cultivars by headspace solid-phase microextraction gas chromatography mass spectrometry. Rapid Commun Mass Spectrom. 25:2511–2516. 10.1002/rcm.5155
- Schauer N, Fernie AR. 2006. Plant metabolomics: towards biological function and mechanism. Trends Plant Sci. 11:508–516. 10.1016/j.tplants.2006.08.007
- Schramek N, Wang H, Römisch-Margl W, Keil B, Radykewicz T, Winzenhörlein B, Beerhues L, Bacher A, Rohdich F, Gershenzon J, Liu B, Eisenreich W. 2010. Artemisinin biosynthesis in growing plants of Artemisia annua. A 13CO2 study. Phytochemistry. 71:179–187. 10.1016/j.phytochem.2009.10.015
- Sipahimalani AT, Fulzele DP, Heble MR. 1991. Rapid method for the detection and determination of artemisinin by gas chromatography. J Chromatogr. 538:452–455.
- Spiker S, Thompson WF. 1996. Nuclear matric attachment regions and transgene expression in plants. Plant Physiol. 110:15–21.
- Teoh KT, Polichuk DR, Reed DW, Covello PS. 2009. Molecular cloning of an aldehyde dehydrogenase implicated in artemisinin biosynthesis in Artemisia annua. Botany. 87:635–642. 10.1139/B09-032
- Towler MJ, Weathers PJ. 2007. Evidence of artemisinin production from IPP stemming from both the mevalonate and the non mevalonate pathways. Plant Cell Rep. 26:2129–2136. 10.1007/s00299-007-0420-x
- Van Nieuwerburgh FCW, Vande Casteele SRF, Maes L, Goossens A, Inze D, Van Bocxlaer J, Deforce DLD. 2006. Quantitation of artemisinin and its biosynthetic precursors in Artemisia annua L. by high performance liquid chromatography-electrospray quadrupole time-of-flight tandem mass spectrometry. J Chromatogr. 1118:180–187. 10.1016/j.chroma.2006.03.121
- Wallaart TE, Bouwmeester HJ, Hille J, Poppinga L, Maijers NC. 2001. Amorpha-4, 11-diene synthase: cloning and functional expression of a key enzyme in the biosynthetic pathway of the novel anti-malarial drug artemisinin. Planta. 212:460–465. 10.1007/s004250000428
- Wang H, Ge L, Ye HC, Chong K, Liu BY, Li GF. 2004. Studies on the effects of fpf1 gene on Artemisia annua flowering time and on the linkage between flowering and artemisinin biosynthesis. Planta Med. 70:347–352. 10.1055/s-2004-818947
- Wang H, Liu Y, Chong K, Liu BY, Ye HC, Li ZQ, Yan F, Li GF. 2007. Earlier flowering induced by over-expression of CO gene does not accompany increase of artemisinin biosynthesis in Artemisia annua. Plant biol. 9:442–446. 10.1055/s-2006-924634
- Weathers PJ, Arsenault PR, Covello PS, McMickle A, Teoh KH, Reed DW. 2011. Artemisinin production in Artemisia annua: studies in planta and results of a novel delivery method for treating malaria and other neglected diseases. Phytochem Rev. 10:173–182.
- Wiley6. 1989. Registry of mass spectral data. In McLafferty FW, Stauffer DB, editors. Wiley/NBS Registry of Mass Spectral Data. New York (NY): John Wiley.
- Wills RBH, Scurr EV. 1975. Mevalonic acid concentrations in fruit and vegetable tissues. Phytochem Rep. 14:1643.
- Zhang Y, Teoh KH, Reed DW, Maes L, Goossens A, Olson DJ, Ross AR, Covello PS. 2008. The molecular cloning of artemisinic aldehyde Delta11(13) reductase and its role in glandular trichome dependent biosynthesis of artemisinin in Artemisia annua. J Biol Chem. 283:21501–21508. 10.1074/jbc.M803090200
- Zhao SS, Zeng MY. 1986. Determination of qinghaosu in Artemisia annua L. by high performance liquid chromatography. Chin J Pharm Anal. 6:3–5.