
Abstract
Chloride is an essential micronutrient in tobacco (Nicotiana tabaccum L.) cultivation. However, large amounts of it have many adverse effects on burning quality of tobacco leaves. The objective of this study was to evaluate the genetic variability among 70 oriental-type tobacco genotypes and determine the genomic regions associated with chloride accumulation rate using mixed linear model (MLM) procedure. A total number of 66 alleles were detected by 26 simple sequence repeat (SSR) loci with an average of 2.53 alleles per locus. A model-based Bayesian approach subdivided 70 tobacco genotypes into the three subgroups. Almost 5.85% of the 325 marker pairs showed a significant level of linkage disequilibrium (P ≤ 0.01). Using MLM procedure, 1 SSR locus (pt30027) from linkage group 13 was identified to be associated with the gene(s) controlling low chloride accumulation in oriental tobacco genotypes. Identified markers could be of great interest in marker-assisted selection in tobacco breeding programs.
Introduction
Tobacco (Nicotiana tabaccum L.) with 2n = 4x = 48 chromosomes is one of the most important non-food crops widely cultivated worldwide (Moon et al. Citation2009). Turkish or oriental tobacco is a sun-cured, highly aromatic, and small-leafed type which is grown in Iran, Turkey, Greece, Bulgaria, Lebanon and the Republic of Macedonia. It has the ability to grow in low-fertility soils (Davis & Nielson Citation1999). In order to get an American Blend type of cigarette, it is mixed with more robust tobacco such as Virginia and Burley tobaccos. Chloride is recognized as an essential micronutrient in tobacco cultivation. When required in small amounts, it improves yield and certain quality factors, such as color, moisture content, elasticity, and burning capacity (Davis & Nielson Citation1999). However, large amounts of chloride accumulation have many adverse effects on the quality of tobacco leaves, such as poor burning capacity, muddy appearance, and undesirable odor as well as high hygroscopicity, causing discoloration during storage. Thus, the chloride content in tobacco leaves is considered as a major factor determining the quality of tobacco leaves. If the chloride content rises above 2.0%, it results in nearly incombustible tobacco leaves (Darvishzadeh & Alavi Citation2011). High genetic variability has been reported for chloride accumulation in Iranian oriental tobacco germplasm (Darvishzadeh et al. Citation2011). Darvishzadeh and Alavi (Citation2011) by using parental genotypes and their F1 hybrids showed that both additive and nonadditive genetic effects control chloride accumulation rate in tobacco leaf.
Molecular breeding has revolutionized conventional breeding techniques in all areas within the last 20 years. As a prerequisite, identifying tightly linked markers is important for the successful deployment of DNA marker technology in breeding programs. The first DNA marker applied to plants was restriction fragment length polymorphism. With the advent of polymerase chain reaction (PCR), several other DNA marker systems, such as random amplified polymorphic DNA, simple sequence repeat (SSR), inter-simple sequence repeat, and amplified fragment length polymorphism were introduced (Godwin et al. Citation1997). SSR markers, due to their high polymorphism, random distribution and codominant Mendelian inheritance, are one of the most reliable markers for genetic studies (Kalia et al. Citation2011). Mapping quantitative trait loci (QTL) in plants has been mainly obtained through systematic biparental breeding populations such as backcrosses, F2-intercrosses, or recombinant inbred lines (RILs) (Parrisseaux & Bernardo Citation2004; Russo et al. Citation2012). However, due to few recombination events occurring in these populations, the associated markers are not often tightly linked to the QTL of interest (Myles et al. Citation2009). Association mapping offers a good alternative approach for detecting tightly linked markers to the QTL of interest in natural populations, germplasm collections, and even routinely generated breeding programs (Parrisseaux & Bernardo Citation2004; Abdurakhmonov & Abdulkarimov Citation2008). This method has been used in several plants species, including maize (Thornsberry et al. Citation2001), barley (Kraakman et al. Citation2006), hexaploid wheat (Breseghello & Sorrells Citation2006), sunflower (Darvishzadeh et al. Citation2008; Davar et al. Citation2012), chickpea (Saeed et al. Citation2013), and long life span forest plants (Wilcox et al. Citation2007).
Compared to biparental linkage analysis, association mapping has some advantages including the following: (1) because of using all the meioses events accumulated in the breeding history of species, association mapping has high mapping resolution, (2) richness of allelic polymorphism because of the broader genetic variation represented by diverse genetic background of the genotypes, and (3) availability of populations and phenotypic data collected through multiple locations and years without any extra cost (Yu & Buckler Citation2006; Sorkheh et al. Citation2008; Zhang et al. Citation2012). Population structure, sample size, and frequency of specific alleles may influence the ability to detect false-positive associations between markers and traits (Zhang et al. Citation2012). Methods incorporating population structure (Q) and kinship (K) matrix or a combination of Q and K (Q + K) has been proposed to minimize the false-positive association in association analyses (Yu & Buckler Citation2006; Yu et al. Citation2006). The aims of the present study were to characterize the population structure within oriental tobacco genotypes and to identify SSR markers associated with low chloride accumulation using mixed linear model (MLM) procedure.
Material and methods
Plant material and phenotypic data
Seventy oriental-type and semioriental-type tobacco genotypes including RILs from the cross between Basma seres 31 and Dubec 566, some ‘Chopogh’ and Iranian water pipe's tobacco lines, as well as genotypes, from different countries were used in this study (). Data of chloride accumulation rates of genotypes were collected from previous studies (Darvishzadeh et al. Citation2011).
Table 1. List of studied oriental-type tobacco genotypes.
Genotypic data
Genomic DNA was extracted from the leaves of 70 genotypes following the method described by Doyle and Doyle (Citation1987). Concentration of DNA samples was determined by spectrophotometer (BioPhotometer 6131; Eppendorf, Hamburg, Germany) at 260 nm. The quality of the DNA was checked by running 1 µl DNA on 0.8% (w/v) agarose gel in 0.5× TBE buffer (45 mM Tris base, 45 mM boric acid, 1 mM ethylenediaminetetraacetic acid (EDTA) pH 8.0). DNA samples with a smear in the gel were rejected. Twenty-six SSR primer pairs out of 278 from the tobacco SSR database (Bindler et al. Citation2007, Citation2011) were used for DNA fingerprinting. The choice of SSR markers was based on their known genetic locations to obtain near-uniform coverage of the tobacco genome and clarity of produced bands (Bindler et al. Citation2007, Citation2011). PCR was performed in a 20 µl volume using a 96-well Eppendorf Mastercycler Gradient (Type 5331, Eppendorf AG, Hamburg, Germany). The reaction mixture contained 0.25 mM of each primer, 0.4 unit of Taq DNA polymerase (Cinna Gen Inc., Tehran, Iran), 100 µM of each dNTP (BioFluxbiotech, http://biofluxbiotech.com), 2 µl 10× PCR buffer, 2 mM MgCl2 (CinnaGen, Tehran, Iran), and 25 ng of template DNA. Amplification was carried for 35 cycles consisting of a denaturing step at 94°C for 1 min, annealing at 55°C for 1 min, and an extension step at 72°C for 1.5 min. An initial denaturaing step at 94°C for 4 min and a final extension step of 10 min at 72°C were also included. The reaction products were mixed with an equal volume of formamide dyes (98% formamide, 10 mM EDTA, 0.05% bromophenol blue, and 0.05% xylene cyanol) and resolved on a 3% (w/v) agarose gel in 0.5× TBE buffer. The gel was stained with 1.0 µg ml−1 ethidium bromide. Gels were photographed under UV light, using a Gel-Doc image analysis system (Gel Logic 212 PRO, USA).
Data analysis
The SSR data were scored as codominant markers in order to distinguish homozygotes and heterozygotes for each locus. Major allele frequency (MAF), polymorphic information content (), gene diversity (
), and allele number were calculated using Power Marker 3.25 software (http://statgen.ncsu.edu/powermarker/). Gene diversity, referred to as expected heterozygosity, is defined as the probability of two randomly chosen alleles from the population that is different.
, where f is the inbreeding coefficient and estimated from the data using the method of moments. Polymorphism information content (
) is estimated following the formula proposed by Botstein et al. (Citation1980):
.
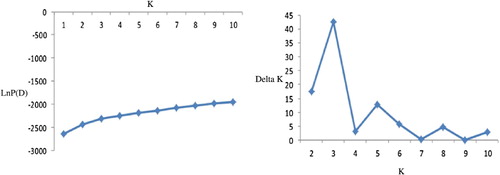
Population structure was analyzed using a model-based Bayesian approach in the software package Structure 2.3.4 (Pritchard et al. Citation2000). Five independent runs were performed setting the number of subpopulations (K) from 1 to 10, burn in time, and Markov Chain Monte Carlo (MCMC) replication number both to 100,000, and a model for admixture and correlated allele frequencies. The K value was determined by the log likelihood for each K; Ln P(D) = L(K) (Rosenberg et al. Citation2002). Since the distribution of Ln P(D) did not show a clear number of true K, delta K (ΔK) based on the second-order rate of change in the likelihood (ΔK) (Evanno et al. Citation2005) was used alternatively to identify a clear peak to represent the true K value. Inferred ancestry estimates of individuals (Q-matrix) were derived for the selected subpopulation (Pritchard et al. Citation2000). The kinship coefficients (K-matrix), r2, and D′ were estimated in Tassel 2.1 software. Cluster analysis based on neighbor joining method was performed in Tassel 2.1. Association mapping was performed to analyze marker-trait association using MLM approach in TASSEL 2.1 accounting for population structure and kinship relatedness (Q + K model).
Results
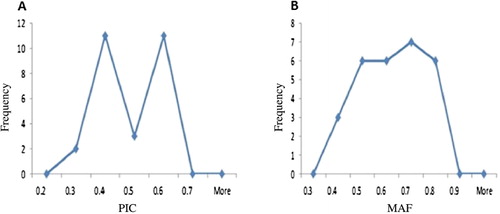
Chloride accumulation rates among oriental-type tobacco genotypes ranged from 0.33 to 2.5 with the average value of 1.35 (Darvishzadeh et al. Citation2011). Extensive phenotypic variation was observed for the measured quantitative trait in this oriental-type tobacco panel (Darvishzadeh et al. Citation2011). To evaluate the genetic diversity of the genotypes, we used SSR markers. A total number of 66 alleles were detected by using 26 SSR primer pairs on 70 oriental-type tobacco genotypes with an average of 2.53 alleles per locus. PIC ranged from 0.27 (pt30094) to 0.6 (pt30014) (). As shown in , the MAF exceeding 60% values was within 0.5–0.9. Meanwhile, gene diversity ranged from 0.33 to 0.66 that shows the probability of two alleles varies between two individuals.
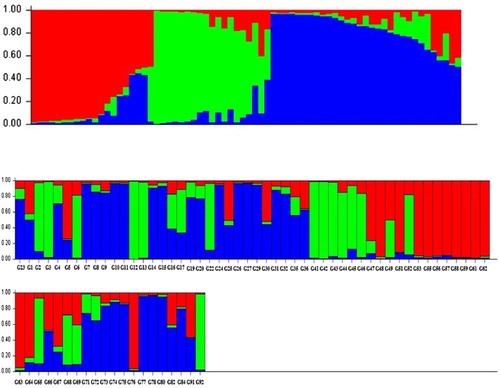
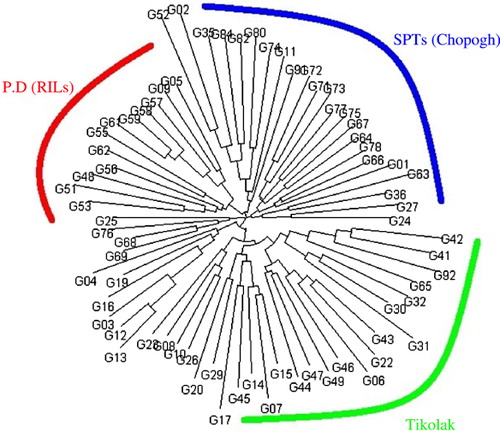
In order to understand the genetic structure of the association panel, a model-based Bayesian approach in the Structure software was used to assign each genotype into the corresponding subgroup. The group of 70 oriental-type tobacco genotypes was partitioned into three subgroups (). These subgroups matched with three sorts in our association panel including the following: Chopogh (SPTs), PDs, and Tikolak (). Eighty-one percent of PDs, 71% of SPTs, and 70% of Tikolak were assigned into the corresponding subgroups, and the remaining ones were categorized into the ‘mixed’ based on their Q values. Cluster analysis based on neighbor-joining algorithm, subdivided all of the 70 genotypes into three major subgroups, similar to results obtained from population structure analysis using Structure software ().
In the collection under investigation, 5.85% of the 325 SSR primer pairs showed a significant level of linkage disequilibrium (LD) (P ≤ 0.01). The r2 values for primer pairs ranged from 0.004 to 0.29, with the average value of 0.034. The D′ values ranged from 0.01 to 0.82 with the average value of 0.268. Using MLM procedure based on Q + K model 1 SSR locus (pt30027) from linkage group 13 (Bindler et al. Citation2007) was identified that possessed significant association (P ≤ 0.04) with the QTL controlling chloride accumulation rates in oriental-type tobacco genotypes ().
Table 2. SSR loci identified for chlorine accumulation rates in oriental-type tobacco genotypes using association mapping by MLM procedure.
Discussion
Genetic diversity, population structure, and LD analysis
In the molecular analysis, 66 alleles were detected at 26 SSR loci and tobacco genotypes were assigned into three subgroups (PDs SPTs, and Tikolak) based on Bayesian approach using Structure software and cluster analysis. In our previous investigations, the present population panel also presented high variability for different characters, such as chloride accumulation rates in leaves (Darvishzadeh et al. Citation2011), partial resistance to Orobanche (unpublished data), and powdery mildew (Darvishzadeh et al. Citation2010). So this population panel with high molecular and morphological genetic diversity and adverse population structure could be used for the association analysis. From breeder view, a higher variation for a character in the breeding materials increases the ability for selection toward its improvement.
Among the factors influencing marker–traits association, the admixture of populations is very important (Yu & Buckler Citation2006; Yu et al. Citation2006; Zhang et al. Citation2012). Association tests that do not attempt to account for the effects of population structure must be viewed with skepticism and may influence the ability to detect false-positive associations between markers and traits. Although there is a little bit of admixture (20–30%) in the present association panel that could bias the analysis, there were many models proposed to minimize the false-positive association analysis produced from the admixture of populations. Model Q + K is a very good model for resolving these kinds of problems (Ghavami et al. Citation2011). It has been shown that a Q + K matrices incorporated into the MLM model was important to minimize false-positive associations (Zhang et al. Citation2012). Newly, Fricano et al. (Citation2012) by using 49 SSR markers profile could classify 312 tobacco accessions to six main clades which correspond to ‘Oriental’, Flue-Cured’, ‘Burley’, ‘Dark’, ‘Primitive’, and ‘Other’ classes.
Recently, LD has been used in association mapping (Zhu et al. Citation2008) and to locate QTL or major genes, based on the cosegregation of specific marker alleles and traits (Rafalski & Morgante Citation2004). In this study, 5.85% of all possible pairs of SSR loci showed a significant level of LD (P ≤ 0.01) and the two most important and frequently used statistics for describing LD pattern (r2 and D′), showed a mean value of 0.034 and 0.268. Similar results were also reported by Jun et al. (Citation2007) and Zhang et al. (Citation2012) on soybean and maize, respectively. The high level of LD encouraged us to do association analysis on this association panel.
QTL mapping
Mapping a marker in close proximity of a QTL, controlling a specific trait offers an opportunity for tobacco breeders to apply marker-assisted selection (MAS) in their breeding programs. In several researches (Julio et al. Citation2006; Li-Hua et al. Citation2011; Hatami Maleki et al. Citation2013), biparental mapping population have been used to detect QTLs controlling chloride accumulation rate in tobacco genome. For instance, Julio et al. (Citation2006) by using a genetic linkage map developed by a variety of molecular markers on a RILs population from the cross between two flue-cured tobacco inbred lines, detected 75 QTLs on 12 linkage groups for 59 traits including leaf quality, chemical composition of lamina, and smoke properties. In their study (Julio et al. Citation2006), few QTLs were detected for chemical compositions, and there was not any QTL identified for chloride accumulation rate in the leaf. In the other study, Li-Hua et al. (Citation2011) using family-based linkage mapping approach, detected two QTLs for total chlorine concentration. Currently, Hatami Maleki et al. (Citation2013) developed a genetic linkage map for oriental-type tobacco by using F2 individuals from the cross between two divergence oriental-type tobacco genotypes including ‘SPT 406’ and ‘Basma seres 31’. They (Hatami Maleki et al. Citation2013) reported two QTLs for chloride accumulation rate in the leaf, namely, ChlIM and ChlCIM with R2 values of 0.4 and 0.07, using interval mapping and composite interval mapping, respectively. However, current gene mapping efforts in plants are shifting from conventional biparental QTL mapping to LD-based association mapping (Sorkheh et al. Citation2008), which is the most effective approach to utilize natural variation in the form of ex situ conserved crop genetic resources. Some successful reports on association mapping in plants such as rice (Yan et al. Citation2009), barley (Kraakman et al. Citation2006), wheat (Ghavami et al. Citation2011; Zhang et al. Citation2011), potato (D'hoop et al. Citation2008), soybean (Jun et al. Citation2007), maize (Andersen et al. Citation2007), chickpea (Saeed et al. Citation2013), and forage grasses (Dobrowolski & Forster Citation2007) are available. To our knowledge, this is the first report on the identification of responsible locus for chloride accumulation rate via association mapping in tobacco. Albeit, some of the SSR markers used in the present investigation had been applied previously by Hatami Maleki et al. (Citation2013), but there was not detected any common linked marker between previous linkage map (Hatami Maleki et al. Citation2013) and association analysis.
In conclusion, the results of present study, demonstrated the significant potential of LD-based association mapping of complex traits in tobacco with a relatively small number of markers. Our results also suggest that population structure and relatedness should be taken into account to perform unbiased population-based association mapping in tobacco germplasm and highlight the potential of MLM association mapping in tobacco. SSR marker associated with chloride accumulation rate could be useful in tobacco improvement using MAS programs.
Acknowledgment
The authors thank Urmia Tobacco Research Center for their practical help in field experiment and Urmia Institute of Biotechnology about lab facilities.
References
- Abdurakhmonov IY, Abdukarimov A. 2008. Application of association mapping to understanding the genetic diversity of plant germplasm resources. Int J Plant Genom. 2008:1–18.
- Andersen JR, Zein I, Wenzel G, Krützfeldt B, Eder J, Ouzunova M, Lübberstedt T. 2007. High levels of linkage disequilibrium and associations with forage quality at a Phenylalanine Ammonia-Lyase locus in European maize (Zea mays L.) inbreds. Theor Appl Genet. 114:307–319. 10.1007/s00122-006-0434-8
- Bindler G, Plieske J, Bakaher N, Gunduz I, Ivanov N, Van der Hoeven R, Ganal M, Donini P. 2011. A high density genetic map of tobacco (Nicotiana tabacum L.) obtained from large scale microsatellite marker development. Theor Appl Genet. 123:219–230. 10.1007/s00122-011-1578-8
- Bindler G, Van der Hoeven R, Gunduz I, Plieske J, Ganal M, Rossi L, Gadani F, Donini P. 2007. A microsatellite marker based linkage map of tobacco. Theor Appl Genet. 114:341–349. 10.1007/s00122-006-0437-5
- Botstein D, White RL, Skolnick M, Davis RW. 1980. Construction of a genetic linkage map in man using restriction fragment length polymorphisms. Am J Hum Genet. 32:314–331.
- Breseghello F, Sorrells M. 2006. Association mapping of kernel size and milling quality in wheat (Triticum aestivum L.) cultivars. Genetics. 172:1165–1177. 10.1534/genetics.105.044586
- Darvishzadeh R, Alavi SR. 2011. Genetic analysis of chloride concentration in oriental tobacco genotypes. J Plant Nutr. 34:1070–1078. 10.1080/01904167.2011.555588
- Darvishzadeh R, Alavi SR, Sarrafi A. 2010. Resistance to powdery mildew (Erysiphe cichoracearum DC.) in oriental and semi-oriental tobacco germplasms under field condition. J Crop Improv. 24:122–130.
- Darvishzadeh R, Alavi SR, Sarrafi A. 2011. Genetic variability for chlorine concentration in oriental tobacco genotypes. Arch Agron Soil Sci. 57:167–177. 10.1080/03650340903286414
- Darvishzadeh R, Poormohammad Kiani S, Huguet T, Sarrafi A. 2008. Genetic variation and identification of molecular marker associated with partial resistance to Phoma macdonaldii in gamma-irradiation-induced mutants of sunflower. Can J Plant Pathol. 30:106–114. 10.1080/07060660809507501
- Davar R, Darvishzadeh R, Rezaee Danesh Y, Kholghi M, Azizi M, Shah DA. 2012. Single sequence repeat markers associated with partial resistance in sunflower to Phoma macdonaldii. Phytopathol Mediterr. 51:541–548.
- Davis DL, Nielson MT. 1999. Tobacco: production, chemistry and technology. Malden (MA): Blackwell; p. 467.
- D'hoop BB, Paulo MJ, Mank RA, Van Eck HJ, Van Eeuwijk FA. 2008. Association mapping of quality traits in potato (Solanum tuberosum L.). Euphytica. 161:47–60. 10.1007/s10681-007-9565-5
- Dobrowolski MP, Forster JW. 2007. Linkage disequilibrium-based association mapping in forage species. In: Oraguzie NC, Rikkerink EHA, Gardiner SE, De Silva HN, editors. Association mapping in plants. New York: Springer; p. 197–210.
- Doyle JJ, Doyle JL. 1987. A rapid DNA isolation procedure for small quantities of fresh leaf tissue. Phytochem Bull. 19:11–15.
- Evanno G, Regnaut S, Goudet J. 2005. Detecting the number of clusters of individuals using the software STRUCTURE: a simulation study. Mol Ecol. 14:2611–2620. 10.1111/j.1365-294X.2005.02553.x
- Fricano A, Bakaher N, Del Corvo M, Piffanelli P, Donini P, Stella A, Nikolai V, Ivanov NV, Pozz C. 2012. Molecular diversity, population structure, and linkage disequilibrium in a worldwide collection of tobacco (Nicotiana tabacum L.) germplasm. BMC Genet. 13:18. 10.1186/1471-2156-13-18
- Ghavami F, Elias EM, Mamidi S, Ansari O, Sargolzaei M, Adhikari T, Mergoum M, Kianian SF. 2011. Mixed model association mapping for Fusarium head blight resistance in Tunisian-derived durum wheat populations. G3: Genes/Genomes/Genetics. 1:209–218.
- Godwin ID, Aitken EAB, Smith LW. 1997. Application of inter-simple sequence repeat (ISSR) markers to plant genetics. Electrophoresis. 18:1524–1528. 10.1002/elps.1150180906
- Hatami Maleki H, Karimzadeh G, Darvishzadeh R, Naghavi MR, Sarrafi A. 2013. Identification of QTLs associated with low chloride accumulation in oriental tobacco. Genetika. 45: 55–864.
- Julio E, Denoyes-Rothan B, Verrier JL, Dorlhac de Borne F. 2006. Detection of QTLs linked to leaf and smoke properties in Nicotiana tabacum based on a study of 114 recombinant inbred lines. Mol Breed. 18:69–91. 10.1007/s11032-006-9019-0
- Jun TH, Van K, Kim MY, Lee HS, Walker DR. 2007. Association analysis using SSR markers to find QTL for seed protein content in soybean. Euphytica. 162:179–191. 10.1007/s10681-007-9491-6
- Kalia RK, Rai MK, Kalia S, Singh R, Dhawan AK. 2011. Microsatellite markers: an overview of the recent progress in plants. Euphytica. 177:309–334. 10.1007/s10681-010-0286-9
- Kraakman ATW, Martínez F, Mussiraliev B, Van Eeuwijk FA, Niks RE. 2006. Linkage disequilibrium mapping of morphological, resistance, and other agronomically relevant traits in modern spring barley cultivars. Mol Breed. 17:41–58. 10.1007/s11032-005-1119-8
- Li-Hua L, Mei-Xia C, Dong-Xin Z, Shun-Hui C, Ai-Fen T, Yan-Kun L, Hong-Bo MA, Jian-Min QA, Yu-Chun G. 2011. QTL Analysis of six important traits in tobacco (Nicotiana tabacum L.). Acta Agronomica Sinica. 37:1577–1584. 10.3724/SP.J.1006.2011.01577
- Moon HS, Nifong JM, Nicholson JH, Heineman A, Lion K, Van der Hoeven R, Hayes AJ, Lewis RS. 2009. Microsatellite-based analysis of tobacco (Nicotiana tabacum L.) genetic resources. Crop Sci. 49:2149–2159. 10.2135/cropsci2009.01.0024
- Myles S, Peiffer J, Brown PJ, Ersoz ES, Zhang Z, Costich DE, Buckler ES. 2009. Association mapping: critical considerations shift from genotyping to experimental design. Plant Cell. 21:2194–2202. 10.1105/tpc.109.068437
- Parrisseaux B, Bernardo R. 2004. In silico mapping of quantitative trait loci in maize. Theor App Genet. 109:508–514. 10.1007/s00122-004-1666-0
- Pritchard JK, Stephanes M, Rosenberg NA, Donnelly P. 2000. Association mapping in structured populations. Am J Hum Genet. 67:170–181. 10.1086/302959
- Rafalski A, Morgante M. 2004. Corn and humans: recombination and linkage disequilibrium in two genomes of similar size. Trends Genet. 20:103–111. 10.1016/j.tig.2003.12.002
- Rosenberg NA, Pritchard JK, Weber JL, Cann HM, Kidd KK, Zhivotovsky LA, Feldman MW. 2002. The genetic structure of human populations. Science. 298:2381–2385. 10.1126/science.1078311
- Russo MA, Ficco DBM, Marone D, De Vita P, Vallega V, Rubies-Autonel C, Ratt, C, Ferragonio P, Giovanniello V, Pecchioni N, et al. 2012. A major QTL for resistance to soil-borne cereal mosaic virus derived from an old Italian durum wheat cultivar. J Plant Interact. 7:290–300. 10.1080/17429145.2011.640437
- Saeed A, Darvishzadeh R, Basirnia A. 2013. Simple sequence repeat markers associated with agro-morphological traits in chickpea (Cicer arietinum L.). Zemdirbyste-Agriculture. 100:433–440. 10.13080/z-a.2013.100.055
- Sorkheh K, Malysheva-Otto LV, Wirthensohn MG, Tarkesh-Esfahani S, Martínez-Gómez P. 2008. Linkage disequilibrium, genetic association mapping and gene localization in crop plants. Genet Mol Biol. 31:805–814. 10.1590/S1415-47572008005000005
- Thornsberry JM, Goodman MM, Doebley J, Kresovich S, Nielsen D, Buckler ES. 2001. Dwarf8 polymorphisms associate with variation in flowering time. Nat Genet. 28:286–289. 10.1038/90135
- Wilcox PL, Echt EC, Burdon RD. 2007. Gene-assisted selection: applications of association genetics for forest tree breeding. In: Oraguzie NC, Rikkerink EHA, Gardiner SE, De Silva HN, editors. Association mapping in plants. New York: Springer; p. 211–247.
- Yan J, Shan T, Warburton M, Buckler E, McMullen M, Crouch J. 2009. Genetic characterization and linkage disequilibrium estimation of a global maize collection using SNP markers. PLoS ONE. 4:e8451. 10.1371/journal.pone.0008451
- Yu J.M, Buckler ES. 2006. Genetic association mapping and genome organization of maize. Curr Opin Biotech. 17:155–160. 10.1016/j.copbio.2006.02.003
- Yu J, Pressoir G, Briggs WH, Vroh Bi I, Yamasaki M. 2006. A unified mixed-model method for association mapping that accounts for multiple levels of relatedness. Nat Genet. 38:203–208. 10.1038/ng1702
- Zhang J, Hao C, Ren Q, Chang X, Liu G, Jing R. 2011. Association mapping of dynamic developmental plant height in common wheat. Planta. 234:891–902. 10.1007/s00425-011-1434-8
- Zhang Q, Wu C, Ren F, Li Y, Zhang C. 2012. Association analysis of important agronomical traits of maize inbred lines with SSRs. Aust J Crop Sci. 6:1131–1138.
- Zhu CM, Gore E, Buckler S, Yu J. 2008. Status and prospects of association mapping in plants. Plant Genome. 1:5–20. 10.3835/plantgenome2008.02.0089