
Abstract
Spatial patterns and associations of plant species are important for revealing how species interact with each other and with the environment, and hence have important implications for the understanding of species interaction and underlying ecological processes with apparent patterns in temperate desert vegetation. In this paper, the function g (r) was used to characterize the spatial patterns and associations of four dominant woody species in three 1-ha desert plant plots in the desert–oasis ecotone of South Junggar Basin, NW China. The complete spatial randomness null model showed four species exhibited significant aggregations at small scales (<20 m). Anabasis aphylla and Nitraria roborowskii, Haloxylon ammodendron and Reaumuria songarica were spatially positive associations at small scales with the independent null model, while A. aphylla and H. ammodendron, A. aphylla and R. songarica, R. songarica and N. roborowskii species pairs exhibited negative associations at small or moderate scales (20–60 m) in our study. The random labeling null model showed that dead standing plants of A. aphylla were largely determined by the combined effects of intra- and interspecific competition. In addition, the results also indicated that the two main factors of habitat heterogeneity and sandy desertification play important roles in determining spatial distribution patterns and associations of woody species in the desert–oasis ecotone of South Junggar Basin. Thus, the differences of species features in spatial patterns and associations should be paid more attention when planning afforestation and developing conservation strategies.
Introduction
Spatial patterns of plants are important characteristics of vegetation and play a significant role in ecological processes, including competitive coexistence and transmission of mortality, and have impacts that scale up to ecosystem-level processes (Alekseev & Zherebtsov Citation1995; Arévalo & Fernández-Palacios Citation2003). However, many factors play important roles in determining the spatial patterns of tree species distribution in a plant community. In general, biotic and abiotic factors may influence the distribution of species and potentially control their abundance and promote coexistence (Zhang et al. Citation2010; Schleicher et al. Citation2011). Furthermore, many species also exhibited ecological habitat preferences, although species richness and associations are different among sites (Bazzaz Citation1991; Cheng et al. Citation2014). In addition, theoretical models also confirmed the coexistence of plant species based on habitat heterogeneity (Tilman & Pacala Citation1993).
Both intra- and interspecific competition should be considered to understand the dynamics of the component species (He & Duncan Citation2000; Nishimura et al. Citation2005). Conversely, the spatial patterns of plants affect competition (Duncan Citation1991; Hara et al. Citation1995; Kubota & Hara Citation1995). Regular patterns have been historically viewed as the result of intense competition for limited resources, such as available water or soil resources (King & Woodell Citation1973; Phillips & MacMahon Citation1981; Skarpe Citation1991). Intraspecific aggregation has been attributed to environmental heterogeneity (Schenk et al. Citation2003; Perry et al. Citation2009), seed dispersal (Schurr et al. Citation2004), and plant interactions (Phillips & MacMahon Citation1981; Tirado & Pugnaire Citation2003). In most arid communities, interspecific aggregation of forbs, grasses, and juvenile woody plants around bigger shrubs and trees is often interpreted as evidence of facilitation (Brooker et al. Citation2008; Rayburn & Wiegand Citation2012; Wang et al. Citation2013).
Desert–oasis ecotone is an important constituent of oasis ecosystem and has a vital role in maintaining the stability of oasis (Li et al. Citation2007; Su et al. Citation2007). Meanwhile, the desert–oasis ecotone is more sensitive to disturbance than its adjacent ecosystems (Su et al. Citation2007). When it is disturbed during exploration or utilization, the ecotone has a potential trend to evolve into the desertified land or shifting sand dunes (Ding & Zhang Citation2006; Wang et al. Citation2013). Due to severe sandy desertification and water stress in the desert–oasis ecotone of South Junggar Basin, the community composition is simple, and the richness and species diversity are very low. Now, there are few reports on the interspecific associations and the coexistence mechanisms of the desert species, while some studies on spatial pattern and intraspecific association of the monospecific stands have been recently conducted in the desert–oasis ecotone of South Junggar Basin (Liu et al. Citation2008; Song et al. Citation2010). In this study, we analyze the spatial patterns and associations of four dominant woody species in the desert–oasis ecotone of South Junggar Basin, NW China. Three main questions are addressed: (1) Do the four dominant woody species in oasis-desert ecotone show an aggregated spatial distribution? (2) Is the habitat occupied by the four dominant woody species associated with the sandy desertification? (3) Do dead standing plants of Anabasis aphylla have relation to interspecific competition in consideration of massive mortality?
Materials and methods
Study site
The study area was located on the desert–oasis ecotone spanning an elevation range of 258–265 m in South Junggar Basin, NW China (45°22′43.4″N, 84°50′32.5″E), from July 2010 to September 2010, which is a transitional zone from the oasis to the desert. Geological substrates of the study site include aeolian deposits sandy soil and highly eroded diluvial soil. The mean temperature varies from 5°C to 9°C, minimum winter temperatures from –30°C to –41°C, and maximum summer temperatures from 30°C to 40°C. Snow melts at the end of winter, together with the rainfall, amounts to an annual precipitation of 100–150 mm.
Three typical sample plots (3 ha) were laid out in an area with ecotone or hierarchical distribution between diluvial and sandy soil. The microtopography of three plots is complicated and heterogeneous. The sandy soil area takes up 55–70% and sand layer is 5–35 cm deep. The sand burial depth has different spatial distribution according to the Kriging (). The sand burial changes limited water distribution. The mean soil water content under sand bed was 4.55%, more than bare land (0.81%) in April. In the study area, vegetation cover ranges between 10% and 35%, dominated by A. aphylla, Haloxylon ammodendron, Reaumuria songarica, and Nitraria roborowskii (). Other woody plant species in the area include Lycium ruthenicum, Halostachys caspica, Halocnemum strobilaceum, and Tamarix ramosissima.
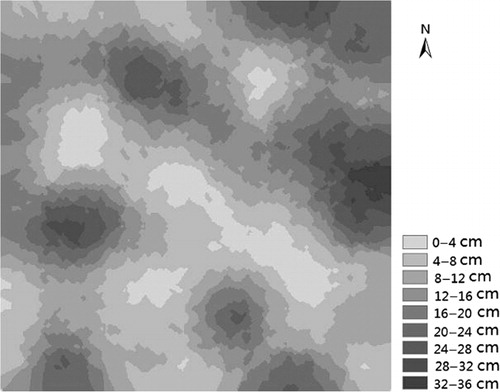
Table 1. Basic feature of woody plants in the study plot.
Data collection
Each plot (100 × 100 m) was divided into 400 contiguous 5 × 5 m quadrates, as the basic unit of vegetation survey, using the DQL-1 forest compass (Harbin Optical Instrument Factory, China). All woody plants, including living and dead standing ones, were investigated. The species names, relative location of each individual, height, crown width (the greatest diameter of the vertical projection of the crown in two directions, i.e. north–south or east–west), and microhabitat (e.g. soil surface, depression patch) were recorded.
Data analysis
The examination of spatial point patterns is often carried out using the second moment function K to test the null hypothesis that a point pattern is spatially random (Diggle Citation2003). Ripley's K-function is a cumulative function of the points within a distance r, i.e. each bigger radius includes points of a smaller radius, and it is possible that information from two different scales may interfere with each other. The pair correlation function g (r), also known as the O-ring statistic (Wiegand & Moloney Citation2004), is an alternative statistic that estimates the number of points within concentric rings at the distance r rather than within a radius. The accumulative K-function can detect aggregation or regularity up to a given distance r and is therefore appropriate if the process in question (e.g. the negative effect of competition) may work only up to a certain distance, whereas the function g (r) can detect aggregation or regularity at a given distance r. The function g (r) has the additional advantage that it is a probability density function with the interpretation of a neighborhood density, which is more intuitive than an accumulative measure (Stoyan & Penttinen Citation2000).
In this study, the univariate function g (r) was used to analyze the spatial patterns of different species, and the bivariate function g (r) was adopted to analyze the spatial associations among different species in the plots. For the univariate analyses, we used the null model of complete spatial randomness (CSR) as a null hypothesis (Wiegand & Moloney Citation2004; Getzin et al. Citation2008), because the spatial distributions of plants in the three plots seem to be affected significantly by drought stress and habitat heterogeneity (e.g. soil patch and micro topography). We examined the spatial association between the two species with the independent null model (Wiegand & Moloney Citation2004). For univariate analysis, if g (r) above the upper confidence limit indicates aggregation, while g (r) below the lower confidence limit indicates regularity. For bivariate analysis, if at a given distance r, g12 (r) is above the upper (or below the lower) limit of the confidence envelope, it indicates that species 2 is positively (or negatively) associated with species 1 at the distance r. Function g12 (r) is within the confidence intervals, which indicates that there is no interaction between species 1 and 2.
Contrary to the two spatial approaches, we investigated the spatial relation between the distributions of dead standing and living plants, and the random labeling null model was used to detect possible differences in the spatial distribution of dead standing plants compared with the distribution of living plants regardless of the underlying first-order process (Wiegand & Moloney Citation2004). Random labeling has not been frequently used in forestry research, but it has been implicitly used to assess ‘random mortality’, considering labels as the living and dead standing plants categories (Kenkel Citation1988). We used the case-control design with living plants of four species as pattern 1 (control pattern) and A. aphylla dead standing plants as pattern 2 (cases). Thus, a difference of g12 (r) and g11 (r) provides insights into the spatial distribution of A. aphylla dead standing plants around living plants of four species in relation to the spatial distribution of living plants to each other (Getzin et al. Citation2008; Schleicher et al. Citation2011). The second comparison, g12 (r) – g11 (r), can be used to evaluate the spatial distribution of dead standing plants. For example, a positive deviation would mean that dead standing plants exhibited an aggregated spatial distribution in comparison to adult plants (Getzin et al. Citation2006, Citation2008; Schleicher et al. Citation2011). To perform the random labeling analysis, the spatial position of all plants in the plot remained fixed, but the labels of the points (living plants or dead standing plants) were randomly assigned to the overall pattern (Bailey & Gatrell Citation1995).
In addition, the intensity of spatial patterns or spatial associations is defined as the magnitude of the deviation from randomness or independence (Rebertus et al. Citation1989). All analyses were conducted in the Programita software package (Wiegand & Moloney Citation2004). The distance r represents spatial scales within 100 m in the present paper. In all analyses, we used a 1-m cell size, which is a fine enough resolution to answer our questions, and a ring width of one cell. We calculated the statistics up to a scale r of 100 m (100 cells) taking into account plot size. Ninety-nine Monte Carlo simulations were used to generate 99% confidence envelopes.
Results
Stand structure
The total number of woody plants in the plot was 7781 individuals (6255 living and 1526 dead standing), consisting of eight species, eight genus, and three families. A. aphylla population was in possession of the dominance of spatial occupation capacity before sandy desertification in the plot, since 5744 individuals or 73.8% were A. aphylla (4372 living and 1372 dead standing) (). H. ammodendron (1262 living and 106 dead standing) was the main associated plant species of A. aphylla. R. songarica and N. roborowskii made up 3.3% and 3.6% of the total number, respectively. The other four species together occupied only 1.7% of the total number. H. ammodendron was the most abundant canopy species and showed the largest mean canopy (107.5 cm) and largest mean height (88.2 cm). The largest plant height measured in the plot was for H. ammodendron (3.2 m).
Spatial patterns
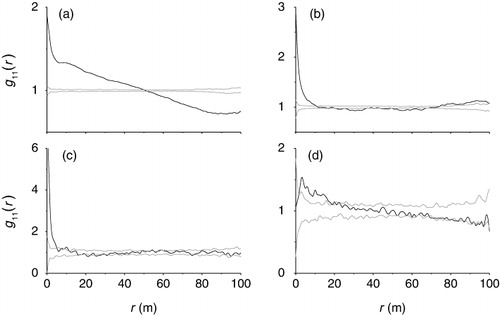
The spatial distribution of the four dominant woody species was analyzed by the living plants (). A. aphylla was distributed all over the plot. Analysis of the spatial pattern of A. aphylla showed that the population was significantly aggregated at all distances between 0 m and 52 m (). H. ammodendron population was significantly aggregated at 0–12 m and tended to regular spatial distribution at 12–74 m (). R. songarica population showed significantly aggregated distribution at 0–6 m and tended to random spatial distribution at scales >12 m (). N. roborowskii population was significantly aggregated at 2–20 m and tended to random spatial distribution at other scales ().
Spatial associations
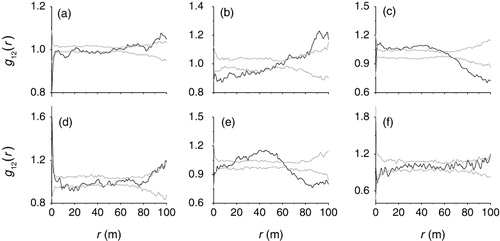
In the plots, A. aphylla significantly had a negative association at 0–3 m, 7–17 m, 32–34 m, 39–41 m, and 42–53 m with H. ammodendron (). A. aphylla and R. songarica was spatially negative association at 0–41 m (). A. aphylla and N. roborowskii was spatially no association within 1 m scales, and was a positive association at 1–60 m (). H. ammodendron and R. songarica showed positive association at 0–3 m, and negative association at 11–13 m and 15–26 m (). H. ammodendron and N. roborowskii had spatially positive association at 19–60 m, but at <19 m scales, they were spatially independent (). H. ammodendron and N. roborowskii were spatially negative association at 2–5 m and 9–14 m; they were spatially independent at other scales ().
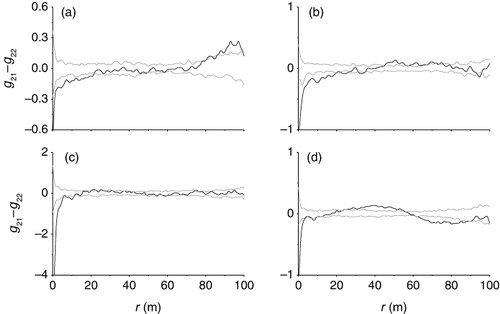
For dead standing plants of A. aphylla in the plots, the test statistic g21 (r) – g22 (r) differed significantly from the random labeling null model at 0–23 m, indicating an additional aggregation of dead standing plants of A. aphylla independent of A. aphylla plants pattern (). Similarly, the test statistic g21 (r) – g22 (r) revealed strong departures from random labeling pointing to an aggregation mechanism of dead standing plants of A. aphylla independent of H. ammodendron plants pattern at 0–21 m, 22–26 m, and 32–35 m (). In addition, there was a very strong aggregation among dead standing plants independent from dead standing plants of A. aphylla and R. songarica plants relation at 0–6 m and 8–12 m, and dead standing plants of A. aphylla and N. roborowskii plants were spatially positive association at 0–5 m and 8–13 m ( and ).
Discussion
Aggregated pattern of desert woody species
Aggregated distribution in species is a widespread pattern in nature (Prentice & Werger Citation1985; Wang et al. Citation2013; Cheng et al. Citation2014). This issue also is especially relevant and common in arid and semi-arid shrub lands (Prentice & Werger Citation1985). In our study, four dominant desert woody species mainly showed aggregated patterns as well at small scales (<20 m) in the desert–oasis ecotone of South Junggar Basin, NW China. Similarly, the spatial aggregation distribution of H. ammodendron plants at small scales was exhibited in four soil textures by Song et al. (Citation2010). Aggregation can often be explained simply in terms of regeneration near to seed sources, habitat heterogeneity, or perhaps in safe sites associated with older, larger individuals of one's own or other species (Zhang et al. Citation2010, Citation2013; Myster Citation2013). In the study sites, the microtopography, such as depression, runnel, and sandy mound, leads to the high habitat heterogeneity of community. There can be no doubt that these seed traps played a role in the maintenance of the aggregated structure. In the plots, we found that variation in depression corresponded closely with the distribution of A. aphylla seedling number. The relative depression, representing the gradients of microhabitat conditions such as water and salt, was one of the most important variables for predicting the ecesis condition of the species. Moreover, in the sand texture, there should be more plant available water than in finer-textured clay soils due to the high infiltration rate, deep percolation, and less evaporation of capillary water in coarse soil (McAuliffe Citation1994; Zou et al. Citation2010). For example, H. ammodendron subtrees developed more feeder roots in sandy compared with heavy textured soil, showing that plants at coarse soil have a greater need to develop more roots (Zou et al. Citation2010). It is worth mentioning that water is often the most limiting resource in semi-arid and arid area (Sheng et al. Citation2004). Small-scale variation in vegetation, soil surface cover, and soil texture alters the amount of water available to plants (Whitford Citation2003; Zou et al. Citation2010). Therefore, we inferred that habitat heterogeneity is considered to be the most likely factor that leads to water assemble and population aggregation.
Spatial associations and competition of desert woody species
As an important natural selection pressure of plant distribution in desert areas, desertification plays an important role on the community succession (Maun Citation1998; Peng et al. Citation2012; Xu et al. Citation2012). Some studies showed that sand burial can enhance the seed germination and seedling emergence of the sand burial-tolerant shrubs (Zhang et al. Citation2010; Wang et al. Citation2013). During the process of wind and sand disturbance in woody plant communities of Junggar Basin, strongly sand burial-tolerant subtree H. ammodendron plays a expand role after sand invasion, and moderate sand burial-tolerant shrub R. songarica and N. roborowskii can maintain growth in the early sandy desertification, while the occurrence of weakly sand burial-tolerant subshrub A. aphylla is gradually reduced and die. Therefore, this difference in density of the species can be caused by (1) niche differences, with H. ammodendron preferring sandy soil and A. aphylla preferring diluvial soil and (2) a competitive effect, in which H. ammodendron subtrees may be a stronger competitor on the sandy soil than A. aphylla, R. songarica, and N. roborowskii.
A. aphylla and N. roborowskii, H. ammodendron and R. songarica showed spatially positive associations at smaller scales, indicating that they prefer the similar habitats. However, spatial negative associations between species provide indirect evidence of habitat differentiation (He et al. Citation1997; Bunyavejchewin et al. Citation2003). A. aphylla and H. ammodendron, A. aphylla and R. songarica, R. songarica and N. roborowskii species pairs exhibited negative associations at small or moderate scales in our study, suggesting the importance of soil habitat differentiation. Habitat specialization based on niche differentiation of resources could be the reason that different tree species are best suited to different habitats (Harms et al. Citation2001). In the plots, the dominant woody species therefore coexist and are strongly associated with various habitats that require for survival and recruitment. Some studies have revealed the importance of topographical variations in determining the species coexistence (Sri-ngernyuang et al. Citation2003; Yamada et al. Citation2006). Our study results showed that the soil variations in the desert and oasis transition belt determine the co-occurrence of woody species after sandy desertification.
Cao et al. (Citation2005) reported that the niche breadths of most original species decreased and those of psammophytic species increased accordingly in the process of desertification. This process weakens the plant growth and can affect some plant survival (Maun & Lapierre Citation1986; Zhang & Maun Citation1990; Yu et al. Citation2001). The random labeling null model showed that the aggregation of dead standing plants of A. aphylla was strong around A. aphylla, H. ammodendron, R. songarica, and N. roborowskii plants, indicating intense intra- and interspecific competition after sandy desertification. Intraspecific and interspecific interactions determine the structure and dynamics of ecological communities and their responses to environmental change (Mangla et al. Citation2011). Results indicated that the dead standing plants of A. aphylla mainly caused by inter- and intraspecific competition in changing harsh environments (desertification).
Conclusions
We suggested that habitat heterogeneity and sand burial were two primary driving forces for spatial patterns and associations of woody plant community in the desert–oasis ecotone of South Junggar basin, NW China. Spatial pattern analyses showed that the aggregated patterns of woody plant community may be formed by the habitat heterogeneity such as microtopography and limited water distribution. Meanwhile, sand burial seems to be the main force driving community succession. This process causes the species with weakly sand burial tolerance to degenerate and psammophytic species to expand. Such studies could contribute to the understanding of species interaction and underlying ecological processes with apparent patterns in temperate desert vegetation.
Acknowledgments
The research is supported by the National Basic Research Program of China [2010CB951003], the Program of National Natural Science Foundation of China [31360170] and the Cultivation Program of Young Scientific and Technologic Talent of Shihezi University [2013ZRKXYQ11]. The authors thank all those who provided helpful suggestions and critical comments on this manuscript and anonymous reviewers.
Related Research Data
References
- Alekseev AS, Zherebtsov, RR. 1995. Regularities of spatial distribution of damaged vegetation under conditions of regional and local air pollution (with reference to the impact zone around the Pechenganikel mining and smelting plant). Russ J Ecol. 26:428–435.
- Arévalo JR, Fernández-Palacios JM. 2003. Spatial patterns of trees and juveniles in a laurel forest of Tenerife, Canary Islands. Plant Ecol. 165:1–10. 10.1023/A:1021490715660
- Bailey TC, Gatrell AC. 1995. Interactive spatial data analysis. Harlow: Longman Group Limited.
- Bazzaz FA. 1991. Habitat selection in plants. Am Nat. 137:116–130. 10.1086/285142
- Brooker RW, Maestre FT, Callaway RM, Lortie CL, Cavieres LA, Kunstler G, Liancourt P, Tielbörger K, Travis JMJ, Anthelme F, et al. 2008. Facilitation in plant communities: the past, the present, and the future. J Ecol. 96:18–34. 10.1111/j.1365-2745.2008.01373.x
- Bunyavejchewin S, LaFrankie JV, Baker PJ, Kanzaki M, Ashton PS, Yamakura T. 2003. Spatial distribution patterns of the dominant canopy dipterocarp species in a seasonal dry evergreen forest in western Thailand. For Ecol Manage. 175:87–101. 10.1016/S0378-1127(02)00126-3
- Cao CY, Zhu DH, Geng L. 2005. Plant species diversity changes of Caragana microphylla pasture in process of desertification. Chin J Soil Water Conserv. 19:166–169.
- Cheng XQ, Han HR, Kang FF, Song YL, Liu K. 2014. Point pattern analysis of different life stages of Quercus liaotungensis in Lingkong Mountain, Shanxi Province, China. J Plant Interact. 9:233–240.
- Diggle PJ. 2003. Statistical analysis of spatial point patterns. 2nd ed. London: Arnold.
- Ding JL, Zhang Y. 2006. Vegetation actualities and feasibility of restoration for the periphery of oasis in extreme arid region: taking Qira County of Xinjiang as an example. Ecol Econ. 2:183–189.
- Duncan RP. 1991. Competition and the coexistence of species in a mixed podocarp stand. J Ecol. 79:1073–1084. 10.2307/2261099
- Getzin S, Dean C, He FL, Trofymow JA, Wiegand K, Wiegand T. 2006. Spatial patterns and competition of tree species in a Douglas-fir chronosequence on Vancouver Island. Ecography. 29:671–682. 10.1111/j.2006.0906-7590.04675.x
- Getzin S, Wiegand T, Wiegand K, He F. 2008. Heterogeneity influences spatial patterns and demographics in forest stands. J Ecol. 96:807–820. 10.1111/j.1365-2745.2008.01377.x
- Hara T, Nishimura N, Yamamoto S. 1995. Tree competition and species coexistence in a cool-temperate old-growth forest in southwestern Japan. J Veg Sci. 6:565–574. 10.2307/3236355
- Harms KE, Condit R, Hubbell SP, Foster RB. 2001. Habitat associations of trees and shrubs in a 50-ha neotropical forest plot. J Ecol. 89:947–959. 10.1111/j.1365-2745.2001.00615.x
- He F, Duncan RP. 2000. Density-dependent effects on tree survival in an old-growth Douglas fir forest. J Ecol. 88:676–688. 10.1046/j.1365-2745.2000.00482.x
- He F, Legendre P, Lafrankie JV. 1997. Distribution patterns of tree species in a Malaysian tropical rain forest. J Veg Sci. 8:105–114. 10.2307/3237248
- Kenkel NC. 1988. Pattern of self-thinning in jack pine: testing the random mortality hypothesis. Ecology. 69:1017–1024. 10.2307/1941257
- King TJ, Woodell SRJ. 1973. The causes of regular pattern in desert perennials. J Ecol. 61:761–765. 10.2307/2258648
- Kubota Y, Hara T. 1995. Tree competition and species coexistence in a sub-boreal forest, northern Japan. Ann Bot. 76:503–512. 10.1006/anbo.1995.1126
- Li J, Zhao C, Zhu H, Li Y, Wang F. 2007. Effect of plant species on shrub fertile island at an oasis–desert ecotone in the South Junggar Basin, China. J Arid Environ. 71:350–361. 10.1016/j.jaridenv.2007.03.015
- Liu T, Zhao XJ, Jia YM, Cui YH, Luo C, Wei P, Zhang YH, Lin HR. 2008. Spatial pattern of population recruitment of C. ewer smanniana in South of Gurbantunggut Desert. Chin J Desert Res. 28:259–265.
- Mangla S, Sheley RL, James JJ, Radosevich SR. 2011. Intra and interspecific competition among invasive and native species during early stages of plant growth. Plant Ecol. 212:531–542. 10.1007/s11258-011-9909-z
- Maun MA. 1998. Adaptations of plants to burial in coastal sand dunes. Can J Bot. 76:713–738.
- Maun MA, Lapierre J. 1986. Effects of burial by sand on seed germination and seedling emergence of four dune species. Am J Bot. 73:450–455. 10.2307/2444088
- McAuliffe JR. 1994. Landscape evolution, soil formation, and ecological patterns and processes in Sonoran Desert Bajadas. Ecol Monogr. 64:111–148. 10.2307/2937038
- Myster RW. 2013. The role of seed predation in the maintenance of the Cross Timbers ecotone of Oklahoma, USA. J Plant Interact. 8:134–139. 10.1080/17429145.2012.707234
- Nishimura N, Hara T, Kawatani M, Hoshino D, Yamamoto S. 2005. Promotion of species co-existence in old-growth coniferous forest through interplay of life-history strategy and tree competition. J Veg Sci. 16:549–558. 10.1111/j.1654-1103.2005.tb02395.x
- Peng F, Wang T, Liu LC, Huang CH. 2012. Evolution phases and spatial pattern of Nebkhas in Minqin desert-oasis ecotone. Chin J Desert Res. 32:593–599.
- Perry GLW, Enright NJ, Miller BP, Lamont BB. 2009. Nearest-neighbour interactions in species-rich shrublands: the roles of abundance, spatial patterns and resources. Oikos. 118:161–174. 10.1111/j.1600-0706.2008.16947.x
- Phillips DL, MacMahon JA. 1981. Competition and spacing patterns in desert shrubs. J Ecol. 69:97–115. 10.2307/2259818
- Prentice IC, Werger MJA. 1985. Clump spacing in a desert dwarf shrub community. Vegetatio. 63:133–139. 10.1007/BF00044064
- Rayburn AP, Wiegand T. 2012. Individual species-area relationships and spatial patterns of species diversity in a Great Basin, semi-arid shrubland. Ecography. 35:341–347. 10.1111/j.1600-0587.2011.07058.x
- Rebertus AJ, Williamson GB, Moser EB. 1989. Fire-induced changes in Quercus laevis spatial pattern in Florida sandhills. J Ecol. 77:638–650. 10.2307/2260975
- Schenk HJ, Holzapfel C, Hamilton JG, Mahall BE. 2003. Spatial ecology of a small desert shrub on adjacent geological substrates. J Ecol. 91:383–395. 10.1046/j.1365-2745.2003.00782.x
- Schleicher J, Wiegand K, Ward D. 2011. Changes of woody plant interaction and spatial distribution between rocky and sandy soil areas in a semi-arid savanna, South Africa. J Arid Environ. 75:270–278. 10.1016/j.jaridenv.2010.10.003
- Schurr FM, Bossdorf O, Milton SJ, Schumacher J. 2004. Spatial pattern formation in semi-arid shrubland: a priori predicted versus observed pattern characteristics. Plant Ecol. 173:271–282. 10.1023/B:VEGE.0000029335.13948.87
- Sheng JH, Qiao YX, Liu HY. 2004. A study on the root system of Haloxylon Aammodendron (C.A. Mey.) Bunge. Chin Acta Agrestia Sin. 12:91–94.
- Skarpe C. 1991. Spatial patterns and dynamics of woody vegetation in an arid savanna. J Veg Sci. 2:565–572. 10.2307/3236039
- Song YY, Li YY, Zhang WH. 2010. Analysis of spatial pattern and spatial association of Haloxylon ammodendron population in different developmental stages. Chin Acta Ecologica Sin. 30:4317–4327.
- Sri-Ngernyuang K, Kanzaki M, Mizuno T, Noguchi H, Teejuntuk S, Sungpalee C, Hara M, Yamakura T, Sahunalu P, Dhanmanonda P, Bunyavejchewin S. 2003. Habitat differentiation of Lauraceae species in a tropical lower montane forest in northern Thailand. Ecol Res. 18:1–14. 10.1046/j.1440-1703.2003.00539.x
- Stoyan D, Penttinen A. 2000. Recent applications of point process methods in forestry statistics. Stat Sci. 15:61–78. 10.1214/ss/1009212674
- Su YZ, Zhao WZ, Su PX, Zhang ZH, Wang T, Ram R. 2007. Ecological effects of desertification control and desertified land reclamation in an oasis–desert ecotone in an arid region: a case study in Hexi Corridor, northwest China. Ecol Eng. 29:117–124. 10.1016/j.ecoleng.2005.10.015
- Tilman D, Pacala SW. 1993. The maintenance of species richness in plant communities. In: Ricklefs RE, Schluter D, editors. Species diversity in ecological communities: historical and geographical perspectives. Chicago: University of Chicago Press; p. 13–25.
- Tirado R, Pugnaire FI. 2003. Shrub spatial aggregation and consequences for reproductive success. Oecologia. 136:296–301. 10.1007/s00442-003-1264-x
- Wang Y, Yang X, Shi Z. 2013. The formation of the patterns of desert shrub communities on the western Ordos Plateau, China: the roles of seed dispersal and sand burial. PLoS One. 8:e69970. 10.1371/journal.pone.0069970
- Whitford WG. 2003. Ecology of desert systems. J Mammal. 84:1122–1124. 10.1644/1545-1542(2003)084%3C1122:EODS%3E2.0.CO;2
- Wiegand T, Moloney KA. 2004. Rings, circles and null-models for point pattern analysis in ecology. Oikos. 104:209–229. 10.1111/j.0030-1299.2004.12497.x
- Xu DM, Xu XZ, Xie YZ, Wang K. 2012. Dynamics of sandy desertification and detection of sandy land/steppe boundary: vegetation and soil properties. Pol J Ecol. 60:251–263.
- Yamada T, Tomita A, Itoh A, Yamakura T, Ohkubo T, Kanzaki M, Tan S, Ashton PS. 2006. Habitat associations of Sterculiaceae trees in a Bornean rain forest plot. J Veg Sci. 17:559–566.
- Yu F, Chen Y, Dong M. 2001. Clonal integration enhances survival and performance of Potentilla anserina, suffering from partial sand burial on Ordos plateau, China. Evol Ecol. 15:303–318. 10.1023/A:1016032831038
- Zhang Z-H, Hu G, Zhu J-D, Luo D-H, Ni J. 2010. Spatial patterns and interspecific associations of dominant tree species in two old-growth karst forests, SW China. Ecol Res. 25:1151–1160. 10.1007/s11284-010-0740-0
- Zhang Z, Hu G, Zhu J, Ni J. 2013. Aggregated spatial distributions of species in a subtropical karst forest, southwestern China. J Plant Ecol. 6:131–140. 10.1093/jpe/rts027
- Zhang J, Maun MA. 1990. Effects of sand burial on seed germination, seedling emergence, survival, and growth of Agropyron psammophilum. Can J Bot. 68:304–310. 10.1139/b90-041
- Zou T, Li Y, Xu H, Xu G-Q. 2010. Responses to precipitation treatment for Haloxylon ammodendron growing on contrasting textured soils. Ecol Res. 25:185–194. 10.1007/s11284-009-0642-1