
Abstract
The spatial pattern of a tree species is an important characteristic of plant communities, providing critical information to explain species coexistence. The spatial distribution and association of four different successional species were analyzed among different life-history stages in an old-temperate forest. Significant aggregation patterns were found, and the degree of aggregation decreased with the scales and life-history stages. Significant interspecific spatial associations were detected. In comparing the relationships among the different life-history stages, positive associations were found at small scales in all of the juvenile species pairs. In the adult stage, negative associations were detected in coniferous vs. deciduous species pairs, while the deciduous species pairs, which have identical resource requirements, showed a positive association in this study. The coniferous species pairs showed a positive association at small scales. We infer that seed dispersal, competitive ability, or the requirement for specific topographic and light environments may contribute to the coexistence of these species.
Introduction
The analysis of the spatial patterns of tree species can greatly facilitate the understanding of ecological processes underlying the development of forest stands (Condit et al. Citation2000; He & Duncan Citation2000; Druckenbrod et al. Citation2005; Martínez et al. Citation2013; Li et al. Citation2014). The distribution patterns of individual plants and their relationship during various developmental phases are a result of long-term interaction between the plant community and the environment, which also reflect the rationality of the population and community structure (Nathan Citation2006).
Complex and stable forest communities are formed by the replacement and development of different plant communities. Different tree species alternations and composition changes take place during the forest successional process. Pioneer trees may capture resources in disturbance openings to a sufficient extent that they prevent late-successional species from recruiting to the canopy by lowering the growth rate or survivorship of these species in the understory (He & Duncan Citation2000). They may experience relatively intense interspecific competition that limits their coexistence (Mooney et al. Citation2008). However, in both tropical plant communities with diverse species and in temperate plant communities with relatively few species, different successional species coexist. It is therefore important to ask the following questions: (1) How do these different successional species coexist in the same communities? (2) Which stage (saplings, juveniles, adult trees, and canopy trees) of the pioneer species will be replaced by the late-successional species? These questions have long fascinated ecologists and evolutionary biologists.
Comparative studies of different successional species could reveal the species distribution in terms of their particular habitat requirements (Queenborough et al. Citation2007). However, most field studies have indeed failed to consider different successional species in an old-growth temperate forest. Recent studies on spatial patterns have compared congeneric species. For example, Toft and Fraizer (Citation2003) present long-term data (1985–2001) on two nearby populations of the perennial shrub Chrysothamnus nauseosus ssp. consimilis to study spatial dispersion and density dependence in sand-dune ecosystems near Mono Lake, California. Zhang et al. (Citation2010) compared the population structure and the spatial patterns of six co-occurring species of Acer (maple) in a large-scale 25-ha plot of old-growth temperate forest with the aim of gaining insight into their coexistence. Queenborough et al. (Citation2007) compared 16 species of Myristicaceae in a 50-ha permanent plot of tropical rain forest in Amazonian Ecuador and found no evidence that the partitioning of physical habitats could explain the coexistence of all 16 closely related species. Mooney et al. (Citation2008) compared two Apbis species in northeastern North America and found that congeners of radically different competitive abilities can coexist on a single resource and that ecological factors other than resource partitioning play important roles in promoting niche partitioning and biodiversity.
There is a potential problem in that the spatial patterns of trees and their interactions can be confounded with or masked by variation in other factors. Although pioneer and non-pioneer tree species differ in distribution and performance at various habitats (Clark et al. Citation1993), few studies have considered the variation in the detailed spatial data of species distributions, and there is a lack of understanding of how these patterns are generated and of the diverse intra- and interspecies relationships among different successional species. In this context, it is interesting to assess whether the different resource requirement can cause shifts in the composition and spatial pattern of the different successional forest vegetation species, providing an important supplementary study on population dynamics.
The mixed broad-leaved Korean pine (Pinus koraiensis) forest is the dominant vegetation type in northeastern China. It is well known for high species richness and particular species composition in temperate forests (Xu et al. Citation2001; Hao et al. Citation2007; Zhang et al. Citation2007; Piao et al. Citation2013). Spatial pattern analyses of these trees have been performed in the temperate zone (Guo et al. Citation1998; Xu et al. Citation2001; Zhang et al. Citation2007). Xu et al. (Citation2001) examined the natural regeneration pattern of P. koraiensis and its relation with the forest composition and structure. Guo et al. (Citation1998) studied the formation, distribution patterns, and regeneration of a Korean pine mixed forest. Lee et al. (Citation2012) reported the spatial pattern and association of tree species in a mixed Abies holophylla broad-leaved deciduous forest in Odaesan National Park in Korea. Zhang et al. (Citation2007) found that clustered spatial distributions were often typical in naturally regenerated stands, while random distributions were typical in large diameter at breast height (DBH) classes. Hao et al. (Citation2007) reported that it is essential to analyze the stand structure and spatial associations among tree height classes in temperate forests. These studies drew different conclusions because they were performed in different study areas under various local climatic conditions, at different scales, and using different analyses. There are few studies linking the spatial patterns with processes in these forests, especially of the spatial patterns and spatial associations among different successional species. In this study, we compared the distribution, spatial patterns, and interactions of four different successional species (dominant species [P. koraiensis], dominant companion species [Abies nephrolepis and Tilia amurensis], and pioneer species [Betula costata]) in a 9-ha mixed broad-leaved Korean pine forest with the aim of gaining insight into their coexistence and development trends. The following questions were addressed: (1) Are there significant differences in the population structure and spatial patterns among the four major species in the forest? (2) How do the spatial patterns and associations change with the scale and size class? (3) Does strong competition exist for resources and space among these species?
Methods
Study site
The study site is located in the Liangshui National Reserve (47°10′50″N, 128°53′20″E), Heilongjiang Province, northeastern China. The reserve has been spared from logging and other major human disturbances since 1952, was established in 1980, and joined China's Man and the Biosphere Reserve Network in September 1997. It was promoted to a national nature reserve with the approval of the Chinese State Council in December 1997 to protect the old-growth mixed broad-leaved Korean pine (P. koraiensis) forest ecosystem. The reserve is approximately 12,133 ha and is characterized by a rolling mountainous terrain with elevations ranging from 280 m to 707 m. The soil is classified as dark-brown forest soil. The mean annual precipitation is 676 mm with 78% relative humidity and an annual evaporation of 805 mm. The mean annual temperature is −0.3°C, with a lowest mean of −6.6°C and a highest mean of 7.5°C. The average age of the overstory trees is approximately 200 years. The main canopy species include P. koraiensis, T. amurensis, T. mandshurica, B. costata, A. nephrolepis, Fraxinus mandshurica, and Acer mono.
Data collection and analysis
A 9-ha (300 m × 300 m) tree stem-mapped plot was established in a mature mixed broad-leaved Korean pine forest, which is the dominant vegetation type in the region in terms of species composition and stand structure (Piao et al. Citation2013). The mean age of the overstory trees is approximately 300 years. A plot in the core zone of the reserve was selected to avoid the influence of human activities. Following the field protocol of the Center for Tropical Forest Science of the Smithsonian Institution, all of the woody stems that were ≥2 cm DBH in the plot were mapped, measured, identified by species, and tagged in 2005. In 2010, we re-censused the plot and additionally included woody stems 1–2 cm that were DBH. In the 2010 census, we documented 21,775 free-standing live individuals that were ≥1 cm DBH belonging to18 families, 32 genera, and 46 species. In this paper, we used data on live trees that were ≥1 cm DBH from the 2010 census.
Spatial pattern analysis
We used Ripley's K function and the pair-correlation function (Ripley Citation1977; Diggle Citation2003) to examine the tree spatial arrangements. Because these methods consider the distances between all of the pairs of points (trees), more detailed analyses of the interactions among trees, both within a class of points as well as between separate point populations, are commonly applied to detect the spatial arrangement of individuals within communities and to generate hypotheses regarding the underlying processes that control the observed patterns. In this study, we used the pair-correlation function g(r) to determine whether the distribution of the four populations was random, aggregated, or regular; the spatial scales at which these patterns occurred; and the spatial associations among these patterns. The pair-correlation function, which is the derivative of Ripley's popular K function, replaces the circles in Ripley's K function with rings and uses the mean number of neighbors in a ring of radius r and the ring width around an individual, thus isolating specific distance classes (Wiegand & Moloney Citation2004). With an increasing radius, analyses using Ripley's K function, which includes all of the information in the circle, fail to distinguish between the effects at large scales and those at small scales, as this approach is a cumulative measure, with each progressively larger scale including the information from all of the smaller scales (Condit et al. Citation2000; Wiegand & Moloney Citation2004).
In contrast, the pair-correlation function, which characterizes patterns based on the frequency of points co-occurring at a given distance, can be used to easily and intuitively analyze the spatial patterns that were derived from ecological processes (Wiegand & Moloney Citation2004). Similar to Ripley's K function, the pair-correlation function g(r) includes both univariate and bivariate statistics. The univariate statistics are used to analyze the spatial pattern of a single object, while the bivariate statistics are used to analyze the spatial association of two objects. For a univariate point pattern, g(r) > 1 indicates that the points are aggregated at a given distance r, while g(r) < 1 indicates that they are regularly dispersed. For a bivariate point pattern, g(r) > 1 indicates a positive interaction between the two patterns at a given distance r, while g(r) < 1 indicates a spatial segregation or repulsion between them at distance r.
In our study, univariate statistics were used to analyze the spatial patterns of the four species, and bivariate statistics were used to analyze the interspecies spatial associations among different species. The spatial patterns and association of trees at different growth stages from juveniles to adults were evaluated by dividing individuals of a species according to diameter (DBH) size based on the assumption that younger trees have smaller diameters than those of adult trees. Three size classes were established: DBH-class I (juveniles, 1 cm ≤ DBH < 7.5 cm), DBH-class II (adult trees, 7.5 cm ≤ DBH < 22.5 cm), and DBH-class III (canopy trees, DBH ≥ 22.5 cm). The complete spatial randomness (CSR) null model was used to reveal significant uni- and bivariate second-order interactions. For the uni- and bivariate statistics, we constructed the intensity function based on the distribution of the four species and a spatial resolution of 1 m.
A significant departure from the null hypothesis of the CSR process was evaluated using the fifth lowest and the fifth highest value of 99 Monte Carlo simulations of the null model to generate approximately 99% simulation envelopes. We used a grid size of 4 m2 to analyze the plant interactions at spatial scales from 0 m to 30 m. This is a fine resolution compared to the 300 m × 300 m size of the study plot and is sufficient to capture detailed variation in the pair-correlation function over the range of scales where we expect significant effects up to 30 m. We used a goodness-of-fit (GoF) test to assess significant departures from the null model. The p value of the observed pattern is calculated as follows:
Results
Population structure
The stand was an old-growth forest with a reversed J-shaped distribution of tree diameters when pooled for all species, and 88.41% of the individuals were at the DBH class of 1–20 cm (a). The abundances of the four species ranged from 667 individuals of B. costata to 1223 individuals of P. koraiensis (). The basal area of P. koraiensis was significantly larger than those of the other three species.
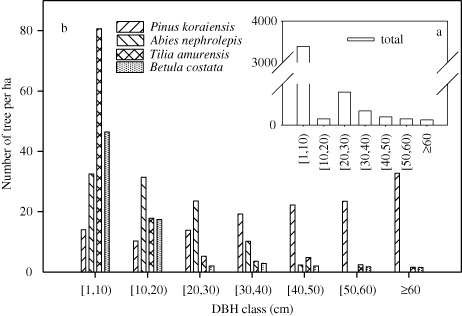
Table 1. Population structure of four species in a 9-ha old-growth temperate forest.
The four species showed great variability in abundance at various DBH classes (b). P. koraiensis was present in all of the DBH strata and showed a J-shaped distribution of diameters with more individuals in larger DBH classes (≥60 cm). A. nephrolepis, T. amurensis, and B. costata had similar, distinct L-shaped distributions with a high concentration of smaller, younger trees, indicating abundant regeneration and an adequate number of seedlings and saplings under the forest canopy.
Spatial patterns
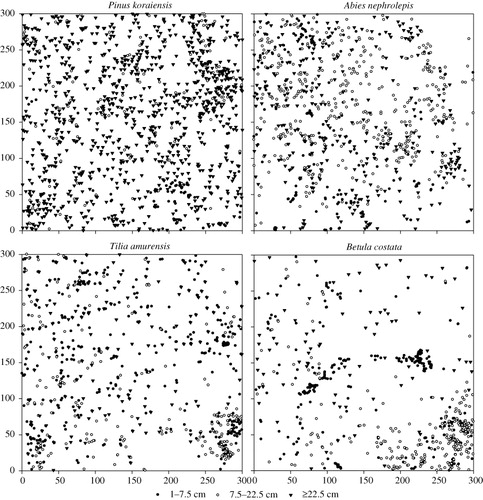
The four species showed significant aggregation ( and ). The GoF test also revealed a significant departure from the CSR null model. The four species showed strong aggregation and a decreasing degree of aggregation with scaling up () corresponding to the spatial distribution of these species in the plot (). P. koraiensis, A. nephrolepis, and T. amurensis were distributed widely over nearly the entire plot, whereas few individuals of B. costata were found in the east corner of the plot. The aggregation intensity of the four species decreased with the DBH class.
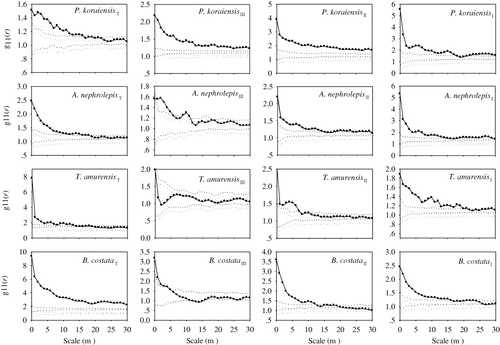
The four species are shown in had different spatial patterns. The three DBH classes of P. koraiensis showed significant aggregation at scales of 0–30 m. For juveniles and adult trees, A. nephrolepis, T. amurensis, and B. costata showed different degrees of aggregation at scales of 0–30 m. For canopy trees, A. nephrolepis showed random distribution at scales of 12–17 m and aggregation at other scales, T. amurensis showed random distribution at scales of 0–30 m, and B. costata showed aggregation at scales of 0–7 m and random distribution at scales of >7 m.
Spatial associations
Using bivariate statistics, we performed a total of six bivariate point pattern analyses for all species pairs of the four species (). The GoF test revealed positive associations (attraction) for two of six pairs at different scales. B. costata showed a significant positive association with T. amurensis at scales of 0–30 m, while T. amurensis showed a significant positive association with P. koraiensis at scales of 0–13 m. Negative associations (repulsion) were found for two of six pairs at different scales. B. costata and P. koraiensis, and B. costata and A. nephrolepis were associated negatively at scales of 0–30 m. A. nephrolepis and P. koraiensis, and T. amurensis and A. nephrolepis pairs showed no associations at scales of 0–30 m.

We also analyzed the spatial associations among the individuals of each species in three size classes (). When comparing the spatial associations among juveniles of different species, the GoF test detected significant positive associations for all six species pairs at different scales. A. nephrolepis and T. amurensis, and B. costata and T. amurensis showed a significant positive association at all scales, while A. nephrolepis showed a significant positive association with P. koraiensis at scales of 0–10 m, and T. amurensis showed a significant positive association with P. koraiensis at scales of 0–2 m. B. costata and A. nephrolepis showed a significant positive association at scales of 0–8 m, while B. costata showed a significant positive association with P. koraiensis at scales of <6 m and >27 m. When comparing the spatial associations among adult trees of different species, the GoF test detected significant positive associations for two of six species pairs at different scales. B. costata and T. amurensis showed a significant positive association at all scales, while A. nephrolepis showed a significant positive association with P. koraiensis at scales of 0–13 m. Negative associations were found for four of six pairs. B. costata and P. koraiensis, B. costata and A. nephrolepis, and A. nephrolepis and T. amurensis were negatively associated at scales of 0–30 m, while T. amurensis showed a significant negative association with P. koraiensis at scales of 15–19 m. When comparing the spatial associations among the canopy trees of different species, negative associations were found for two of six pairs. A. nephrolepis and P. koraiensis were negatively associated at scales of 8–10 m, while B. costata and P. koraiensis were associated negatively at scales of 12–15 m. There was no significant relationship between the other four species pairs. The spatial associations weakened with increases in the DBH class.
Discussion
The distribution and spatial pattern of trees in a stand have important implications for how species interact with each other and their environments (Condit et al. Citation2000; Harms et al. Citation2001). Aggregated spatial distributions are commonly observed in naturally regenerated forests (Condit et al. Citation2000). Rather than being randomly or uniformly distributed, the distributions of most species are aggregated in one or more spatial distributions, and the distribution of a species may be aggregated in places where the resources and environmental conditions are most beneficial for growth and reproduction. This study provides further evidence of clumping for four successional species in a 9-ha plot old-growth temperate forest, with the degree of aggregation decreasing with scales and the DBH class. This result is in accordance with the findings of many other studies (Harms et al. Citation2001; Zhang et al. Citation2010; Liu & Jin Citation2012).
The spatial pattern distribution of tree species in different developmental stages is due to the self-thinning process (Piao et al. Citation2013; Cheng et al. Citation2014) and environmental change in the forest community (Harms et al. Citation2001). Growth and development at different stages are controlled by one or more ecological factors that cause different aggregation distributions. With the increasing age of trees, the intra- and interspecific competition increases, causing in the distribution pattern. In the period of tree growth, plenty of juveniles died, a small number of juveniles grew to adult trees that were balance during canopy tree stages, and the distribution of canopy trees was mainly subjected to the death of individuals (Clark et al. Citation1993; Lucci & Mazzafera Citation2009). The change in the assemblage intensity is a survival strategy or adaptation mechanism of populations (Condit et al. Citation2000).
Aggregated distribution patterns appeared due to characteristics of some species and may therefore limit the negative effects of a competitively superior species on inferior species, allowing the inferior species to survive and persist in the community (Piao et al. Citation2013). In this study, limited seed dispersal is also considered the most likely explanation. In plants, as in other sessile organisms, dispersal is mostly passive: seeds or other diaspores (dispersal units) are transported away from the parent plant by vectors such as animals, wind, and water (Damgaard et al. Citation2005; Nathan Citation2006; Myster Citation2013). The coniferous species P. koraiensis disperses its seeds via animals (e.g. squirrels and nutcrackers). Lu et al. (Citation2001) analyzed the foraging and dispersal of Korean pine seed by animals in a broad-leaved Korean pine forest in China and found that nutcrackers can carry seeds as far as 4 km, with a cache size of 2.7 cm, and a cache depth of 2.2 cm; caches occur in several habitats, and re-foraging behavior can be easily found during winter and early spring. Squirrels generally carry seeds no farther than 500 m, with a cache size of 2.9 cm and a cache depth of 2.1 cm, and caches mostly occur in mixed forests. The re-foraging of seeds is not common, indicating the limited seed dispersal for P. koraiensis. For the coniferous species A. nephrolepis and deciduous species T. amurensis, seed dispersal occurs via by gravity; many mature seeds fall around their mother trees, with 50% being immature and empty falling seeds (Liu & Jin Citation2008; Lee et al. Citation2012). The seeds of the deciduous B. costata are small with a high fruiting rate, are only slightly affected by gravity, disperse far from their mother trees, and can grow collectively in a well-lit forest gap or forest edge, which can promote aggregation. Habitat variables such as topography also make a limited contribution to the aggregate distribution of the four species. Recent evidence suggests that diverse site conditions contribute to the maintenance of species richness (Clark et al. Citation1993; Harms et al. Citation2001; Yasuhiro et al. Citation2004). Topography is a heterogeneous factor that could affect the structure and dynamics of communication. In the present case, topography was certainly the main factor affecting the distribution of the four tree species. Liu and Jin (Citation2012) studied the spatial distribution of major species in a 9-ha mixed broad-leaved Korean pine forest and found that the densities of P. koraiensis and T. amurensis increased with an increasing topographic position. P. koraiensis is an evergreen needle species with shallow roots that lives or on the hillside or ridge with moist but well-drained soil. T. amurensis is a shade-tolerant plant with deep roots and is usually found growing in valleys. B. costata is usually found growing on slopes and is seldom found in valleys. The increased water potential of the slopes may impose an ecological filter that prevents A. nephrolepis from growing on the slopes; therefore, A. nephrolepis is usually found growing in valleys due to greater water availability. Species distributions have been associated with variations in the ground water regime and light conditions based on inferences from the topography, different groups of topographic positions, the aspect, and the slope degree, reflecting multidimensional environmental factors (Harms et al. Citation2001). Higher live stand densities on ridges and sites with higher slope degree possibly originate from a combination of deep soils and reduced canopy disturbance. Future studies on the comprehensive action of topography factors, such as the comprehensive action of light, temperature, and soil-moisture, will sufficiently and fully explain the differences in the plant distribution. Interspecific competition should be much stronger among species (Kostrzewa Citation1991; Zhang et al. Citation2010; Cao et al. Citation2013). In this study, we found clear evidence for interspecific competition among the four species. In comparing the relationships among the different size classes, the GoF test detected significant associations. For the total species, the GoF test revealed a significant negative association for two of six pairs, indicating strong resource competition. Among the four species pairs with negative associations, there were two pairs that showed an association among P. koraiensis and another species. P. koraiensis (intolerant species) is the dominant species in broad-leaved Korean pine forests, and is fond of shade during the juveniles stage (Xu et al. Citation2001). The growth speed of P. koraiensis is slow during the preadult period but fast during the adult period. The deciduous species B. costata is fond of light and shade during the juvenile stage. The above characteristics may cause the strong associations of P. koraiensis and B. costata. A. nephrolepis is most likely a shade-tolerant species, although the relationship between A. nephrolepis and the other three species among different size classes reflects a different favorite habitat. The spatial associations of P. koraiensis and T. amurensis were positive at scales of <13 m. This result was different from the study of Zhang et al. (Citation2007), they found a repulsion between the second growth of P. koraiensis and T. amurensis. This difference was relevant to the local climatic condition. Eco-environmental changes such as the light conditions of forest canopy form heterogeneity under a closed canopy, thereby affecting the forest structure, population distribution pattern, and regeneration dynamics of the understory saplings (Whitmore Citation1989; Clark et al. Citation1993; Manoylov Citation2009). There are many gaps distributed throughout our plot that provide light for the light-demanding deciduous species (Hytteborn & Verwijst Citation2014). Runkle (Citation1985) suggested that gap size is a factor in gap colonization: small gaps favor shade-tolerant species, while large gaps favor shade-intolerant species. The two deciduous species T. amurensis and B. costata, which have identical resource requirements, showed a positive association that was strong at all scales. Consistent with the gap distribution in our plot, the gaps that were <300 m2 represented 90% and 61% of the total gap number and gap area, respectively (Liu & Jin Citation2012).
The degree of association deceased with the scales. This pattern was not observed between the two coniferous species because these species do not respond differently to gap and shade sites. The spatial associations were related to the development stages (Condit et al. Citation2000). The spatial association weakened with the DBH class, causing the self-thinning process of intraspecific species during the adult period, and creating favorable conditions for the invasion and settlement of other species, contributing to species coexistence in broad-leaved Korean pine forests.
In this study, the abundance of the four species varied from 667 to 1223 individuals in the study plot. Based on a comparison of the population structure, spatial patterns, and spatial associations, we infer differences among these species in terms of seed dispersal ability, competitive ability, and the requirements for topography and light environments. In summary, our comparative analysis of four species at the forest scale revealed both similarities and differences in the population structure and spatial patterns. Although the influences of the canopy gap dynamics, topography and life strategy approach on the distribution of these species have been clarified, there is no evidence that these factors can explain the coexistence of all of these species. Explaining the coexistence of these species remains a longstanding challenge. The reasons for this coexistence will become clearer with further study of the relationships between species and other ecological factors (e.g. temperature, moisture and soil conditions, and disturbance history).
Acknowledgments
This study was financially supported by the National Natural Science Foundation of China [No. 31270473]. Thanks to Guojun Lin and Qingsong Yang for providing helpful suggestions and critical comments on the manuscript. We also thank Dr T. Wiegand for use of the Programita software, and many fieldworkers for their contributions to the establishment and census of the Liangshui forest dynamics plot (FDP).
Related Research Data
References
- Cao Y, Wang T, Xiao Y, Zhou B. 2013. The interspecific competition between Humulus scandens and alternanthera philoxeroides. J Plant Interact. 9:194–199.
- Cheng X, Han H, Kang F, Song Y, Liu K. 2014. Point pattern analysis of different life stages of Quercus liaotungensis in Lingkong Mountain, Shanxi Province, China. J Plant Interact. 9:233–240.
- Clark DB, Clark DA, Rich PM. 1993. Comparative analysis of microhabitat utilization by saplings of nine tree species in Neotropical rain forest. Biotropica. 24:397–407. 10.2307/2388863
- Condit R, Ashton PS, Baker P, Bunyavejchewin S, Gunatilleke S, Gunatilleke N, Hubbell SP, Foster RB, Itoh A, LaFrankie JV, et al. 2000. Spatial patterns in the distribution of tropical tree species. Science. 288:1414–1418. 10.1126/science.288.5470.1414
- Damgaard C, Borksted B, Kjær C. 2005. Herbivory and plant community dynamics: Competitive interactions between an insect-resistant and an insect-susceptible Arabidopsis thaliana genotype. J Plant Interact. 1:83–91. 10.1080/17429140500364527
- Diggle PJ. 2003. Statistical analysis of point processes. London: Academic Press.
- Druckenbrod DL, Shugart HH, Davies I. 2005. Spatial pattern and process in forest stands within the Virginia piedmont. J Veg Sci. 16:37–48. 10.1111/j.1654-1103.2005.tb02336.x
- Guo QX, Ge JP, Ma CH, Li CR. 1998. Gap regime and regeneration of Pinus koraiensis in Korean pine-mixed forest at Mt. Changbai. J Northeast For Uni. 26:4–7.
- Hao Z, Zhang J, Song B, Ye J, Li B. 2007. Vertical structure and spatial associations of dominant tree species in an old-growth temperate forest. For Ecol Manage. 252:1–11. 10.1016/j.foreco.2007.06.026
- Harms KE, Condit R, Hubbell SP, Foster RB. 2001. Habitat associations of trees and shrubs in a 50-ha neotropical forest plot. J Ecol. 89:947–959. 10.1111/j.1365-2745.2001.00615.x
- He F, Duncan RP. 2000. Density-dependent effects on tree survival in an old-growth Douglas fir forest. J Ecol. 88:676–688. 10.1046/j.1365-2745.2000.00482.x
- Hytteborn H, Verwijst T. 2014. Small-scale disturbance and stand structure dynamics in an old-growth Picea abies forest over 54 yr in central Sweden. J Veg Sci. 25:100–112. 10.1111/jvs.12057
- Kostrzewa A. 1991. Interspecific interference competition in three European raptor species. J Plant Interact. 3:127–143.
- Lee K, Kim S, Shin Y, Choung Y. 2012. Spatial pattern and association of tree species in a mixed Abies holophylla-broadleaved deciduous forest in Odaesan national park. J Plant Biol. 55:242–250. 10.1007/s12374-011-0338-2
- Li Y, Hui G, Zhao Z, Hu Y, Ye S. 2014. Spatial structural characteristics of three hardwood species in Korean pine broad-leaved forest–validating the bivariate distribution of structural parameters from the point of tree population. For Ecol Manage. 314:17–25. 10.1016/j.foreco.2013.11.012
- Liu S, Jin GZ. 2008. Spatiotemporal dynamics of seed rain in a mixed broadleaved-Korean pine forest in Xiaoxing'an Mountains, China. Acta Ecol Sin. 28:5731–5740.
- Liu YY, Jin GZ. 2012. Spatial distribution patterns and dynamics of four dominant tree species in a typical mixed broadleaved-Korean pine forest. In: Ma KP, editor. Advances in biodiversity conservation and research in China IX. Beijing: China Meteorological Press; p. 278–296.
- Loosmore NB, Ford ED. 2006. Statistical inference using the G or K point pattern spatial statistics. Ecology. 87:1925–1931. 10.1890/0012-9658(2006)87[1925:SIUTGO]2.0.CO;2
- Lu CH, Liu B, Wu J. 2001. Foraging and dispersing of Korean pine seed by animals in broad-leaved Korean pine forest. J Northeast For Uni. 29:96–98.
- Lucci N, Mazzafera P. 2009. Distribution of rutin in fava d'anta (Dimorphandra mollis) seedlings under stress. J Plant Interact. 4:203–208. 10.1080/17429140802707035
- Manoylov KM. 2009. Intra- and interspecific competition for nutrients and light in diatom cultures. J Plant Interact. 24:145–157.
- Martínez I, Taboada FG, Wiegand T, Obeso JR. 2013. Spatial patterns of seedling-adult associations in a temperate forest community. For Ecol Manage. 296:74–80. 10.1016/j.foreco.2013.02.005
- Mooney KA, Jones P, Agrawal AA. 2008. Coexisting congeners: demography, competition, and interactions with cardenolides for two milkweed-feeding aphids. Oikos. 117:450–458. 10.1111/j.2007.0030-1299.16284.x
- Myster RW. 2013. The role of seed predation in the maintenance of the cross timbers ecotone of Oklahoma, USA. J Plant Interact. 8:134–139. 10.1080/17429145.2012.707234
- Nathan R. 2006. Long-distance dispersal of plants. Science. 313:786–788. 10.1126/science.1124975
- Piao TF, Comita L, Jin GZ, Kim JH. 2013. The importance of density dependence in regulating plant populations by acting cross multiple life-history stages. Oecologia. 172:207–217. 10.1007/s00442-012-2481-y
- Queenborough SA, Burslem DFRP, Garwood NC, Valencia R. 2007. Habitat niche partitioning by 16 species of Myristicaceae in Amazonian Ecuador. Plant Ecol. 192:193–207. 10.1007/s11258-007-9328-3
- Ripley BD. 1977. Modeling spatial pattern. J Roy Stat Soc (Series B). 39:172–212.
- Runkle JR. 1985. Disturbance regimes in temperate forests. In: Pickett STA, White PS, editors. The ecology of natural disturbance and patch dynamics. New York (NY): Academic Press; p. 17–33.
- Toft CA, Fraizer T. 2003. Spatial dispersion and density dependence in a perennial desert shrub (Chrysothamnus nauseosus: Asteraceae). Ecol Mono. 73:605–624. 10.1890/02-4080
- Whitmore TC. 1989. Canopy gaps and the two major groups of forest trees. Ecology. 70:536–538. 10.2307/1940195
- Wiegand T, Moloney KA. 2004. Rings, circles, and null-models for point pattern analysis in ecology. Oikos. 104:209–229. 10.1111/j.0030-1299.2004.12497.x
- Xu ZB, Dai LM, Chen JQ, Wang Z, Dai HC, Li X. 2001. Natural regeneration condition in Pinus koraiensis broad-leaved mixed forest. Acta Ecol Sin. 21:1413–1420.
- Yasuhiro K, Hirofumi M, Kihachiro K. 2004. Effects of topographic heterogeneity on tree species richness and stand dynamics in a subtropical forest in Okinawa Island, southern Japan. J Ecol. 92:230–240. 10.1111/j.0022-0477.2004.00875.x
- Zhang J, Hao ZQ, Song B, Ye J, Li BH, Yao XL. 2007. Spatial distribution patterns and associations of Pinus koraiensis and Tilia amurensis in broad-leaved Korean pine mixed forest in Changbai Mountains. Chin J Appl Ecol. 18:1681–1687.
- Zhang J, Song B, Li B, Yea J, Wang XG, Hao ZQ. 2010. Spatial patterns and associations of six congeneric species in an old-growth temperate forest. Acta Oecologia. 36:29–38. 10.1080/02841860903246557