
Abstract
Plant mineral nutrients such as phosphorus may exert major control on crop responses to the rising atmospheric carbon dioxide (CO2) concentrations. To evaluate the growth, nutrient dynamics, and efficiency responses to CO2 and phosphorus nutrition, soybean (Glycine max (L.) Merr.) was grown in controlled environment growth chambers with sufficient (0.50 mM) and deficient (0.10 and 0.01 mM) phosphate (Pi) supply under ambient and elevated CO2 (aCO2, 400 and eCO2, 800 µmol mol−1, respectively). The CO2 × Pi interaction was detected for leaf area, leaf and stem dry weight, and total plant biomass. The severe decrease in plant biomass in Pi-deficient plants (10–76%) was associated with reduced leaf area and photosynthesis (Pnet). The degree of growth stimulation (0–55% total biomass) by eCO2 was dependent upon the severity of Pi deficiency and was closely associated with the increased phosphorus utilization efficiency. With the exception of leaf and root biomass, Pi deficiency decreased the biomass partitioning to other plant organs with the maximum decrease observed in seed weight (8–42%) across CO2 levels. The increased tissue nitrogen (N) concentration in Pi-deficient plants was accredited to the lower biomass and increased nutrient uptake due to the larger root to shoot ratio. The tissue P and N concentration tended to be lower at eCO2 versus aCO2 and did not appear to be the main cause of the lack of CO2 response of growth and Pnet under severe Pi deficiency. The leaf N/P ratio of >16 was detrimental to soybean growth. The tissue P concentration needed to attain the maximum productivity for biomass and seed yield tended to be higher at eCO2 versus aCO2. Therefore, the eCO2 is likely to increase the leaf critical P concentration for maximum biomass productivity and yield in soybean.
Introduction
Phosphate (Pi) is a major plant nutrient and essential for metabolic processes and plant growth. Phosphate deficiency in soil is a major constraint for crop production worldwide, and natural sources of Pi are limited (Vance et al. Citation2003; Cordell et al. Citation2009). The nutrient requirements of crops have increased due to use of modern high-yielding cultivars and are expected to be even higher under rising atmospheric carbon dioxide (CO2) concentration (Rogers et al. Citation1993; Lewis et al. Citation1994). In addition, the critical tissue nutrient concentration of phosphorus is likely to be higher in the CO2-enriched environment of the future (Conroy Citation1992; Rogers et al. Citation1993). The current atmospheric CO2 of approximately 400 µmol mol−1 is projected to double by the end of twenty-first century (IPCC Citation2007). Moreover, the degree of crop growth enhancement under CO2-enriched environment is expected to be greatly influenced by the nutrients availability such as Pi (Cure et al. Citation1988; Lenka & Lal Citation2012). Since, Pi deficiency and elevated CO2 (eCO2) often have opposite effects on crop growth and development, the interaction between these two factors might alter the overall crop response.
Soybean (Glycine max [L.] Merr.) is a vital source of protein and vegetable oil, and one of the most versatile and important crops grown globally (Conner et al. Citation2004). Phosphate deficiency reduces leaf area, photosynthesis, nitrogen fixation, yield, and seed quality of soybean (Israel & Ruffy Citation1988; Jaidee et al. Citation2013). In general, eCO2 enhances soybean growth mainly through increased leaf area, photosynthesis, and nutrient utilization efficiency (Cure et al. Citation1988; Prior et al. Citation1998). However, Pi deficiency exerts major control on the degree of plant response to eCO2. For example, an increase of over 80% in soybean dry mass observed under eCO2 was not observed when grown under Pi-deficient condition (Sa & Israel Citation1998). Similar results have also been observed in other legume crops (Lam et al. Citation2012). The decrease in growth response at eCO2 under nutrient deficiency might occur due to alteration in the plant morphology, and acclimation/down regulation of photosynthetic capacity (Qiu & Israel Citation1992; Sa & Israel Citation1998; Singh, Badgujar, Reddy, Fleisher & Bunce Citation2013). Phosphate deficiency and CO2-enriched environment might coexist under natural growing condition. Therefore, it is imperative to evaluate crop response to the interactive effect of these two factors.
Previous studies suggested that Pi deficiency and eCO2 may also alter the nutrient dynamics and biomass partitioning in the plant organs and affect the assimilation of other nutrients such as nitrogen (Israel et al. Citation1990; Rufty et al. Citation1991; Reddy & Zhao Citation2005; Fleisher et al. Citation2012; Singh, Badgujar, Reddy, Fleisher & Timlin Citation2013). Using isotopic N sources (15N), Rufty et al. (Citation1993) reported that Pi deficiency increased the root dry weight and decreased the rate of nitrate uptake while accumulating relatively more 15N in the roots. Singh, Badgujar, Reddy, Fleisher and Timlin (Citation2013) reported increased sensitivity of cotton growth and photosynthesis to Pi deficiency in CO2-enriched environment. In the same study, Pi deficiency tended to increase plant tissue N concentration whereas eCO2 exhibited an opposite effect (Singh, Badgujar, Reddy, Fleisher & Timlin Citation2013). Therefore, the combined effect of these two factors is uncertain on plant growth and development.
Soybean plants are sensitive to Pi availability due to the direct involvement of Pi in carbon and nitrogen metabolism (Lauer, Pallardy, et al. Citation1989; Rufty et al. Citation1993). Soybean grown under low nutrient conditions produced fewer flowers, pods, and seeds and exhibited increased flower abortion and pod senescence (Sionit Citation1983). Phosphate deficiency decreased soybean biomass, photosynthesis, and stomatal conductance and increased leaf thickness in 30-day old plants (Qiu & Israel Citation1992). Elevated CO2 increased the soybean seed yield by increasing the number of pods and seeds rather than seed size (Crafts-Brandner Citation1992b). Soybean responds to the external Pi supply under field conditions by increasing growth, pod number, and seed yield (Jaidee et al. Citation2013). The magnitude and direction of soybean response to Pi nutrition may be altered when grown under CO2-enriched environment. In addition, the positive effect of eCO2 on plant growth may be expected even under nutrient stress condition due to increased carbohydrate supply which may aid the energy demand of the stressed plants (Ahmed et al. Citation1993; Baker & Allen Citation1993; Singh, Badgujar, Reddy, Fleisher & Bunce Citation2013). Prior studies with soybean often have considered Pi nutrition or eCO2 separately and investigations on the combination of these two factors are limited (Cure et al. Citation1988; Israel et al. Citation1990). The objective of this study was to determine the effect of Pi nutrition on soybean growth, allocation of biomass and nutrients, nutrient efficiency, and their relationship with the tissue phosphorus concentration under ambient (aCO2) and eCO2 growing conditions.
Materials and methods
Growth and experimental conditions
The experiment was conducted at USDA-ARS facility in Beltsville, MD, USA using controlled environment growth chambers (EGC Corp., Chagrin Falls, OH, USA). Soybean (cv. Spencer, indeterminate) seeds (five seeds pot−1) were planted in 20 pots (volume 7.6 L) filled with washed concrete sand in each growth chambers. Pots were thinned to one plant per pot at eight days after planting (DAP). Plants were watered with full strength Hoagland's nutrient solution (Hewitt Citation1952) from emergence (4 DAP) to 12 DAP. Thereafter the treatments were initiated in factorial combination of two levels (ambient, aCO2 400 µmol mol−1 and elevated, eCO2 800 µmol mol−1) of CO2 and three levels of phosphate (0.5, 0.10, and 0.01 mM Pi) in modified Hoagland's nutrient solution. The nutrient solution was applied to flushed (300–350 mL) four to six times during the day. The pots were fully flushed weekly with de-ionized water. At this stage, there were no statistical differences between chambers (P > 0.90) for plant height (PH) and number of leaves plant−1. Experiment was replicated twice over time (repeated) using the same six chambers and lasted 110 days each. Pots were rotated periodically within each chamber to minimize effect of within-chamber heterogeneity. The CO2 treatments were also rotated between the replications for each Pi level to minimize the potential chamber effect across growth CO2.
The daytime temperature and light was initiated at 6:00 h. The light as photosynthetically active radiation (PAR) of 900 µmol m−2 s−1 at plant canopy was supplied following seedling emergence during the day period using a combination of metal halide and high-pressure sodium lamps. The PAR at the plant canopy was monitored using a LI-COR Quantum Sensor connected to a LI-1000 data Logger (LI-COR Inc., Lincoln, NE, USA) at multiple locations within each chamber on alternate days and adjusted to the mean value of 900 ± 15 µmol m−2 s−1 using controllable ballasts (Osram Sylvania, MA, USA). A 28/22°C day/night (12-h/12-h) air temperature was maintained within ±0.15°C in the growth chambers during the experiment. Injection of either CO2 or CO2-free air was determined using a TC-2 controller that monitored CO2 every three seconds measured from an absolute infrared gas analyzer (WMA-2 PP-systems, Haverhill, MA, USA). Relative humidity in growth chambers varied between 50% and 70% during the experiment among the chambers.
Growth and yield measurements
Plants were harvested at 30 (full bloom), 45 (pod development), and 110 (maturity) DAP (six, seven, and seven plants, respectively), and PH and number of main stem nodes (MSNs) were recorded. Plants were separated into roots, stems, leaves, and pods (45 and 110 DAP). The total leaf area (TLA) was measured only on 30-day and 45-day samples and the specific leaf weight (SLW, mg dry weight cm−2 leaf area) was determined. Roots were washed in clean water. All plant parts were dried to constant weight at 70°C. The seed and shell mass was determined from pods obtained at maturity after drying at 35°C in forced-ventilation air for 10 days.
Gas exchange measurements
These measurements were made several times between 25 and 65 DAP on the uppermost fully expanded leaves from the stem apex between 9:00 and 13:00 h. The leaf net photosynthesis (Pnet) was measured using a portable LI-COR 6400 photosynthetic system (LI-COR Inc., Lincoln, NE, USA). The measurements were taken when a steady state (around 4–6 min) was obtained, using a PAR of 1500 µmol m−2 s−1, the treatment's CO2 concentration, and a leaf temperature of 28°C. The relative humidity varied between 45% and 65%. The values of Pnet, stomatal conductance (gs), and intercellular (Ci) CO2 concentration were automatically computed from the instrument's software (details are available in LI-6400 Instruction Manual, version 5, Li-Cor Inc., Lincoln, NE, USA).
Tissue constituent measurements
The total chlorophyll concentration, tissue phosphorus (hereafter referred to as P to differentiate from phosphate treatments, Pi), and nitrogen (N) concentration were determined from the uppermost fully expanded leaves that were used for gas exchange measurements and in plant organs (leaves, i.e. included all the leaves from main stem and branches, abscised leaves separately, stems, roots, pods, shells, and seeds) at each sampling. The weighted whole-plant P and N concentrations were estimated as the sum of the products of dry mass of plant organs and their nutrient concentration divided by total biomass (TBM). Similarly, the weighted pod P and N concentration at the final harvest were estimated as the sum of the products of dry mass of seeds and shells and their nutrient concentrations divided by pod dry weight. Chlorophyll was extracted by placing two 0.95 cm2 leaf disks for each leaf in a vial containing 5 mL of dimethyl sulfoxide and incubating in the dark for 24 h. Thereafter, the absorbance of the supernatant was measured at 664 and 648 nm by using a UV-2101-PC spectrophotometer (Shimadzu Corp., Columbia, MD, USA). The total chlorophyll was estimated by using the equation of Lichtenthaler (Citation1987) and expressed on a leaf area basis (µg cm−2). The dry plant parts were ground using a Wiley Mill (Wiley® Mill, Thomas Scientific, NJ, USA) to pass through a 1 mm screen. The tissue P concentration was measured in the Agriculture Diagnostic Laboratory, University of Arkansas, Fayetteville AR. The N concentration was determined by combustion using a CHN-2000 (Carbon Hydrogen Nitrogen-2000: LECO Corporation, St. Joseph, MI, USA).
The P and N utilization efficiencies for biomass production (PUE and NUE) were estimated by dividing TBM by the whole-plant P or N concentration. The total P or N absorbed (mg plant−1) per unit of root biomass was used as an indicator of P or N uptake efficiency (PUpE or NUpE).
Data analysis
Statistical analyses were performed using SAS (SAS Enterprise Guide, 4.2, SAS Institute Inc., NC, USA). To test for the effect of treatments and their interaction, PROC MIXED with Kenward–Rogers (kr) adjustment of degrees of freedom was used for analysis of variance (ANOVA) using mean data from each repetition of the experiment. Treatments (Pi and CO2) and their interaction were considered as fixed effects, and repetition as a random effect. The normality assumptions were assessed using SharpioWilks statistics and log transformation was used, if necessary. Any heterogeneity in the data was corrected using the GROUP option in the REPEATED statement of the PROC MIXED procedure. The treatment comparisons were conducted by least square means (LSMEANS) procedure (at α = 0.05) when a main effect and/or the interaction was significant at P ≤ 0.05 with the letter grouping obtained using pdmix800 macro (Saxton Citation1998). The relationship of tissue P concentration with other parameters was established using linear or polynomial equations.
Results
Growth and seed parameters
The CO2 × Pi interaction was significant (P ≤ 0.05) for TLA and TBM (45 and 110 DAP; ). Phosphate treatment affected all growth and yield parameters (P ≤ 0.05) regardless of the harvest dates except for a few measurements date for PH and number of MSN. The CO2 treatment also affected these parameters (P ≤ 0.05) especially at the 110 DAP. Compared to the 0.50 mM Pi treatment, means averaged across the two low Pi treatments had decreased TLA (45–56%), TBM (15–53%), pod no. (27–50%), seed no. (47–51%), and seed yield (47–58%) across both CO2 levels ( and ). Moreover, the degree of stimulation by eCO2 decreased with the reduction in Pi supply leading to a smaller positive or even a negative change at the lowest Pi supply. For example, at 45 DAP in plants grown under eCO2, TLA increased by 22% and 15% at 0.50 and 0.10 mM Pi treatments, respectively. However, TLA decreased by 5% at 0.01 mM Pi at eCO2. Similar observations were also made for TBM and seed yield ( and ). The individual seed weight (g seed−1) was not affected by CO2.
Table 1. Effect of CO2 levels (µmol mol−1) and phosphate (Pi, mM) supply on PH (cm), number of MSNs plant−1, TLA (cm2 plant−1), TBM (g plant−1), number of pod plant−1 (Pod no.) and seed plant−1 (Seed no.), and individual seed weight (g seed−1) of soybean at three destructive harvests at 30, 45, and 110 (maturity) DAP.
Table 2. Effect of CO2 levels (µmol mol−1) and phosphate (Pi, mM) supply on biomass partitioning of soybean plants at 30, 45, and 110 (maturity) DAP.
Biomass partitioning
Among the plant parts, the CO2 × Pi interactions were only significant (P ≤ 0.05) for leaf and stem biomass especially at 45 and 110 DAP (). At 110 DAP, the main effects of Pi and CO2 were significant (P ≤ 0.05) for most of the plant organs. At 110 DAP, averaged two lower Pi treatments caused >30% decrease in biomass accumulation for all organs, except roots, as compared to the 0.5 mM Pi treatment for each CO2 level. When averaged across all Pi treatments, eCO2 increased biomass accumulation by more than 24% for all plant organs compared to aCO2; however, these increments were minimal at 0.01 mM Pi. Pi treatment did not affect (P > 0.05) the biomass partitioning to the leaves at 30 and 45 DAP; but it was significantly higher by 36–50% for aCO2 and by 6–21% for eCO2 at 110 DAP in the Pi-deficient plants. The changes in the fraction of stem biomass to the TBM depended upon the treatments and tended to either decrease with lower Pi supply or increase with eCO2. Regardless of the harvest dates, root fractions consistently increased under Pi deficiency across growth CO2. Averaged across CO2, the fractions of pod and seed weight to the TBM were 22% and 29% lower, respectively, at 0.01 mM versus 0.50 mM Pi-treated plants. Averaged across all treatments, the highest contribution to the TBM at the final harvest (110 DAP) was accredited to the pods (59.2% where seeds 43.1% and shells 16.1%) followed by leaves (19%).
Gas exchange
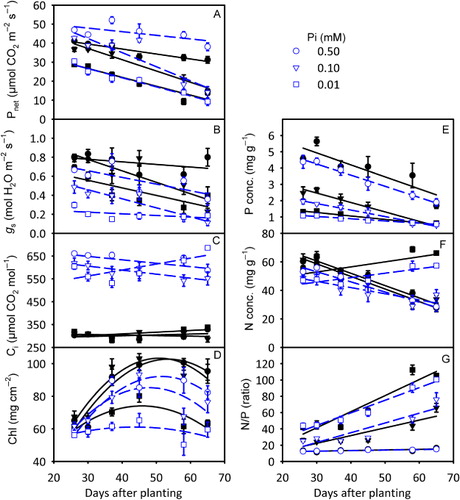
Rate of photosynthesis decreased as plant aged and was consistently reduced in the Pi-deficient plants and increased under eCO2, especially in the higher Pi treatments (). Both Pi deficiency and eCO2 showed lower gs which also tended to decrease as plants aged (). The Ci was either lower (eCO2) or slightly affected (aCO2) under Pi deficiency especially at early measurement dates but increased in the lowest Pi-treated plants at the later (58 and 65 DAP) measurement dates (). When averaged over measurement dates, Pi deficiency significantly (P < 0.05) decreased Pnet across CO2 levels, whereas a significant (P < 0.05) increase in Pnet (25.5%) at eCO2 versus aCO2 was observed only at 0.50 mM Pi treatment (data not shown). In addition, eCO2 caused 21–56% reductions in gs across Pi treatments and the effect of Pi treatment was not significant (P ≥ 0.1) for Ci.
Tissue constituents of uppermost fully expanded leaves
Chlorophyll concentration exhibited a curvilinear response as plant aged and tended to be lower in the lowest Pi treatment and at the eCO2 (). Tissue P concentration was also consistently lower at eCO2 and decreased as plant aged (). Averaged over measurement dates, both treatments affected the tissue N and P concentration (P ≤ 0.05, data not shown). Averaged across CO2 treatments, leaf P concentration in 65 DAP decreased by 2.68, 1.71, and 0.60 mg g−1 for 0.50, 0.10, and 0.01 mM Pi treatments, respectively, as compared to those for 26 DAP (). The N concentration also tended to be lower in eCO2-treated plants and decreased as plant aged except for the lowest Pi treatment which increased for the last two measurements (58 and 65 DAP; ). The N:P ratio was higher in Pi-deficient plants and increased as plant aged for all treatment combinations with the highest rate observed in the lowest Pi-treated plants ().
Tissue constituents of plant organs
The CO2 × Pi interactions were not significant (P > 0.05), but Pi deficiency decreased (P ≤ 0.05) tissue P concentration of whole-plant and organs regardless of the harvest dates (). Although the effect of CO2 was mostly significant (P ≤ 0.05) only at 110 DAP, all the plant organs often exhibited lower P concentration under eCO2. Except for stem and roots, Pi treatment significantly (P ≤ 0.05) affected tissue N concentration at the final harvest (). The tissue N concentration of whole-plant leaves decreased as plant aged across CO2 levels. Although, not always significant, eCO2 often decreased N concentration of whole-plant and organs. At the final harvest, seeds had the highest P (4.81 mg g−1) and N (65.9 mg g−1) concentration followed by pods then leaves when averaged across treatments.
Table 3. Effect of CO2 levels (µmol mol−1) and phosphate (Pi, mM) supply on phosphorus (P) and nitrogen (N) concentration in tissues of soybean plant and its organs 30, 45, and 110 DAP.
Leaf abscission
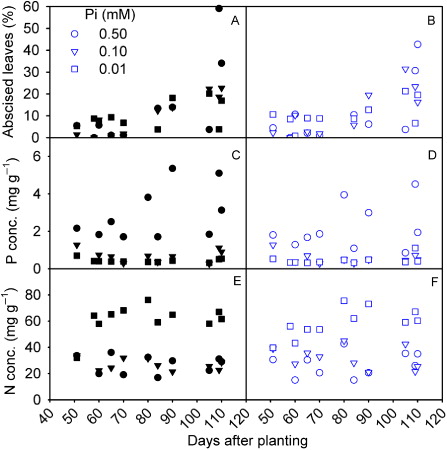
Soybean leaves started to abscise at approximately 50 DAP and up to 80% of the leaves were abscised before the final harvest depending upon treatments ( and ). Elevated CO2 did not appear to have a major influence on the leaf abscission. Regardless of the CO2 treatment, the tissue P concentration was lower whereas N concentration was higher in the abscised leaves of Pi-deficient plants as compared to 0.50 mM Pi-treated plants (–). When averaged across all measurements and treatments, the P and N concentrations of abscised leaves were 50% and 18% lower, respectively, as compared to the P and N concentrations of whole-plant leaves at 110 DAP.
Phosphorus and nitrogen utilization and uptake efficiencies
The CO2 × Pi interaction was not significant (P > 0.05) for these parameters except the PUE (110 DAP) and NUE (45 and 110 DAP; ). Pi deficiency increased PUE and decreased NUE (P ≤ 0.05) regardless of the CO2 treatments. Elevated CO2 tended to increase both PUE (19–81%) and NUE (7–60%) depending upon the time of the harvests and the Pi treatments. Irrespective of the CO2 treatments, the P and N uptake efficiencies were significantly (P ≤ 0.05) lower in Pi-deficient plants.
Table 4. Effect of CO2 levels (µmol mol−1) and phosphate (Pi, mM) supply on phosphorus and nitrogen utilization efficiency (PUE and NUE; g2 dry weight mg−1 P) and phosphorus and nitrogen uptake efficiency of soybean plants (PUpE and NUpE; mg P g−1 root dry weight) at the three destructive harvests 30, 45, and 110 DAP.
Relationship of tissue P with other parameters
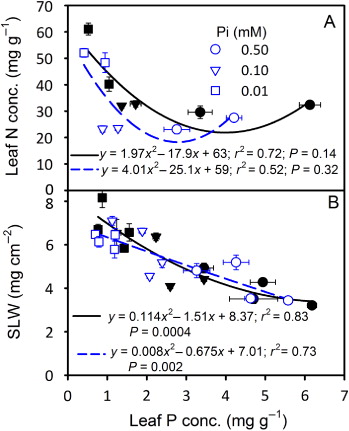
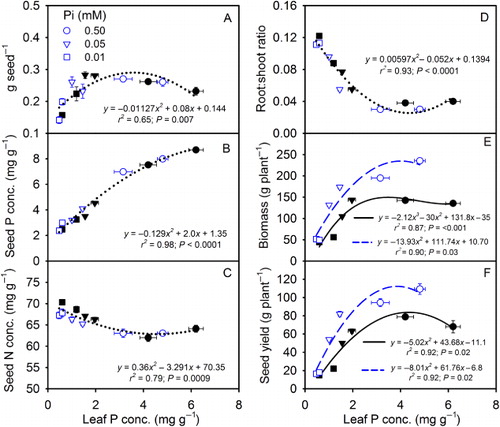
The response of the leaf N concentration showed an increasing (110 DAP) pattern especially at the lowest Pi treatment as the leaf P concentration decreased (). The SLW also increased as leaf P concentration decreased but did not differ between CO2 levels (). The individual seed weight and seed P concentrations increased, while seed N concentration and root:shoot ratio decreased as leaf P concentration increased, and did not differ between CO2 levels (–). TBM and seed yield showed increasing trend and the response to the eCO2 increased as leaf P concentration increased ( and ).
Discussion
Growth and biomass partitioning
Phosphate deficiency decreased soybean growth primarily by reducing leaf area and Pnet, thus causing severe reduction in canopy photosynthetic capacity leading to over 68% and 74% lower biomass and seed yield, respectively, in the lowest Pi treatment. Decreased leaf cell expansion due to reduced hydraulic conductance inside the plants has been reported to be the primary cause of smaller leaf area in Pi-deficient soybean and cotton (Radin & Eidenbock Citation1984; Fredeen et al. Citation1989). Pi deficiency reduced the Pnet concomitantly with gs which was in accordance with the previous study on soybean (Lauer, Pallardy, et al. Citation1989). The small effect of Pi deficiency on Ci suggested a minor role of gs to the photosynthetic limitations under Pi deficiency. Moreover, the increased Ci at the later growth stage in Pi-deficient plants indicated that mesophyll limitations to photosynthesis might have occurred, as suggested by other studies (Brodribb Citation1996; Singh & Reddy Citation2011). Therefore, major limitations to Pnet under Pi deficiency might still be attributed to the factors other than gs such as mesophyll and inhibition of photo-biochemical process (Lauer, Pallardy, et al. Citation1989; Jacob & Lawlor Citation1991; Singh, Badgujar, Reddy, Fleisher & Bunce Citation2013).
Similar to this study, the increased biomass partitioning toward roots under Pi deficiency has also been reported previously and attributed to the ability of plant to adjust the above- and below-ground growth in an effort to increase nutrient uptake (Lenka & Lal Citation2012). Under stress conditions plants allocate the biomass toward the organ associated with acquiring the limited resources, such as Pi in this case (Bazzaz Citation1997). The lower individual seed weight at the lowest Pi treatment was in accordance with previous research (Crafts-Brandner Citation1992b). Seed size tends to be fairly stable across Pi-nutrition and CO2 except at very low Pi supply (Cassman et al. Citation1981; Bharati et al. Citation1986; Cure et al. Citation1988). The biomass partitioning to seeds reflects the harvest index and has not been found to be affected by eCO2 across Pi nutrition in soybean (Cure et al. Citation1988). Increase in the number of pods and seeds rather than the seed size contributed to higher seed yield under eCO2 conditions. Prior and Rogers (Citation1995) also reported that number of seed per plant increased at eCO2 regardless of water regime.
The PUE was always higher but the NUE decreased in Pi-deficient plants across CO2 treatments. However, this increase in the PUE under Pi-deficiency was influenced by the time of the harvest. The highest PUE was observed in 0.01 mM Pi at 30 DAP whereas PUE was the highest in 0.1 mM Pi treatment at the 45 and 110 DAP. Under severe Pi-deficiency, soybean growth is highly suppressed leading to lower PUE as also observed in other study (Cure et al. Citation1988). Nonetheless, in the current study, the increase in the PUE occurred despite the reduction in the PUpE. An increased root to shoot ratio in the plants grown under nutrient deficient or eCO2 as observed in this and other studies might increase the nutrient acquisition, thus providing more root surface for nutrient absorption and enhanced nutrient uptake to support the above-ground biomass (Prior et al. Citation1998; Singh, Badgujar, Reddy, Fleisher & Timlin Citation2013). The PUE increases even under declined nutrient uptake efficiency due to favored root growth and overall increased in the total amount of nutrient uptake (Cure et al. Citation1988; Rogers et al. Citation1994; Singh, Badgujar, Reddy, Fleisher & Timlin Citation2013).
The Pi supply exerted major control upon the degree of stimulation by eCO2 on plant growth, Pnet, and seed yield. For example, eCO2-mediated increase in these parameters was the greatest at 0.50 mM Pi and was insignificant or none in the low Pi treatments. Increased growth at eCO2 was mainly associated with increased leaf area, Pnet, and PUE of biomass production. Previous studies also reported that increase in canopy photosynthesis due to increased leaf area and Pnet at eCO2 contributed the most to increased growth under Pi nutrition (Cure et al. Citation1988; Singh, Badgujar, Reddy, Fleisher & Timlin Citation2013). Although none of plant organs except the stems showed appreciable increases in biomass partitioning at eCO2, the biomass accumulation for all plant organs was higher across Pi nutrition which led to the observed growth stimulations and higher P and N utilization efficiencies. Responses of TBM and Pnet at eCO2 were maximized due to increased P and N uptake on per plant basis and were closely associated with the P and N utilization efficiencies. For instance, the PUE and NUE increased with TBM and decreased when TBM was low at eCO2 (e.g. 45 DAP at 0.01 mM Pi). This clearly indicated that, despite the lower tissue P or N concentration, growth enhancement occurred at eCO2. Moreover, the higher growth at eCO2 occurred without a significant increase in the P and N uptake efficiencies, especially in Pi-deficient plants. The higher root mass at eCO2 may also contribute to increased uptake due to increased root surface area (Cure et al. Citation1988).
Tissue constituents
The observed decrease in tissue P and N concentration as the plant aged might be attributed to the remobilization of nutrients to new growth and seeds (Hanway & Weber Citation1971a, Citation1971b; Jones et al. Citation1977; Lauer, Blevins, et al. Citation1989). Hanway and Weber (Citation1971a) reported mobilization of approximately half of nutrients (N and P) from vegetative parts to seeds. Tissue P and N concentration followed nearly a similar trend for both the uppermost fully expanded leaves and in the whole-plant or whole-plant leaves. The observed decrease (P) or increase (N) in the tissue nutrient concentration under Pi deficiency has also been reported in other studies (Fleisher et al. Citation2012; Singh, Badgujar, Reddy, Fleisher & Timlin Citation2013). Apparently, due to Pi deficiency the tissue P concentration decreased in greater proportion than the plant biomass leading to markedly increased PUE. However, at the high Pi treatment, the decline in the PUE might have been associated with continued increase in plant P concentration even after the maximum growth was attained (Cure et al. Citation1988). This was also supported by higher PUpE in the Pi sufficient versus Pi-deficient plants. The nutrient leakage and lower energy balance in Pi-deficient roots might have also contributed to lower P uptake leading to the greater reduction of tissue P concentration than biomass production under Pi deficiency (Ratnayake et al. Citation1978; Rufty et al. Citation1993).
The higher tissue N/P ratio observed in Pi-deficient plant, regardless of the CO2 treatments, is also an indicator of Pi-stress (Güsewell Citation2004). The mean N/P ratio in the Pi sufficient plants varied between 11 and 16 whereas it was >20 (up to 105) under Pi-deficiency exhibiting increased Pi limitation as the deficiency increased similar to the earlier findings (Koerselman & Meuleman Citation1996; Güsewell Citation2004). Therefore, the critical N/P ratio in soybean appeared to be <16 for optimal growth across CO2 condition.
Increased tissue N in Pi-deficient plants clearly indicated alteration in the N assimilation and reduced mobility inside the plant (Rufty et al. Citation1993). The markedly increased fraction of root biomass in Pi-deficient plant might have also assisted increased N uptake because N was not limited in the rooting medium (Singh, Badgujar, Reddy, Fleisher & Timlin Citation2013). When, other nutrients such as Pi is limited, the excess N in the leaf tissue is often stored as the non-functional protein at the expense of other essential cell components such as enzymes and chlorophyll (Israel & Ruffy Citation1988; Staswick et al. Citation1991). This was also consistent with the markedly reduced chlorophyll concentration in the lowest Pi-treated plants in the current study.
The leaf abscission started to occur approximately 50 DAP in all treatments which was similar to the observation made elsewhere (Hanway & Weber Citation1971a). Generally, at this early growth stage, plant leaves act as a sink for mineral nutrients while later becoming nutrient source for the new growth and the development of seeds (Himelblau & Amasino Citation2001). Remobilization of nutrients from the leaves was apparent from the overall lower P and N concentration of abscised versus attached leaves. However, a marked increase in P (> 80 DAP at 0.50 mM Pi) or N concentration (> 58 DAP at 0.01 mM Pi) in the abscised leaves also suggested the lack of complete utilization of these nutrients during the senescence (). Since the seed N concentration was not reduced in the Pi-deficient plants indicating low demand, the N might have been accumulated in excess in the plant tissue. Therefore, the remobilization of the nutrient may be complex in nature, at least when Pi is deficient, and might not exert a primary regulatory control in the process of leaf senescence in soybean (Crafts-Brandner Citation1992a, Citation1992b; Mauk & Noodén Citation1992).
The lower nutrient concentrations at eCO2 have often been reported and might be attributed to reduced demand, lower transpiration, adjustment in the nutrient uptake and utilization, and increased growth and leaf thickness (which act as dilution effects; Cure et al. Citation1988; Taub & Wang Citation2008; Singh, Badgujar, Reddy, Fleisher & Timlin Citation2013). Increased growth and lower transpiration due to reduced gs at eCO2 were also observed in the current study. However, the SLW, signifying leaf thickness, of both uppermost fully expanded leaves (data not shown) and whole-plant leaves were not affected by eCO2, contrary to the earlier results in cotton (Singh, Badgujar, Reddy, Fleisher & Timlin Citation2013). The alteration in the N metabolism may influence nitrate assimilation and biosynthesis of organic compounds, thus affecting the overall response of plants to eCO2 (Bloom et al. Citation2010; Singh, Badgujar, Reddy, Fleisher & Timlin Citation2013).
Tissue P in relation with plant parameters
The observed curvilinear response of growth and seed yield with the leaf P concentration suggested that the highest Pi treatments reflected sufficient Pi supply in the current study. The plant tissue and seed P concentration in 0.50 mM Pi treatment was also comparable to observations made in other studies (Cassman et al. Citation1981; Walker et al. Citation1985). The individual seed weight increased with leaf P concentration but did not differ between CO2 levels which was in accordance with the observed non-significant effect of the CO2 on seed size in the current study and elsewhere (Prior & Rogers Citation1995). Although seed P concentration was significantly lower at eCO2 across Pi treatments, the seed P response to leaf tissue P concentration did not differ between CO2 levels. The inverse relationship observed between seed P and N concentration was in agreement with the earlier findings (Crafts-Brandner Citation1992b) and likewise, suggested that N remobilization to the seeds was not restricted and the net seed N demand for the plant was lower due to decreased seed yield in the Pi-deficient plants.
TBM and seed yield showed an increasing response to tissue P concentration and differed between CO2 levels. Previous studies indicated that eCO2 increases the overall nutrient demands and higher concentration of leaf P may be required for maximum plant productivity (Conroy Citation1992; Rogers et al. Citation1993). Therefore, the critical leaf P concentration is likely to be higher in plants grown under eCO2. In fact, in the current study, the leaf P concentration (mg g−1) at maximum biomass and seed yield was higher at eCO2 (4.8 mg) versus aCO2 (< 4.2 mg) indicating higher critical foliar concentration (the data points in the and ). This is in contrast to the lower critical tissue N concentration at eCO2 for wheat and cotton as reported previously (Rogers et al. Citation1993). However, similar to our study, an increased critical tissue P and K (potassium) concentration has been suggested in other crops (Conroy Citation1992; Rogers et al. Citation1993; Reddy & Zhao Citation2005). This clearly suggested that it is not only the nutrient demand but also the sensitivity of crop may be increased especially for P and K nutrition under CO2-enriched atmosphere of the future. The lower demand of N but higher requirement of P or K under eCO2 might be one of the major causes for the observed differences of the critical nutrient concentration among N, P, and K. Therefore, the current understanding that relates to the requirement of the tissue nutrient concentration to achieve optimum crop growth and yield under ambient CO2 is likely to change in to the CO2-enriched atmosphere.
Conclusions
The marked decrease in the soybean biomass and seed yield under Pi deficiency was primarily attributed to severely decreased leaf area and photosynthesis. Stomatal conductance did not appear to be the main cause of photosynthetic inhibition in Pi-deficient plants. The greater PUE and lower P uptake efficiency in Pi-deficient plants were attributed to the alteration in biomass partitioning and the dynamics in the nutrient allocation in plant organs. In the Pi-deficient plants, the alteration in N uptake and utilization was apparent due to increased tissue N concentration in both intact and abscised leaves. A tissue N/P ratio of >16 appeared to exhibit phosphorus limitation for soybean growth and development. The higher root:shoot ratio might have also assisted in greater N uptake resulting in the higher tissue N concentration in Pi-deficient plant. The growth stimulation at eCO2 was closely associated with increased P utilization efficiency. However, the degree of soybean growth, yield, and photosynthetic response to eCO2 were depended upon the Pi nutrition. The tissue P concentration required for maximum productivity for biomass and seed yield tended to be higher at eCO2 versus aCO2. The results suggested that eCO2 is likely to increase the leaf critical P concentration for biomass productivity and yield in soybean. Therefore, the optimum soil phosphorus availability will be vital to gain maximum benefit from the CO2 enriched environment.
Acknowledgments
The authors would like to thank Mr. Darryl Baxam (Engineering Technician) for help in maintaining the growth chambers. Thanks also go to Mary J. Camp (Statistician General) for providing statistical help during data analysis.
Related Research Data
References
- Ahmed FE, Hall AE, Madore MA. 1993. Interactive effects of high temperature and elevated carbon dioxide concentration on cowpea [Vigna unguiculata (L.) Walp.]. Plant Cell Environ. 16:835–842. 10.1111/j.1365-3040.1993.tb00505.x
- Baker JT, Allen LH. 1993. Contrasting crop species responses to CO2 and temperature: rice, soybean and citrus. Plant Ecol. 104–105:239–260. 10.1007/BF00048156
- Bazzaz FA. 1997. Allocation of resources in plants: state of the science and critical questions. In: Bazzaz FA, Grace J, editors. Plant resource allocation. San Diego (CA): Academic Press; p.1–38.
- Bharati MP, Whigham DK, Voss RD. 1986. Soybean response to tillage and nitrogen, phosphorus, and potassium fertilization. Agron J. 78:947–950. 10.2134/agronj1986.00021962007800060002x
- Bloom AJ, Burger M, Asensio JSR, Cousins AB. 2010. Carbon dioxide enrichment inhibits nitrate assimilation in wheat and Arabidopsis. Science. 328:899–903. 10.1126/science.1186440
- Brodribb T. 1996. Dynamics of changing intercellular CO 2concentration (Ci) during drought and determination of minimum functional Ci. Plant Physiol. 111:179–185.
- Cassman KG, Whitney AS, Fox RL. 1981. Phosphorus requirements of soybean and cowpea as affected by mode of Nnutrition. Agron J. 73:17–22. 10.2134/agronj1981.00021962007300010005x
- Conner T, Paschal EH, Barbero A, Johnson E. 2004. The challenges and potential for future agronomic traits in soybeans. AgBioForum. 7:47–50.
- Conroy J. 1992. Influence of elevated atmospheric CO2 concentrations on plant nutrition. Aust J Bot. 40:445–456.
- Cordell D, Drangert J-O, White S. 2009. The story of phosphorus: global food security and food for thought. Global Environ Change. 19:292–305. 10.1016/j.gloenvcha.2008.10.009
- Crafts-Brandner SJ. 1992a. Phosphorus nutrition influence on leaf senescence in soybean. Plant Physiol. 98:1128–1132. 10.1104/pp.98.3.1128
- Crafts-Brandner SJ. 1992b. Significance of leaf phosphorus remobilization in yield production in soybean. Crop Sci. 32:420–424. 10.2135/cropsci1992.0011183X003200020028x
- Cure JD, Rufty TW, Israel DW. 1988. Phosphorus stress effects on growth and seed yield responses of nonnodulated soybean to elevated carbon dioxide. Agron J. 80:897–902. 10.2134/agronj1988.00021962008000060012x
- Fleisher DH, Wang Q, Timlin DJ, Chun J-A, Reddy VR. 2012. Response of potato gas exchange and productivity to phosphorus deficiency and carbon dioxide enrichment. Crop Sci. 52:1803–1815. 10.2135/cropsci2011.09.0526
- Fredeen AL, Rao IM, Terry N. 1989. Influence of phosphorus nutrition on growth and carbon partitioning in Glycine max. Plant Physiol. 89:225–230. 10.1104/pp.89.1.225
- Güsewell S. 2004. N: P ratios in terrestrial plants: variation and functional significance. New Phytol. 164:243–266. 10.1111/j.1469-8137.2004.01192.x
- Hanway JJ, Weber CR. 1971a. Accumulation of N, P, and K by soybean (Glycine max (L.) Merrill) plants. Agron J. 63:406–408. 10.2134/agronj1971.00021962006300030017x
- Hanway JJ, Weber CR. 1971b. N, P, and K percentages in soybean (Glycine max (L.) Merrill) plant parts. Agron J. 63:286–290. 10.2134/agronj1971.00021962006300020027x
- Hewitt EJ. 1952. Sand and water culture. Methods used in the study of plant nutrition. In: Hewitt EJ, editor. Technical communication no. 22. Commonwealth Bureau of Horticulture and Plantation, East Malling, Maidstone, Kent. Bucks, England. Farnham Royal: Commonwealth Agricultural Bureaux; p. 187–190.
- Himelblau E, Amasino RM. 2001. Nutrients mobilized from leaves of Arabidopsis thaliana during leaf senescence. J Plant Physiol. 158:1317–1323. 10.1078/0176-1617-00608
- IPCC. 2007. Climate change 2007: the physical science basis. Contribution of working group I to the fourth assessment report of the intergovernmental panel on climate change NY, USA. Cambridge and New York: Cambridge University Press.
- Israel DW, Ruffy TW. 1988. Influence of phosphorus nutrition on phosphorus and nitrogen utilization efficiencies and associated physiological responses in soybean. Crop Sci. 28:954–960. 10.2135/cropsci1988.0011183X002800060018x
- Israel DW, Rufty TW, Cure JD. 1990. Nitrogen and phosphorus nutritional interactions in a CO2 enriched environment. J Plant Nutr. 13:1419–1433. 10.1080/01904169009364163
- Jacob J, Lawlor DW. 1991. Stomatal and mesophyll limitations of photosynthesis in phosphate deficient sunflower, maize and wheat plants. J Exp Bot. 42:1003–1011. 10.1093/jxb/42.8.1003
- Jaidee R, Polthanee A, Saenjan P, Kirkham M, Promkhambut A. 2013. Pre- or post-rice soybean production with phosphorus fertilization under rainfed conditions. Aust J Crop Sci. 7:22–31.
- Jones GD, Lutz JA, Smith TJ. 1977. Effects of phosphorus and potassium on soybean nodules and seed yield. Agron J. 69:1003–1006. 10.2134/agronj1977.00021962006900060024x
- Koerselman W, Meuleman AFM. 1996. The vegetation N:P ratio: a new tool to detect the nature of nutrient limitation. J Appl Ecol. 33:1441–1450. 10.2307/2404783
- Lam SK, Chen D, Norton R, Armstrong R. 2012. Does phosphorus stimulate the effect of elevated [CO2] on growth and symbiotic nitrogen fixation of grain and pasture legumes? Crop Pasture Sci. 63:53–62. 10.1071/CP11296
- Lauer MJ, Blevins DG, Sierzputowska-Gracz H. 1989. 31P-affected by phosphate nutrition-nuclear magnetic resonance determination of phosphate compartmentation in leaves of reproductive soybeans (Glycine max l.) as affected by phosphate nutrition. Plant Physiol. 89:1331–1336. 10.1104/pp.89.4.1331
- Lauer MJ, Pallardy SG, Blevins DG, Randall DD. 1989. Whole leaf carbon exchange characteristics of phosphate deficient soybeans (Glycine max L.). Plant Physiol. 91:848–854. 10.1104/pp.91.3.848
- Lenka NK, Lal R. 2012. Soil-related constraints to the carbon dioxide fertilization effect. Crit Rev Plant Sci. 31:342–357. 10.1080/07352689.2012.674461
- Lewis JD, Griffin KL, Thomas RB, Strain BR. 1994. Phosphorus supply affects the photosynthetic capacity of loblolly pine grown in elevated carbon dioxide. Tree Physiol. 14:1229–1244. 10.1093/treephys/14.11.1229
- Lichtenthaler HK. 1987. Chlorophylls and carotenoids: pigments of photosynthesis. Methods Enzymol. 148: 350– 382. 10.1016/0076-6879(87)48036-1
- Mauk CS, Noodén LD. 1992. Regulation of mineral redistribution in pod-bearing soybean explants. J Exp Bot. 43:1429–1440. 10.1093/jxb/43.11.1429
- Prior SA, Rogers HH. 1995. Soybean growth response to water supply and atmospheric carbon dioxide enrichment. J Plant Nutr. 18:617–636. 10.1080/01904169509364927
- Prior SA, Torbert HA, Runion GB, Mullins GL, Rogers HH, Mauney JR. 1998. Effects of carbon dioxide enrichment on cotton nutrient dynamics. J Plant Nutr. 21:1407–1426. 10.1080/01904169809365492
- Qiu J, Israel DW. 1992. Diurnal starch accumulation and utilization in phosphorus-deficient soybean plants. Plant Physiol. 98:316–323. 10.1104/pp.98.1.316
- Radin JW, Eidenbock MP. 1984. Hydraulic conductance as a factor limiting leaf expansion of phosphorus-deficient cotton plants. Plant Physiol. 75:372–377. 10.1104/pp.75.2.372
- Ratnayake M, Leonard RT, Menge JA. 1978. Root exudation in relation to supply of phosphorus and its possible relevance to mycorrhizal formation. New Phytol. 81:543–552. 10.1111/j.1469-8137.1978.tb01627.x
- Reddy KR, Zhao D. 2005. Interactive effects of elevated CO2 and potassium deficiency on photosynthesis, growth, and biomass partitioning of cotton. Field Crops Res. 94:201–213. 10.1016/j.fcr.2005.01.004
- Rogers GS, Payne L, Milham P, Conroy J. 1993. Nitrogen and phosphorus requirements of cotton and wheat under changing atmospheric CO2 concentrations. Plant Soil. 155–156:231–234. 10.1007/BF00025026
- Rogers HH, Runion GB, Krupa SV. 1994. Plant responses to atmospheric CO2 enrichment with emphasis on roots and the rhizosphere. Environ Pollut. 83:155–189. 10.1016/0269-7491(94)90034-5
- Rufty TW, Israel DW, Volk RJ, Qiu J, Sa T. 1993. Phosphate regulation of nitrate assimilation in soybean. J Exp Bot. 44:879–891. 10.1093/jxb/44.5.879
- Rufty TW, Siddiqi MY, Glass ADM, Ruth TJ. 1991. Altered 13NO3−influx in phosphorus limited plants. Plant Sci. 76:43–48. 10.1016/0168-9452(91)90216-U
- Sa T, Israel DW. 1998. Phosphorus-deficiency effects on response of symbiotic N2 fixation and carbohydrate status in soybean to atmospheric CO2 enrichment. J Plant Nutr. 21:2207–2218. 10.1080/01904169809365555
- Saxton AM. 1998. A macro for converting mean separation output to letter groupings in proc mixed. 23rd SAS User Group Intl. Cary (NC): SAS Institute.
- Singh SK, Badgujar G, Reddy VR, Fleisher DH, Bunce JA. 2013. Carbon dioxide diffusion across stomata and mesophyll and photo-biochemical processes as affected by growth CO2 and phosphorus nutrition in cotton. J Plant Physiol. 170:801–813. 10.1016/j.jplph.2013.01.001
- Singh SK, Badgujar GB, Reddy VR, Fleisher DH, Timlin DJ. 2013. Effect of phosphorus nutrition on growth and physiology of cotton under ambient and elevated carbon dioxide. J Agron Crop Sci. 199:436–448. 10.1111/jac.12033
- Singh SK, Reddy KR. 2011. Regulation of photosynthesis, fluorescence, stomatal conductance and water-use efficiency of cowpea (Vigna unguiculata [L.] Walp.) under drought. J Photochem Photobiol B Biol. 105:40–50. 10.1016/j.jphotobiol.2011.07.001
- Sionit N. 1983. Response of soybean to two levels of mineral nutrition in CO2-enriched atmosphere. Crop Sci. 23:329–333. 10.2135/cropsci1983.0011183X002300020035x
- Staswick PE, Huang J-F, Rhee Y. 1991. Nitrogen and methyl jasmonate induction of soybean vegetative storage protein genes. Plant Physiol. 96:130–136. 10.1104/pp.96.1.130
- Taub DR, Wang X. 2008. Why are nitrogen concentrations in plant tissues lower under elevated CO2? A critical examination of the hypotheses. J Integr Plant Biol. 50:1365–1374. 10.1111/j.1744-7909.2008.00754.x
- Vance CP, Uhde-Stone C, Allan DL. 2003. Phosphorus acquisition and use: critical adaptations by plants for securing a nonrenewable resource. New Phytol. 157:423–447. 10.1046/j.1469-8137.2003.00695.x
- Walker WM, Raines GA, Peck TR. 1985. Effect of soybean cultivar, phosphorus and potassium upon yield and chemical composition. J Plant Nutr. 8:73–87. 10.1080/01904168509363325