
Abstract
Plant functional traits built the relationships between plant diversity, species composition, and physiology along with the environmental changes, thus influencing soil microbial community. As the sensitivity indicators, soil microbial biomass and plant functional traits responses soil micro-organism and plant characteristics in direct way. Ten plant functional traits of 149 species and soil microbial biomass (carbon, nitrogen, and phosphorus) were analyzed across the different vegetation types (forest, forest-steppe, and steppe) that are divided by environmental gradient (temperature and precipitation), aimed to find the correlations among them. Our results confirmed the greatest values of plant functional traits (except the leaf density and the fine root density) that were distributed in the steppe zone, mainly due to the different mean annual temperature and mean annual precipitation conditions. For different plant growth forms, the plant functional traits were significant differences among the vegetation zones. The advantages of higher rate nutrient cycling, plentiful biomass supplements, and favorite habit conditions lead to the forest-steppe zone with the highest Cmic and Nmic concentrations. The canonical correlation analysis indicated that leaf nitrogen, root nitrogen, and fine root densities were correlated with root exudate and tissue which affected the concentrations of soil organic carbon (SOC) and total nitrogen (N), consequently impacting soil microbial biomass carbon (Cmic) and soil microbial biomass nitrogen (Nmic). Soil is the medium that connects micro-organism and plant root system that influenced leaf nitrogen, root nitrogen, and fine root density of plant functional traits, the concentrations of SOC and total N that plant feedback are consequently influencing Cmic and Nmic.
Introduction
Plant functional traits can be defined as the plant attributes that response to environmental conditions and effects on the dominant ecosystem processes (Walker Citation1992; Noble & Gitay Citation1996; Diaz et al. Citation2004). As the ecological index, plant functional traits are the consequences by environment and biology selection (Diaz & Cabido Citation1997). It is related with climate, topography, and soil property (Diaz et al. Citation1998), especially for the plant morphology and physiology that influenced by the hydrothermal conditions (Wright et al. Citation2005). Although quantifying the correlations among the functional traits and how traits differ between growth forms and plant functional types not only gives insight into the selective pressures that have shaped the evolution of the vegetation succession but also crucial to reliable calibration of models designed to predict vegetation and productivity shift with climate and condition change (Cunningham et al. Citation1999; Wright et al. Citation2005). It bridges the gap between plant physiology and community and ecosystem processes, thus providing a powerful tool in environment research (Diaz et al. Citation2004). Vegetation species number and composition are thought to affect ecosystem productivity, stability, nutrient dynamics, and invisibility (Tilman Citation1996; Tilman et al. Citation1996; Citation2001; Hooper et al. Citation2000; Citation2005; Fornara & Tilman Citation2008). That gave greater differences in functional traits that allowing plant to exploit resources from soil in different ways (Spehn et al. Citation2000).
Soil microbial biomass is defined as the total numbers of soil micro-organisms, include with bacteria, fungi, and protozoa. With numerous ecological functions, soil micro-organisms are the principle driving force that joins in the transformations of carbon, nitrogen, and phosphorus, and became the crucial part in material circulation and energy flow (An et al. Citation2009; Kushwaha et al. Citation2000; Ladd et al. Citation2004). In plant–soil ecosystem, as the major decomposer, soil micro-organism interacts with the other soil organism which impact plant growth, source allocation, and chemical compositions by the modes of nutrient turnover and source supply (Hooper et al. Citation2000). It is not only the resource of nutrient but also the pool that significantly affect the plant growth, development, and vegetation succession (Pascual et al. Citation2000; Wang et al. Citation2004). Plant reacts on soil micro-organism that provides nutrition by root exudate and litter to promote soil microbial diversity.
Recently, the researches of plant functional traits always focus on the exploration of trait–trait and trait–environment associations, and the empirical testing of hypotheses (Leishman & Westoby Citation1992). Some researches shown that the plant functional trait were related with soil nutrition cycling and water application (Guo et al. Citation2004; Wright et al. Citation2004; Citation2005; Fornara & Tilman Citation2008), but there was no researches to relate plant functional traits and soil microbial biomass. At catchment scale, environment gradient changes vegetation types, diversities and distributions which influenced soil microbial biomass and plant functional traits directly. Our research was done in the Yanhe watershed with different vegetation zones; the objectives of this study were (1) to quantify the differences of plant functional traits and soil microbial biomass in vegetation zones on the Loess Plateau; (2) to seek the correlation of soil microbial biomass and plant functional traits in different plant growth forms; and (3) to clarify how the plant functional traits affected soil property and soil microbial biomass.
Materials and methods
Study area
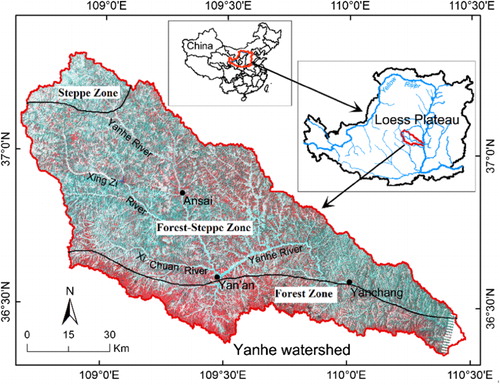
The study area Yanhe river catchment (108°45–110°28E, 36°23′– 37°17′N) is located in the middle of the Yellow river, northern of Shannxi province (). The area is 287 km in length. About 90% of the area (7687 km2) is hilly; only 7% of area can be considered for intensive agriculture. It has a semi-arid climate with heavy seasonal rainfall and periodic flooding followed by drought. The average annual temperature is 9°C. The average annual rainfall was 497 mm (1970–2000, 22%; CV – variable coefficient) with the distinct wet and dry season. The rainy season is from July to October, August rainfall amount to 23% of the annual total. Most area lies at 900–1500 m altitude. The area’s topography is characterized by cliffs and serious steep slopes (40%). The climate characteristics have the gradient variation from southeast to northwest. The dominant soil type is classified as a loessal Cambisol by the Chinese Soil Taxonomy Research Group (2001).
Based on the environmental stratification sampling technique, we classified study area into three vegetation zones: (1) forest zone; (2) forest-steppe zone; and (3) steppe zone. is the picture of environmental gradient that was according to the plant adaptation mechanism and the climate major factors (MAT – mean annual temperature; MAP – mean annual precipitation). The study area was divided into 14 plaques (); different colors represent the respective environmental characteristics that included the information of topography, climate, and vegetation.
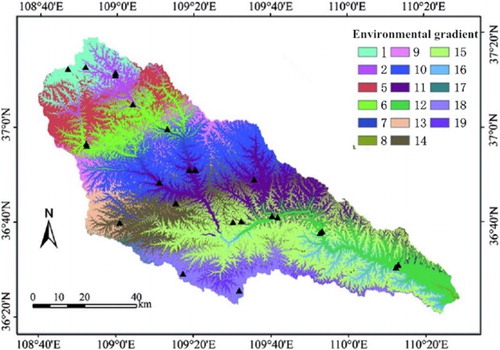
Table 1. The environmental gradient according to MAP and MAT.
The geomorphic type in forest zone is loess hilly; the altitude is 800–1400 m. The average annual rainfall and temperature were 520–550 mm and 8.5–9.5°C, respectively. The rainy season is from July to September, rainfall amount to 55–58% of the annual total. In the southern, second forest and shrub land were the major vegetation types. The constructive species were Quercus liaotungensis, Populus davidiana, Armeniaca vulgaris (aber), Acer palmatum, Rosa xanthine, Caragana microphylla, Prinsepia utilis, Syringa pekinensis, Spiraea salicifolia (shrub). Manmade forest and shrub land account for large proportion in northern region: Robinia pseudoacacia, Populus tremula, and Caragana korshinskii. It is also with some herbaceous plants which included Stipa bungeana, Bothriochloa ischaemum, and Poa sphondylodes. Steppe zone was located in the margin of the Mu Us sand land which is the sensitivity region that transit from Loess Plateau to desert; the altitude is 1123–1823 m. The average annual rainfall and temperature were 390 mm and 7.8°C, respectively. Vegetation types are the temperate arid grass that included Artemisia giraldii, Artemisia frigida, Artemisia caillaris, P. sphondylodes, and Thymus mongolicus. The topography of forest-steppe zone is loess hilly-gully, the altitude is 997–1731 m. The average annual rainfall and temperature were 505 mm and 8.8°C. Vegetation types are the warm temperate forest and steppe, the area of forest account for 17.7%. The major arbor types were R. pseudoacacia and Simon poplar. The shrub land were R. xanthine, Ostryopsis davidiana, and Sophora davidii which were developed after grazing prohibition, and manmade shrub C. korshinskii, Hippophae rhamnoides. The herbaceous plants included Artemisia vestita, T. mongolicus, Setaria viridis, B. ischaemum, Stipa grandis, and Carex lanceolata Boott.
Sample collection design
Sample collection was based on the region administrative division and filed investigation, 16 representative villages were selected and laid out 24 sample sites ( and ) in August 2012.
Table 2. The sampling information.
In each sample sites, three areas of 60 × 60 m (quadrat) were selected as the replicates. For vegetation investigation, three 20 × 20 m, 10 × 10 m, and 2 × 2 m quadrats were selected for forest, shrub land, and grassland, respectively. The sampling method and technical specification were referenced communities’ investigation. For soil sample collection, it was divided into two depths: 0–10 and 10–30 cm. Five replicates were taken in the field, took them to the laboratory, and separated into two parts. One part was for soil microbial biomass measurement (preserve in 4°C); the other was for soil physicochemical property analysis (air-dried). The basal gradient information (longitude, latitude, and altitude) were applied by Global Position System.
Meteorological information
Meteorological data used the ANUSPLIN spatial interpolation technology, which interpolated and fitted the data of 57 meteorological stations in Yanhe catchment to get MAP and MAT. The MAP and MAT of Yanhe watershed were ranged from 440.72 to 528.67 mm and 8.34 to 11.29°C, respectively.
Plant functional traits measurement
Plant functional traits consist of the thickness of leaf (LT), the area of leaf (LA), the rate of leaf length and wide (LW), the special leaf area (SLA), the leaf density (LTD), the total nitrogen of leaf (LNC), the special fine root length (SRL), the fine root density (RTD), and the total nitrogen of fine root (RNC). Leaf sampling was processing in the morning in order to reduce relative error. We collected the leaf from different azimuths, and removed petiole carefully because the LNC easily change by the plant position. We selected 5–10 plants for each species and chose 5–10 maturity and integrity leaves and fine roots (<2 mm). The practical measurements of functional traits were shown in .
Table 3. The measurements of plant functional traits.
Soil property measurements
Soil organic carbon (Corg) was determined by wet digestion in a mixture of 5 ml 0.136 mol/L potassium dichromate and 5 ml concentrated sulfuric acid. Soil total nitrogen (total N) measured by the Kjeldahl digestion. Alkali-ExTR-N was measured using a micro-diffusion method, in which NH3 was released from the soil sample by NaOH and then absorbed by boric acid. The ammonium borate product was titrated with 0.01 mol HCL. Available phosphorus (Av-P) was extracted and measured in a buffered alkaline solution with 0.5 M sodium bicarbonate. The extracts were quantified calorimetrically with a spectrophotometer (Hitachi, UV2300) at 660 nm. The water-holding capacity was determined by saturating each sample 100 cm3 turf with water and drain at field capacity under cover for 48 h at ambient temperature. Duplicate soil cores were dried at 105°C before determining the moisture content (SM–soil moisture).
Soil samples were air-dried and sieved with 2 mm aperture to remove large roots, stone, and macro-fauna for nutrient analysis. Major soil chemical properties were measured according to soil chemical and physical analyses (ISSCAS 1981).
Soil microbial biomass measurements
Soil microbial biomass C, N, and P were determined by the fumigation-extraction method, 15 g oven-dried, field-moist-equivalent soil (<2 mm) sample was fumigated with chloroform for 24 h, and the chloroform was then removed by repeated evacuation. The soil was re-inoculated with a small amount of unfumigated soil and then incubated at a constant temperature (usually 22°C or 25°C) for 10 days at field capacity or 50% of its water-holding capacity (about −0.01 MPa). An additional soil sample was retained unfumigated and used as a control. The soil microbial biomass carbon was determined by TOC analyzer immediately or preserve in −18°C (Phoenix 8000, TekmarDohrmann, Mason, OH, USA). The soil microbial biomass N determination from both fumigated and unfumigated samples were first extracted with the potassium per-sulfate oxidation and ultraviolet spectroscopy. Then, the extract liquor was digested with alkaline oxidant 0.15 mol/L NaOH and 30 g/L K2S2O8 of a 1:1 v/v mixture of oxidant and soil in 120–124°C for 30 min, and determined colorimetric ally in a spectrophotometer (Hitachi, Tokyo, Japan, UV2300) at 220 and 275 nm. The soil microbial P was determined calorimetrically with a spectrophotometer. Briefly, 2.5 g of fumigated and non-fumigated soil were put into 150-ml flask containing 50 ml of 0.5 mol/L NaHCO3 solution and 2 g P-free active charcoal; 5 ml of Mo-Sb spetrochrometry solution was then added for color development. After 30 min, the color was determined with a spectrophotometer (Hitachi, UV 2300) at 700 nm.
Statistical analysis
A variety of statistical analyses were conducted to identify the effects of different vegetation zones and life forms on the plant functional traits and soil microbial biomass. A one-way analysis of variance (ANOVA) was employed to test the significance of the mean differences; the level set for significant difference was p < 0.05. A univariate procedure was used to examine the normality of the distribution of the observed data for conducting the ANOVA analysis. When the ANOVA test indicated a significant effect at p < 0.05, the mean of each soil variable for each classification factor was assessed using the Duncan multiple-range procedure. All the statistical analyses were performed using SPSS18.0.
Result
Soil physiochemical characteristics
The distribution of soil physiochemical characteristics was shown in . The value of Corg, total N, Ap-P, NO3-N, and NH4-N were decreased as soil profile depths increases, while soil bulk density with the opposite tendencies. Totally, soil bulk density, Corg, and total N in different vegetation types were ranked in the following order: forest zone > forest-steppe zone > steppe zone. However, the value of Ap-P, NO3-N, and NH4-N were greatest in forest zone, and lowest in forest-steppe zone. Among the different land uses, the values of Corg, NO3-N, and NH4-N were greatest in natural grassland and arbor forest among forest-steppe zone, steppe zone, and forest zone in soil profile depths. Cropland with the highest soil bulk density and Ap-p, lowest Corg, total N, NO3-N, and NH4-N that distributed in forest-steppe zone and steppe zone.
Table 4. Soil physiochemical characteristic.
Plant functional traits distribution
In Yanhe watershed, the plant functional traits (LA, LW, SLA, LTD, and SRL) were significantly different among the forest, forest-steppe, and steppe zone (). In different vegetation zones, the plant functional traits in steppe zone were greatest, except LTD (0.04 mg mm−3) and RTD (20.32 mg mm−3) with the lowest values. We found that arbor, shrub, and grass in different vegetation zones were significant difference (). For arbor, the plant traits in forest zone were higher than in forest-steppe zone (except SLD and RTD). For shrub, the plant traits in forest zone were lower than forest-steppe zone (except SLA and RNC). For grass, there were no significant difference between forest and forest-steppe zone, but both of them were lower than steppe zone.
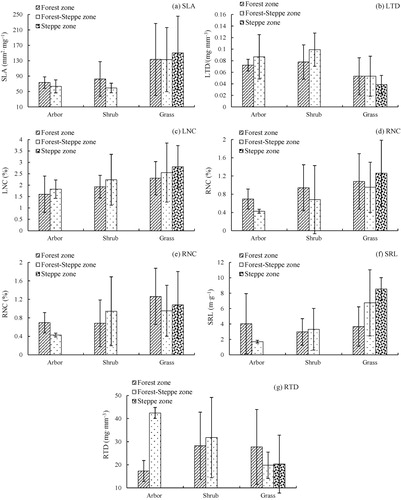
Table 5. The distribution of plant functional traits in different vegetation zone.
Soil microbial biomass distribution
As shown, the soil microbial biomass in steppe zone has significant difference with forest and forest-steppe zone, as soil profile depth increases, the concentrations of soil microbial biomass have decreased. The concentrations of Cmic and Nmic in different vegetation zones were ranked in the following order: forest-steppe zone > forest zone > steppe zone. In the surface layer, Cmic in steppe zone was just account for 48% (forest zone) and 44% (forest-steppe zone), and Nmic was occupy with 36% and 33%. The order of soil microbial biomass phosphorus (Pmic) was: steppe zone > forest-steppe zone > forest zone. On further analyzing (), we discovered that the soil microbial biomass in forest zone was mostly higher than forest-steppe (arbor). For shrub, there was no significant difference between forest and forest-steppe zone, except the Nmic in 10–30 cm of forest-steppe zone that was obviously lower than forest zone. And for grass, the soil microbial biomass in forest-steppe zone was greatest, except Pmic in 10–30 mm that ranked in the order: forest zone > forest-steppe zone > steppe zone.
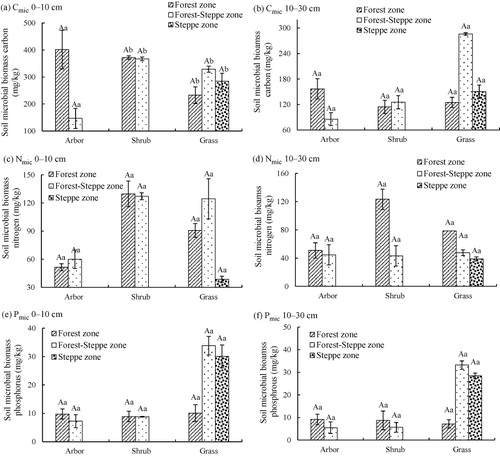
Table 6. The distribution of soil microbial biomass in different vegetation zones.
The relationship among soil microbial biomass, plant functional traits, and soil properties
Leaf traits such as specific leaf area (SLA), leaf lifespan, leaf concentration (LNC), photosynthetic capacity per unit leaf, and dark respiration rate are correlated with each other (Reich et al. Citation1997) which make some difficult to study the relationship between plant functional traits and the other related factors. So when we do the study on the correlation between soil properties, soil microbial biomass, and plant functional traits, simple correlation analysis just served as the reference, it cannot reflect the substance relationship between two variations. Therefore, we use canonical correlation analysis to discuss the relationship among soil microbial biomass, soil properties, and plant functional traits.
The relationship between plant functional traits and soil microbial biomass
The correlation coefficients of canonical in the process were higher than any correlation coefficients of plant functional traits and soil microbial biomass individual which illustrated that comprehensive canonical correlation was effective analysis than simple correlation. As shown, there is a significant relationship between soil microbial biomass and plant functional traits (canonical correlations were 0.834, 0.592, and 0.395). Two groups of canonical variables would explain the relationship between two variations which the Chi-square tests were displayed significant (50.728 and 53.609). U1 and U2 represent the linear combination of plant functional traits after canonical correlation analysis. In the series of U1, the capacity of RTD was greatest (1.615), followed by RNC (1.432) and LNC (0.852). V1 and V2 were the linear combination of soil microbial biomass, Nmic with the highest capacity (1.621), followed by Cmic (1.178). In the second canonical variable (U2 and V2), RNC (1.616), LNC (0.817), and Cmic (1.251) have the higher capacities. Thus, the result showed that RTD, RNC, LNC of plant functional traits were related to Cmic and Nmic of soil microbial biomass.
Table 7. The canonical correlation analysis between plant functional traits and soil microbial biomass.
The relationship between soil properties and plant functional traits
As the transmitter of plant and soil micro-organism, soil properties influence plant functional traits and soil microbial biomass in the direct way. After canonical correlation analysis, there is a significant relationship between plant functional traits and soil microbial biomass. As shown, the capacities of soil bulk density (1.531), total nitrogen (0.622) in U1 and leaf density (1.005), root nitrogen (0.959), SRL (0.755), and fine root density (2.419) in V1 were higher than the others. In the second canonical variable, except Av-P, NO3-N−, SLA, and leaf nitrogen have the lower capacities. Thus, the result showed that SM, soil bulk density (BD), SOC, TN, and NH4-N+of soil properties have the definite relationship with LTD, LNC, RTD, and SRL. As shown, soil microbial biomass was significantly related with soil properties. The SOC (0.583) and TN (0.547) in U1 and Cmic and Nmic in V1 have greater capacities. The relationship between soil microbial biomass and soil properties reflects the correlation of carbon and nitrogen between soil and soil micro-organism.
Table 8. The canonical correlation analysis between plant functional traits and soil properties.
Discussion
The distribution of plant function traits in different vegetation zones and plant growth forms
Environmental gradient classified the Yanhe catchment into three vegetation zones that have their own interval annual precipitation and temperature. The forest zone with the highest annual MAP (490–510 mm and >510 mm) and MAT (10.01°C), favorite hydrothermal condition made the forest zone with greater LA, DW, SLA and lower LW, LT, LED. As the transition from forest to forest-steppe and to steppe, the MAP and MAT were gradually decreased. By comparison, steppe zone is the relative arid region that with different functional traits. The herbaceous plant in steppe zone has the higher efficiency water application and drought resistance ability; the LNC was related with water application; the LT, LA, SLA, and LTD were correlated with drought resistance ability (Comstock & Ehleringer Citation1992). Vogan and Sage (Citation2011) indicated the increasing leaf nitrogen concentration would improve plant water application. Cunningham et al. (Citation1999) point out that the thick leaf epidermis, small leaf area, and lower SLA would benefit for water stress adaptation; the lower leaf dry weight and density are used for defense protection building (Fonseca et al. Citation2000). The moisture maintains strategy was formed by the combined actions of LNC, SLA, and LTD. In addition, SRL is the indicator that reflects physiological function of fine root, which impact the ability of nutrient and moisture absorption. The herbaceous plants with enormous root tissue (Craine et al. Citation2001) have greater RTD and SRL (Eissenstat et al. Citation2000) due to the powerful ability that obtains soil nutrient and moisture.
With the different plant functional traits among the vegetation zones, plant growth forms also have some difference. Except the LTD, the plant functional traits of herbaceous plant were greater than ligneous plants. It indicated that the 1/SLA has the equilibrium relation to leaf lifespan; the leaf economic spectrum was changed from high SLA, short leaf lifespan (herbaceous) to the lower SLA and long leaf lifespan (ligneous; Wright et al. Citation2004). The greater SLA that herbaceous have caused by the higher LNC and rapid gas exchange rate that herbaceous with. In the other hand, the difference of LNC, RNC in herbaceous and ligneous plants were depended on the different environmental nutrient allocation strategy. Due to the short life cycles, most nutrients that ligneous plants obtained are used for rapid plant growth, which make plant with high photosynthetic capacity and nutrient utilization (Wright et al. Citation2004). However, the arbor and shrub (ligneous) always use more biomass and mineral nutrients for defense protection building, and accumulated photosynthetic products for next year’s growth and overwintering. That is the reason why the nitrogen allocated in the organs of ligneous plant were much lower than herbaceous (Hikosaka et al. Citation1998).
The distribution of soil microbial biomass in different vegetation zones and plant growth forms
Vegetation restoration has a positive impact on the soil microbial biomass (Sparling et al. Citation1994; Sharma et al. Citation2004). In the current study, Cmic and Nmic in forest-steppe zone were greatest, and they were lowest in steppe zone. Although some research indicated that forest is the favorite type for ecological development, the Yanhe catchment is the special watershed in Loess Plateau that is influenced by topography, climate, and river system. The reasons are as follows: first, compared with forest and steppe zone, the plant of forest-steppe zone has the favorite phytocenosium structure and abundant species diversity. As shown, the area of forest occupied with the small proportion, the types of forest included with a large number of secondary forest, new manmade forest and a few numbers of natural forest, but the ages of stand is too old. The conditions of forest were not benefit for soil microbial biomass accumulation. The temperature, rainfall, and river system in forest-steppe zone were benefit for grass and shrub plant growing. Compared with forest, the biomass of grass and shrub were abundant. The large amount of litter returning provides enough carbon and nitrogen source for soil micro-organism activity. The shrub and undergrowth herb make further effect to intercept rainfall and reduce surface runoff. Soil water storage and preservation offer the favorite habitat conditions for micro-organism growing and breeding. Second, the forest-steppe zone has the preferable soil structure that improves micro-organism activity (Nsabimana et al. Citation2004). The forest-steppe zone combined the advantages of forest and steppe zone, soil structure and nutrition that come from litter decomposition and root tissue which change soil microflora. The root issue is an important element of soil structure, root exudate and residue accumulation changed soil structure and nutrition in a large scale. The biomass of herbaceous plant in steppe zone was concentrated in the underground. With the abundant fine root tissue, abroad distribution and rapid ecological turnover rate, soil organic matter would increase by herbaceous transiting from dead root tissue and root exudate. That is the reason why soil organic carbons in forest soil always enrich in the surface soil (Persson & Stadenberg Citation2009; Citation2010). Even so, soil microbial biomass in steppe zone was significantly lower than forest and forest-steppe zone. The reasons are as follows: first, the above-ground biomass is the primary carbon and nitrogen sources for soil micro-organism. Second, herbaceous plant in the growing period has competitive relation with soil micro-organism (Fitter et al. Citation1998). Alexander indicated that soil microflora is divided into two parts: rapid growth form and slow growth form. The source and nutrition that rapid growth micro-organism requires is from environment, but this supplement is uncertainty and liable to consume. Thus, rapid growth form always appears in the condition with sufficient outside source; the quantity of micro-organism would decrease when the nutrition was exhausted. However, the characteristics of slow growth forms are using refractory organics of plant residue or the other ingredient that is hard to decompose in microbial cell as the nutrition source. The nutrition is difficult to utilize which makes the slow growth micro-organism to survive for long time. But they are growing slowly and the quantity has no significant change. In the peak period of plant growth, soil organic carbon and nitrogen become to the complete material for plant root and soil micro-organism requirement. In this equilibrium relationship, if soil carbon and nitrogen that plant required more, that soil micro-organism obtained changed little (Fornara & Tilman Citation2008). When this condition appears, most soil microflora will be slow growth forms.
Microbial biomass phosphorus has been reported to make a significant contribution to the plant-available P pools in soil (Guerra et al. Citation1995; Wang et al. Citation2004). The amount of P stored in the soil microbial biomass is generally larger than its content in the above-ground plant biomass. It indicated that biomass tends to contain a higher phosphorus concentration in soils under permanent grass than in arable soils. Just in soil that had been under deciduous woodland which almost for approximately 100 years, the microbial biomass P concentration (4.7%) was found to be higher than in permanent grass (3.6–4.3%) in that study. It is similar with our result, Pmic in steppe zone was largest, and the concentrations of grass in steppe and forest-steppe zone were significantly greater than it was in forest zone.
In the current study, by examining different soil profile depths, soil microbial biomass C, N, and P levels in the upper soil layer (0–10 cm) were greater than in 10–30 cm. The favorable hydrothermal, ventilation conditions, and rapid litter turnover were beneficial for soil microbes’ growth and reproduction. As the soil profile depth increased, the habitat conditions of the soil micro-organisms get worsened that impacting the distribution of the soil microbial biomass.
The relationship among soil properties, microbial biomass, and plant functional traits
Soil microbial biomass and plant functional traits
Plant functional traits are defined based on the relation of plant and environment. As the critical factor, it is the description of plant attribute properties that severely impact on morphogenesis, survival, growth, and adaptive behavior (Reich et al. Citation2003), and reflect the ability to adapt the environment and evolution (the trade-off of different functional in plant internal) (Diaz et al. Citation2004). The interaction was shown between plant functional traits and soil microbial biomass. Plants, as the producer of ecology system, provide carbon source by litter decomposition and root exudate to soil micro-organism. As the decomposer, soil micro-organism decomposes soluble and non-soluble organic matter, translated them into the inorganic forms which was convenient for plant adsorption (Wall & Moore Citation1999). In our study, LNC, RNC, and RTD were related with Cmic and Nmic. The RTD influences the quality of root exudate and the quantity of fine root which decides the supplement of soil micro-organism. For the relationship between LNC, RNC, RTD, and soil microbial biomass, plant with high LNC always has powerful photosynthetic and respiration-based consumption, it needs rapid nutrient circulation to satisfy self-physiological activity. Therefore, the LNC, RNC, and RTD are affected by soil organic matter and nitrogen easily, and due to the soil micro-organism having the powerful ability to compete soil carbon and nitrogen (Hodgson et al. Citation1999). Due to weak competitive power, plant functional traits have not enough carbon and nitrogen supply. It indicated that for soil mineral nitrogen competition, root tissue and soil micro-organism would result in nitrification reduction. Soil nitrate and ammonium nitrogen would be decreased by nitrification and leaching which leads to the reduction of leaf nitrogen supplement (Zak et al. Citation2011).
Plant functional traits and the soil property
Vegetation restoration and reconstruction would improve soil quality. Soil, the foundation of plant influence its growing and developing in the direct way. Soil resource decided plant utilization strategy, in the process of plant growth, litter decomposition and root tissue improve soil properties, such as hydrothermal distribution, nutrition and structure, and then impact many ecological process. Plant and soil interacted and promoted each other that make the successive vegetation. Changes of plant functional traits were described as the difference of morphological structure and nutrition distribution in major organs (leaf, stem, root, and reproductive organ) (Westoby et al. Citation2002). The function, growth, and turnover rate of leaf and root were significantly related with soil property (Jackson et al. Citation1997). Soil impact with the distribution and development of vegetation community, at the same time vegetation community was reacted with soil. The interaction process improves habitat condition gradually which make community structure developed. The result of our study showed that SM, BD, TN, and SOC were significantly related with LNC, RTD, and SRL. The fine root tissue, as the important organ impacts the absorption and utilization rate of water and nutrient (Guo et al. Citation2004). The SRL and RTD influence RNC, the higher RTD and SRL, the greater RNC (Reich et al. Citation1997). As the important ecological factor, plant functional traits strongly influence the input and output of carbon and nitrogen in ecological system (Fornara & Tilman Citation2008). The plant traits decide the quantity, form, and persistence time of carbon and nitrogen import (Cornelissen & Thompson Citation1997; Hobbie Citation1992). In gramineous plants, the powerful root system would benefit for soil carbon sink, but due to the powerful respiration and metabolism that make a larger number of carbon runoff. With the characteristics, forest and shrub are able to improve soil temperature (spring and winter) and moisture that accelerated carbon and nitrogen decomposition and output. The hard decomposition litter slows down the circulation of carbon and nitrogen (Cornelissen et al. Citation2007).
Soil microbial biomass and soil property
Plant restoration conserved soil and water and reduce soil erosion. According to the interaction between plant and soil, the double ecological function would improve soil ecological characteristic and soil property. Soil micro-organism participates in ecology processes, such as soil nutrient cycling and organic matter decomposition that are the driving force in ecological cycle of material and energy (An et al. Citation2009). Soil micro-organism is the moderator of soil material circulation, and it is the part of soil organic carbon pool and available nutrient. Previous research has verified that soil microbial biomass C and N are good indicators to estimate the changing conditions in soil fertility resulted in land use changes and vegetation restoration (Aslam et al. Citation1999; Bolinder et al. Citation1999).We discovered that Cmic and Nmic were closely related to SOC and TN. The most litter accumulation and root exudate, the greater SOC and TN accumulation, the higher soil microbial biomass and stronger soil microbial activity.
Conclusions
Plant functional traits are the description of plant attribute properties which impacted by environment. Due to the different MAT and MAP, plant functional traits (except LTD and RTD) were greatest in steppe zone. The significant difference was existed between steppe zone and forest, forest zone for grass (life form). For the distributions of soil microbial biomass, with the quantity numbers biomass supply, high rate nutrient cycling, and favorite habit condition, the forest-steppe zone has the greatest Cmic and Nmic concentrations. Soil micro-organism and plant were related with medium of soil that influenced leaf nitrogen, root nitrogen, and fine root density of plant functional traits, which were related with root exudate and root tissue that effected by the concentration of SOC and total N, consequently influencing Cmic and Nmic. Soil microbial biomass in forest-steppe zone shown the favorite condition which result in enrich source supplement that helps in plant growth and development. The characteristics of phytocenosium and plant community structure that forest-steppe zone have are the crucial factors that promote plant succession.
Funding
This study was supported by the National Natural Sciences Foundation of China [41171226, 41271297], the Program for New Century Excellent Talents in University [NCET-12-0479] and the Foundation of Youths Teacher by Northwest A& F University.
Additional information
Funding
Related Research Data
References
- An SS, Huang YM, Zheng FL. 2009. Evaluation of soil microbial indices along a revegetation chronosequence in grassland soils on the Loess Plateau, Northwest China. Appl Soil Ecol. 41:286–292. 10.1016/j.apsoil.2008.12.001
- Aslam T, Choudhary MA, Saggar S. 1999. Tillage impacts on soil microbial biomass C, N and P, earthworms and agronomy after two years of cropping following permanent pasture in New Zealand. Soil Till Res. 51:103–111. 10.1016/S0167-1987(99)00032-X
- Bolinder MA, Angers DA, Gregorich EG, Carter MR. 1999. The response of soil quality indicators to conservation management. Can J Soil Sci. 79:37–45. 10.4141/S97-099
- Comstock JP, Ehleringer JR. 1992. Correlating genetic-variation in carbon isotopic composition with complex climatic gradients. Proc Natl Acad Sci USA. 89:7747–7751. 10.1073/pnas.89.16.7747
- Cornelissen JHC, Thompson K. 1997. Functional leaf attributes predict litter decomposition rate in herbaceous plants. New Phytol. 135:109–114. 10.1046/j.1469-8137.1997.00628.x
- Cornelissen JHC, van Bodegom PM, Aerts R, Callaghan TV, van Logtestijn RSP, Alatalo J, Chapin FS, Gerdol R, Gudmundsson J, Gwynn-Jones D, et al. 2007. Global negative vegetation feedback to climate warming responses of leaf litter decomposition rates in cold biomes. Ecol Lett. 10:619–627. 10.1111/j.1461-0248.2007.01051.x
- Craine JM, Froehle J, Tilman GD, Wedin DA, Chapin FS. 2001. The relationships among root and leaf traits of 76 grassland species and relative abundance along fertility and disturbance gradients. Oikos. 93:274–285. 10.1034/j.1600-0706.2001.930210.x
- Cunningham SA, Summerhayes B, Westoby M. 1999. Evolutionary divergences in leaf structure and chemistry, comparing rainfall and soil nutrient gradients. Ecol. Monogr. 69:569–588. 10.1890/0012-9615(1999)069[0569:EDILSA]2.0.CO;2
- Diaz S, Cabido M. 1997. Plant functional types and ecosystem function in relation to global change. J Veg Sci. 8:463–474. 10.2307/3237198
- Diaz S, Cabido M, Casanoves F. 1998. Plant functional traits and environmental filters at a regional scale. J Veg Sci. 9:113–122. 10.2307/3237229
- Diaz S, Hodgson JG, Thompson K, Cabido M, Cornelissen JHC, Jalili A, Montserrat-Marti G, Grime JP, Zarrinkamar F, Asri Y, et al. 2004. The plant traits that drive ecosystems: evidence from three continents. J Veg Sci. 15:295–304. 10.1111/j.1654-1103.2004.tb02266.x
- Eissenstat DM, Wells CE, Yanai RD, Whitbeck JL. 2000. Building roots in a changing environment: implications for root longevity. New Phytol. 147:33–42. 10.1046/j.1469-8137.2000.00686.x
- Fitter AH, Graves JD, Self GK, Brown TK, Bogie DS, Taylor K. 1998. Root production, turnover and respiration under two grassland types along an altitudinal gradient: influence of temperature and solar radiation. Oecologia. 114:20–30. 10.1007/s004420050415
- Fonseca CR, Overton JM, Collins B, Westoby M. 2000. Shifts in trait-combinations along rainfall and phosphorus gradients. J Ecol. 88:964–977. 10.1046/j.1365-2745.2000.00506.x
- Fornara DA, Tilman D. 2008. Plant functional composition influences rates of soil carbon and nitrogen accumulation. J Ecol. 96:314–322. 10.1111/j.1365-2745.2007.01345.x
- Guerra JGM, Dafonseca MCC, Dealmeida DL, Depolli H, Fernandes MS. 1995. Phosphorus-content in the soil microbial biomass under Brachiaria-Decumbens Stapf. Pesquisa Agropecuaria Brasileira. 30:543–551.
- Guo DL, Mitchell RJ, Hendricks JJ. 2004. Fine root branch orders respond differentially to carbon source-sink manipulations in a longleaf pine forest. Oecologia. 140:450–457. 10.1007/s00442-004-1596-1
- Hikosaka K, Hanba YT, Hirose T, Terashima I. 1998. Photosynthetic nitrogen-use efficiency in leaves of woody and herbaceous species. Funct Ecol. 12:896–905. 10.1046/j.1365-2435.1998.00272.x
- Hobbie SE. 1992. Effects of plant-species on nutrient cycling. Trends Ecol Evol. 7:336–339. 10.1016/0169-5347(92)90126-V
- Hodgson JG, Wilson PJ, Hunt R, Grime JP, Thompson K. 1999. Allocating C-S-R plant functional types: a soft approach to a hard problem. Oikos. 85:282–294. 10.2307/3546494
- Hooper DU, Bignell DE, Brown VK, Brussaard L, Dangerfield JM, Wall DH, Wardle DA, Coleman DC, Giller KE, Lavelle P, et al. 2000. Interactions between aboveground and belowground biodiversity in terrestrial ecosystems: patterns, mechanisms, and feedbacks. Bioscience. 50:1049–1061. 10.1641/0006-3568(2000)050[1049:IBAABB]2.0.CO;2
- Hooper DU, Chapin FS, Ewel JJ, Hector A, Inchausti P, Lavorel S, Lawton JH, Lodge DM, Loreau M, Naeem S, et al. 2005. Effects of biodiversity on ecosystem functioning: a consensus of current knowledge. Ecol Monogr. 75:3–35. 10.1890/04-0922
- Jackson RB, Mooney HA, Schulze ED. 1997. A global budget for fine root biomass, surface area, and nutrient contents. Proc Natl Acad Sci USA. 94:7362–7366. 10.1073/pnas.94.14.7362
- Kushwaha CP, Tripathi SK, Singh KP. 2000. Variations in soil microbial biomass and N availability due to residue and tillage management in a dryland rice agroecosystem. Soil Till Res. 56:153–166. 10.1016/S0167-1987(00)00135-5
- Ladd JN, Amato M, van Veen HA. 2004. Soil microbial biomass: its assay and role in turnover of organic matter C and N. Soil Biol Biochem. 36:1369–1372. 10.1016/j.soilbio.2004.05.001
- Leishman MR, Westoby M. 1992. Classifying plants into groups on the basis of associations of individual traits evidence from Australian semiarid woodlands. J Ecol. 80:417–424. 10.2307/2260687
- Noble IR, Gitay H. 1996. A functional classification for predicting the dynamics of landscapes. J Veg Sci. 7:329–336. 10.2307/3236276
- Nsabimana D, Haynes RJ, Wallis FM. 2004. Size, activity and catabolic diversity of the soil microbial biomass as affected by land use. Appl Soil Ecol. 26:81–92. 10.1016/j.apsoil.2003.12.005
- Pascual JA, Garcia C, Hernandez T, Moreno JL, Ros M. 2000. Soil microbial activity as a biomarker of degradation and remediation processes. Soil Biol Biochem. 32:1877–1883. 10.1016/S0038-0717(00)00161-9
- Persson HA, Stadenberg I. 2009. Spatial distribution of fine-roots in boreal forests in eastern Sweden. Plant Soil. 318:1–14. 10.1007/s11104-008-9811-1
- Persson HA, Stadenberg I. 2010. Fine root dynamics in a Norway spruce forest (Picea abies (L.) Karst) in eastern Sweden. Plant Soil. 330:329–344. 10.1007/s11104-009-0206-8
- Reich PB, Buschena C, Tjoelker MG, Wrage K, Knops J, Tilman D, Machado JL. 2003. Variation in growth rate and ecophysiology among 34 grassland and savanna species under contrasting N supply: a test of functional group differences. New Phytol. 157:617–631. 10.1046/j.1469-8137.2003.00703.x
- Reich PB, Walters MB, Ellsworth DS. 1997. From tropics to tundra: global convergence in plant functioning. Proc Natl Acad Sci USA. 94:13730–13734. 10.1073/pnas.94.25.13730
- Sharma P, Rai SC, Sharma R, Sharma E. 2004. Effects of land-use change on soil microbial C, N and P in a Himalayan watershed. Pedobiologia. 48:83–92. 10.1016/j.pedobi.2003.09.002
- Sparling GP, Hart PBS, August JA, Leslie DM. 1994. A comparison of soil and microbial carbon, nitrogen, and phosphorus contents, and macro-aggregate stability of a soil under native forest and after clearance for pastures and plantation forest. Biol Fert Soils. 17:91–100. 10.1007/BF00337739
- Spehn EM, Joshi J, Schmid B, Diemer M, Korner C. 2000. Above-ground resource use increases with plant species richness in experimental grassland ecosystems. Funct Ecol. 14:326–337. 10.1046/j.1365-2435.2000.00437.x
- Tilman D. 1996. Biodiversity: population versus ecosystem stability. Ecology. 77:350–363. 10.2307/2265614
- Tilman D, Reich PB, Knops J, Wedin D, Mielke T, Lehman C. 2001. Diversity and productivity in a long-term grassland experiment. Science. 294:843–845. 10.1126/science.1060391
- Tilman D, Wedin D, Knops J. 1996. Productivity and sustainability influenced by biodiversity in grassland ecosystems. Nature. 379:718–720. 10.1038/379718a0
- Vogan PJ, Sage RF. 2011. Water-use efficiency and nitrogen-use efficiency of C-3-C-4 intermediate species of Flaveria Juss. (Asteraceae). Plant Cell Environ. 34:1415–1430. 10.1111/j.1365-3040.2011.02340.x
- Walker BH. 1992. Biodiversity and ecological redundancy. Conserv Biol. 6:18–23. 10.1046/j.1523-1739.1992.610018.x
- Wall DH, Moore JC. 1999. Interactions underground – soil biodiversity, mutualism, and ecosystem processes. Bioscience. 49:109–117. 10.2307/1313536
- Wang FE, Chen YX, Tian GM, Kumar S, He YF, Fu QL, Lin Q. 2004. Microbial biomass carbon, nitrogen and phosphorus in the soil profiles of different vegetation covers established for soil rehabilitation in a red soil region of southeastern China. Nutr Cycl Agroecosys. 68:181–189. 10.1023/B:FRES.0000017470.14789.2a
- Westoby M, Falster DS, Moles AT, Vesk PA, Wright IJ. 2002. Plant ecological strategies: some leading dimensions of variation between species. Ann Rev Ecol System. 33:125–159. 10.1146/annurev.ecolsys.33.010802.150452
- Wright IJ, Groom PK, Lamont BB, Poot P, Prior LD, Reich PB, Schulze ED, Veneklaas EJ, Westoby M. 2004. Leaf trait relationships in Australian plant species. Funct Plant Biol. 31:551–558. 10.1071/FP03212
- Wright IJ, Reich PB, Cornelissen JHC, Falster DS, Groom PK, Hikosaka K, Lee W, Lusk CH, Niinemets U, Oleksyn J, et al. 2005. Modulation of leaf economic traits and trait relationships by climate. Global Ecol Biogeo. 14:411–421. 10.1111/j.1466-822x.2005.00172.x
- Zak DR, Pregitzer KS, Burton AJ, Edwards IP, Kellner H. 2011. Microbial responses to a changing environment: implications for the future functioning of terrestrial ecosystems. Fung Ecol. 4:386–395. 10.1016/j.funeco.2011.04.001
- Zheng CH, Kang YH, Yao SM, Yan CZ, Sun ZQ. 2004. Method of root analysis using GIS technology. Transaction of the CSAE. 20:181–183. 10.1016/j.funeco.2011.04.001