
Abstract
Tolerance of four cool-season turfgrass species sheep fescue (Festuca ovina), perennial ryegrass (Lolium perenne), colonial bentgrass (Agrostis tenuis) and rough bluegrass (Poa trivialis) to SO2 was studied by investigating their injury and physiological responses under SO2 stress for 14 days. Results showed that sheep fescue and perennial ryegrass had better SO2 tolerance than rough bluegrass and colonial bentgrass. Chlorophyll a and carotenoid contents were significantly higher in the SO2-tolerant turfgrass species (sheep fescue and perennial ryegrass) than in the SO2-sensitive turfgrass species (rough bluegrass and colonial bentgrass). Relatively lower levels of reactive oxygen species (ROS), malondialdehyde, and electrolyte leakage (EL) were observed in SO2-tolerant turfgrass species. Gradually increased antioxidant enzyme activities and proline content in SO2-tolerant turfgrass species could counteract such damages and harmful effects caused by ROS and EL, respectively. Sulfite reductase played an important role in sulfur metabolism and subsequently reduced oxidative pressure on SO2-tolerant turfgrass species.
Introduction
With the rapid development of both economy and manufacturing industries, sulfur dioxide (SO2) is becoming the most common and important air pollutant in China, especially in the industrial areas and big cities (He Citation2009; D'Amato et al. Citation2010). Generally, SO2 influences the biological systems of plant through acidification and oxidation. The acidification can directly lead to the phaeophytinization through substituting Mg2+ by H+ in chlorophyll. The oxidation of SO2 is the dominant process, which causes a series of damages to plants, such as pigment bleaching and the efflux of malondialdehyde (MDA) and potassium (Kong et al. Citation1999). The atmospheric SO2 can be absorbed by the foliage and dissolved in the cellular cytoplasm to form H2SO3 and HSO3− (Singh et al. Citation2012). These sulfite and bisulfite will be enzymatically or non-enzymatically oxidized to SO42– and then transported into the vacuole where they are poorly accessible for remobilization (Yang et al. Citation2006). During the oxidation process, superoxide radicals, hydroxyl radicals, and other free radicals are produced, which can influence many aspects of plant physiology, including biosynthesis, growth and development, energy consumption, etc. (Tan & Liu Citation1981; Heyneke et al. Citation2012).
With the diversified development of urban landscaping, turfgrass industry has entered into a fast development period in China (Guo et al. Citation2011). Turfgrass is widely used as urban landscaping plant in the modern cities due to its multiple functions. Turf surfaces can decrease the dust and noise, absorb the toxic gas, mitigate the violet radicalization, and reduce the urban heat island effect. Additionally, turfgrass adds aesthetical value to the environment and provides playing ground for entertainment and leisure (Jim and Chen Citation2009; Pickett et al. Citation2011). Turfgrass species display different tolerances to air pollutants. Some species can survive in severe air-polluted conditions, and return to normal growth level once the air pollutants are eliminated. However, others are sensitive to air pollutant, which can be damaged at lower concentration of air pollutant and cannot recover even if the air pollution is eliminated (Honour et al. Citation2009; Leung et al. Citation2011).
There are two types of turfgrasses: warm-season and cool-season. Warm-season grasses are primarily used in warm region (such as South China) and cool-season grasses are the dominant types used in cold region (such as North China). Both warm- and cool-season species can be cultivated in transition region (such as Central China). Compared with warm-season grasses, cool-season grasses turn green faster in the spring and stay green longer into autumn due to their preference for cooler temperatures. Tolerance to SO2 of grass species has been briefly studied by estimating changes in growth, injury rate, and symptoms (Brennan & Halisky Citation1970; Ayazloo & Bell Citation1981). Recently, we compared the physiological responses of warm-season turfgrass bermudagrass (Cynodon dactylon) accessions from Southwest China to sulfur dioxide (Li et al. Citation2014). However, tolerance and physiological responses of cool-season turfgrasses to sulfur dioxide have not been reported in details till now. In order to achieve good afforestation and landscaping effects, selection of cool-season turfgrass species with strong resistance to air pollution for use in polluted urban and industrial areas is practically desired in North and Central China in winter.
Sheep fescue (Festuca ovina), perennial ryegrass (Lolium perenne), colonial bentgrass (Agrostis tenuis), and rough bluegrass (Poa trivialis) are the four typical cool-season turfgrass species, which naturally distribute in north and central provinces in China and are also used for landscaping widespread. In the present study, we studied the physiological responses of these four cool-season turfgrass species to sulfur dioxide stress. This study gained some insights into the mechanisms of cool-season turfgrass coping with SO2 toxicity, and provided useful guidelines for selection of turfgrass species suitable for use in SO2 polluted urban and industrial areas in cool and transition regions.
Materials and methods
Plant material
Four cool-season turfgrass species, including sheep fescue, perennial ryegrass, colonial bentgrass, and rough bluegrass, provided by the Beijing office of the Netherlands Royal Barenbrug Group, were used as research objects in this study. Grass seeds were surface disinfected with 0.05% KMnO4 for 20 min, and sowed in large plastic pots (29 cm in diameter at the top, 17 cm in diameter at the bottom, and 22 cm in height) filled with sandy loam soil supplemented with organic fertilizer on April 2013, and 20 pots were used for each turfgrass species. The resulting seedlings were placed in outdoor conditions with timely watering, and monthly weeding and fertilizing.
Experimental design
The experiment was carried out at the Teaching Practice Base of the College of Landscape Architecture (103 49′ 58″ E, 30° 41′ 48″ N, 550 m a.s.l.), Sichuan Agricultural University, Wenjiang District, Sichuan Province, China. Average annual precipitation, annual temperature, and relative air humidity in this area are 972 mm, 15.9°C, and 84%, respectively. After one-month outdoor growth, 15 pots of grass plants with approximately the same growing stage were selected for SO2 treatment. Five levels of sulfur contents, including CK (0 mg/m3), S1 (1.30 mg/m3), S2 (2.60 mg/m3), S3 (3.90 mg/m3), and S4 (5.20 mg/m3), were applied in this study. Grasses were fumigated with incense containing sulfur in artificial fumigation chamber (0.289 m3, 85 × 85 × 40 cm) for 3 h per day over 14 days. The day when SO2 fumigation started was designated as day 0. Treatment was applied to three replicated pots for each turfgrass species for each SO2 concentration. The fumigation chamber is an enclosed automatic cabinet, and SO2 concentration is monitored by a Z-1300 gas detector (Environmental Sensors Co., Boca Raton, FL, USA). To increase the uniformity of gaseous mixture, a fan was attached to the ceiling to mix the SO2 in the chamber. Leaves 2 cm above the soil from grass plants were collected before SO2 treatment and after 14-day treatment with SO2 and brought to laboratory for physiological analysis. Leaves from the same turfgrass species lacking SO2 treatment served as negative control. Foliar injury was scored by assessing the visible leaf damage excluding senescent leaves after 14-day SO2 fumigation treatment.
Photosynthetic pigment analysis
Photosynthetic pigments from turfgrass leaves were extracted as described by Lichtenthaler and Wellburn (Citation1983) with modification. Fresh leaves were ground in 2 ml of 80% (v/v) acetone and ethyl alcohol (1:1) using a mortar and pestle, and then filtered through 0.45 μm filter paper. Absorbance of the resulting extracts was measured at three wavelengths 663, 646, and 470 nm for chlorophyll a (Chl a), chlorophyll b (Chl b), and carotenoids (Car), respectively, using a ultraviolet-visable spectrophotometer Model 723PC (Jinghua Instruments, Shanghai, China). The contents of pigments were calculated according to the adjusted extinction coefficients (Lichtenthaler & Wellburn Citation1983). Total chlorophyll contents were obtained from the sum of Chl a + Chl b.
Estimation of H2O2 content and O2‾˙ generation rate
Fresh leaves were ground in liquid nitrogen using a mortar and pestle and then homogenized in extraction buffer (50 mM sodium phosphate buffer, pH 7.8). The homogenate was centrifuged at 15,000×g for 10 min at 4°C, and the supernatant was used for analyses of H2O2 content and O2‾˙ generation rate. H2O2 content was determined according to the method described by Hu et al. (Citation2012). Briefly, 1.0 ml of the supernatant was thoroughly mixed with 1.0 ml of 0.1% titanium sulfate (w/v) in 20% H2SO4 (v/v) for 10 min. After centrifugation at 15,000×g for 10 min at room temperature, the absorbance of the supernatant was measured at 410 nm. O2‾˙ generation rate was determined according to the method described by Elstner and Heupel (Citation1976). Briefly, 1 ml of the supernatant was mixed with 1.0 ml of 65 mM sodium phosphate buffer (pH 7.8), 0.1 ml of 10 mM hydroxylammonium chloride, 0.1 ml of 7.5 mM xanthine, and 0.3 ml xanthine oxidase (0.2 unit/ml), and incubated at 25°C for 20 min. Then 0.5 ml of 1.0% (w/v) a-naphthylamine and 0.5 ml of 19 mM sulfanilic acid were added to 0.5 ml of above reaction mixture, and incubated at 25°C for 20 min. The absorbance of the mixture was measured at 530 nm.
Protein extraction and enzyme activity assay
Fresh leaves were ground and extracted with 5 ml of 0.1 M sodium phosphate buffer (pH 6.8) containing 1 mM ethylenediaminetetraacetate, 1 mM dithiotreitol, and 2% (w/v) polyvinylpyrrolidone. The homogenate was centrifuged at 15,000×g for 15 min at 4°C, and the supernatant was used for enzyme activity. Soluble protein content in the supernatant was determined using the modified Bradford (Citation1976) method with bovine serum albumin as protein standard.
Superoxide dismutase (SOD; EC 1.15.1) activity was measured spectrophotometrically at 560 nm based on inhibition of the photochemical reduction of nitroblue tetrazolium (Beauchamp & Fridovich Citation1971). Catalase (CAT; EC 1.11.1.6) activity was measured by following the decomposition of H2O2 at 240 nm according to the method described by Aebi (Citation1984). Peroxidase (POD; EC 1.11.1.7) activity was recorded by measuring the increase of absorbance at 470 nm due to guaiacol oxidation as described by Curtis (Citation1971). Glutathione reductase (GR; EC 1.8.1.7) activity was determined by measuring the oxidation of nicotinamide adenine dinucleotide phosphate (NADPH) at 340 nm as described by Tanaka et al. (Citation1988). Glutathione S-transferase (GST; EC 2.5.1.18) activity was determined by measuring the conjugation of glutathione with 1-chloro-2,4-dinitrobenzene (Habig et al. Citation1974). Sulfite reductase (SiR; EC 1.8.99.1) activity was determined by the coupled SiR/OASTL assay with the addition of NADPH and tungstic acid (Brychkova et al. Citation2012). Sulfite oxidase (SO; EC 1.8.3.1) activity was determined by reduction of ferricyanide at 420 nm (Eilers et al. Citation2001).
Lipid peroxidation
Lipid peroxidation was determined by measuring the amount of MDA following the method described by Heath and Packer (Citation1968). Fresh leaves were ground and homogenized with 2 ml of 0.1% (w/v) trichloroacetic acid (TCA). The homogenate was centrifuged at 15,000×g for 20 min at 4°C, and the supernatant was used for lipid peroxidation analysis. A total of 4 ml of 0.5% (w/v) thiobarbituric acid in 20% (w/v) TCA was added to 1 ml of the supernatant. The mixture was incubated in hot water (95°C) for 30 min and cooled immediately on ice to stop the reaction and centrifuged at 15,000×g for 20 min. Absorbance was measured at 532 and 600 nm, and MDA content was estimated by subtracting the non-specific absorption at 600 nm from the absorption at 532 nm.
Determination of electrolyte leakage (EL) and osmoprotectants
For the EL assay, fresh leaves were rinsed for three times with deionized water to remove surface electrolytes, and then incubated in 10 ml of deionized water at 25°C with shaking for 6 h. The initial conductivity (C1) was determined using an electrical conductivity meter (Leici-DDS-307A, Shanghai INESA Scientific Instrument Co., Ltd., Shanghai, China). The samples were then boiled for 20 min and subsequently incubated at 25°C for 1 h. The total conductivity (C2) was determined using the Leici-DDS-307A conductivity meter. Ion leakage was calculated using the following equation:
Free proline was extracted from the fresh leaves and analyzed according to the method described by Bates et al. (Citation1973). Fresh leaves were homogenized and mixed with 3% (w/v) sulfosalicylic acid. The extracted solution was reacted with equal volumes of glacial acetic and ninhydrin reagent at 100°C for 1 h. The reaction was terminated by placing the tube in an ice bath, and the chromophore was measured at 520 nm.
Sulfur accumulation
For sulfur (S) content determination, the turbidimetric method described by Reyes-Díaz et al. (Citation2011) was applied. Biomass of whole plants were dried for 48 h, treated with 95% (w/v) magnesium nitrate, and then ashed at 500°C for 8 h. The ashed samples were digested in 10 ml of 2M HCl at 150°C for 1 h. After addition of barium chloride (BaCl2) and Tween-80 into the solution, its absorbance was immediately measured at 440 nm.
Statistical analysis
All data were presented as means ± SD from three replicates. Statistical analysis was performed by analysis of variance and least significant difference (LSD) test using the SPSS 18.0 (SPSS Inc., Chicago, IL). Significant difference was evaluated by LSD test at p < 0.05 level. Chart was created using the GraphPad Prism 5.0 (GraphPad Software, Inc., La Jolla, CA, USA).
Results
Foliar injury under SO2 stress condition
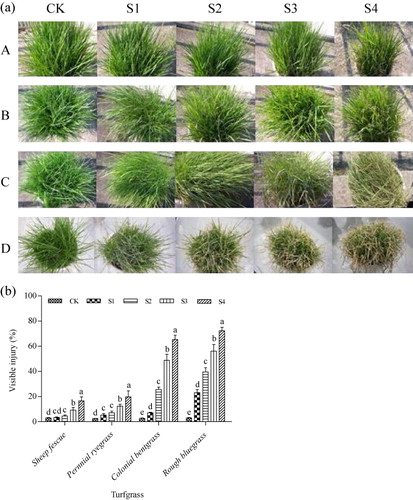
Injury symptoms appeared on turfgrass leaves under SO2 stress conditions after 14-day SO2 treatment (). The visible symptoms consisted of marginal, interval, and/or bifacial chlorosis and necrosis on fully expanded leaves. The necrotic areas were irregular, with colors varied from brown to white and occasionally black. Leave injury symptoms were influenced by both SO2 concentration and turfgrass species ( and ). At low SO2 concentration of S1–S2, effects of SO2 on leaves of sheep fescue and perennial ryegrass were not noticeable. At high SO2 concentration of S3–S4, although visible injury increased significantly along with the increase of SO2 concentration, the injury rates were relatively low (less than 20%) on leaves of both sheep fescue and perennial ryegrass (). However, significant effects of SO2 on leaves of colonial bentgrass and rough bluegrass were observed at low SO2 concentration of S1 and the injury degree significantly increased along with the increase of SO2 concentration from treatment S1–S4, especially on leaves of rough bluegrass (). The injury rates on leaves were more than 50% under SO2 treatment of S3 and nearly 70% under SO2 treatment of S4 on leaves of colonial bentgrass and rough bluegrass (). Especially, the turfgrass species of rough bluegrass almost withered or died at SO2 concentrations of S3 and S4 ().
Note: Mean values are presented with vertical error bars representing the standard deviations (n = 3). Different letters above the column within the same turfgrass species indicate significant differences among treatments (P < 0.05).
Effect of SO2 on photosynthetic pigment contents
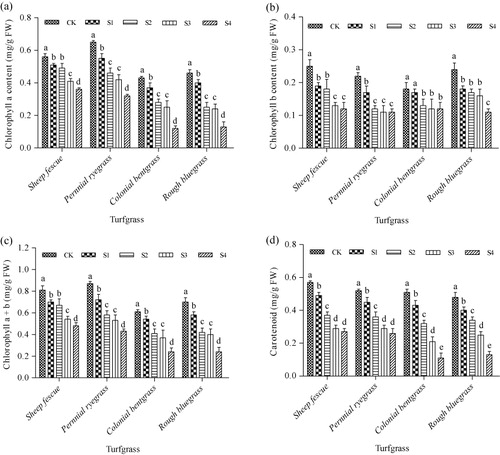
Contents of photosynthetic pigments in leaves of the four cool-season turfgrass species showed a decreasing trend along with the increase of SO2 concentration, but displayed different patterns with different pigment and grass species (). Chlorophyll a content in leaves of sheep fescue decreased in a low degree at low SO2 concentrations of S1 and S2 (). For the rest of three turfgrass species, significant decrease of chlorophyll a content appeared immediately from low SO2 concentration of S1. At the highest SO2 concentration of S4, chlorophyll a content decreased by 1.5, 2.0, 3.6, and 3.5-fold in leaves of sheep fescue, perennial ryegrass, colonial bentgrass, and rough bluegrass compared to their controls, respectively (). However, chlorophyll a contents in sheep fescue and perennial ryegrass plants maintained relatively higher levels compared to colonial bentgrass and rough bluegrass plants following S4 treatment. Chlorophyll b content decreased significantly under SO2 stress conditions, but displayed no further decrease along with the increase of SO2 concentration once it reached to a certain low content in leaves of sheep fescue, perennial ryegrass, and colonial bentgrass (). In leaves of rough bluegrass, significant decrease of chlorophyll b content appeared at low SO2 concentration of S1, and showed no significant differences from treatment of S1–S3, and then significantly decreased again from treatment of S3–S4 (). Content of total chlorophylls a + b showed a similar trend with chlorophyll a in all of the four cool-season turfgrass species under all SO2-treated conditions (). Decrease of carotenoid contents showed a similar pattern in leaves of sheep fescue and perennial ryegrass, and its content decreased significantly along with the increase of SO2 concentration from treatment of S1–S2, but did not decrease any further from treatment of S3–S4 (). In leaves of colonial bentgrass and rough bluegrass, carotenoid contents significantly decreased in a similar pattern along with the increase of SO2 concentration from S1 to S4. Carotenoid contents in leaves of sheep fescue and perennial ryegrass were much higher than those in leaves of colonial bentgrass and rough bluegrass under SO2-treated conditions of S3 and S4 ().
Note: Mean values are presented with vertical error bars representing the standard deviations (n = 3). Different letters above the column within the same turfgrass species indicate significant differences among treatments (P < 0.05).
Effect of SO2 on reactive oxygen species (ROS) generation and lipid peroxidation
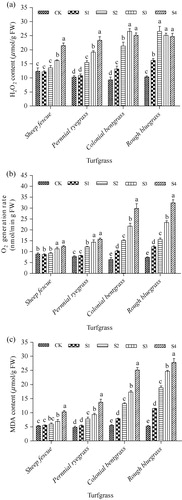
Exposure to SO2 for 14 days caused an increase in ROS generation in leaves of the four cool-season turfgrass species. H2O2 contents in leaves of sheep fescue and perennial ryegrass showed a similar pattern under SO2 stress conditions (). Overall, H2O2 contents did not show significant increase at low SO2 concentrations of S1 and S2, especially in leaves of sheep fescue, but showed an increasing trend when SO2 concentration increased from S2 to S4 in leaves of sheep fescue and from S1 to S4 in leaves of perennial ryegrass (). H2O2 contents significantly increased from low SO2 concentration of S1 in leaves of colonial bentgrass and rough bluegrass, and reached the highest content under SO2-treated condition of S3 in leaves of colonial bentgrass and S2 in leaves of rough bluegrass (). O2− generation rate did not show significant increase at low SO2 concentrations of S1 and S2 in leaves of sheep fescue and at low concentration of S1 in leaves of perennial ryegrass (). Although O2− generation rate increased significantly in leaves of sheep fescue and perennial ryegrass at high SO2 concentrations, their increasing degree was not high (about 1.4-fold and 2.0-fold increase, respectively) relatively to their controls. On the contrary, O2− generation rate increased significantly in leaves of colonial bentgrass and rough bluegrass from low SO2 concentration of S1, and gradually increased along with the increase of SO2 concentration. At the highest SO2 concentration of S4, O2− generation rate increased by 4.7-fold in leaves of colonial bentgrass and 4.4-fold in leaves of rough bluegrass, respectively, when they were compared with their controls (). The level of lipid peroxidation in SO2-treated grasses was determined according to the content of MDA in leaves of the four cool-season turfgrass species. As results, MDA contents did not increase significantly in leaves of sheep fescue and perennial ryegrass at low SO2 concentration, but increased significantly in leaves of both species at high SO2 concentrations (). However, MDA contents in leaves of colonial bentgrass and rough bluegrass increased significantly along with the increase of SO2 concentration from S1 to S4, displaying 4.6-fold increase in the former and 5.3-fold increase in the latter species, respectively, when they were compared with their controls ().
Note: Mean values are presented with vertical error bars representing the standard deviations (n = 3). Different letters above the column within the same turfgrass species indicate significant differences among treatments (P < 0.05).
Effect of SO2 on antioxidant enzyme activities
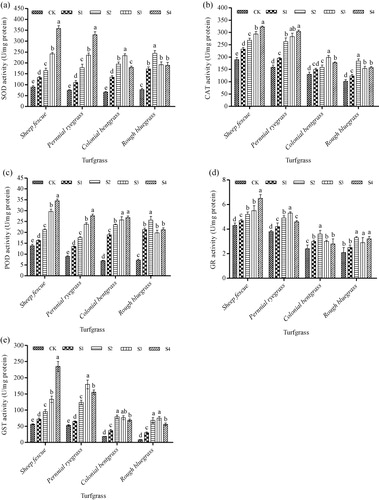
To address the relationship between the changes of ROS level and antioxidant enzyme activities, five antioxidant enzymes, including SOD, CAT, POD, GR, and GST, were determined (). Under control condition, CAT, POD, GR, and GST showed much higher enzyme activities in leaves of sheep fescue and perennial ryegrass than those in leaves of colonial bentgrass and rough bluegrass (–). Under SO2-treated conditions, enzyme activities of all of the five antioxidants increased, but displayed different patterns with turfgrass species and SO2 concentration. In leaves of sheep fescue and perennial ryegrass, enzyme activities of all of the five antioxidants increased gradually along with the increase of SO2 concentration from S1 to S4. However, the enzyme activities in leaves of colonial bentgrass and rough bluegrass significantly increased at low SO2 concentrations but did not increase or even decreased at high SO2 concentrations. SOD, CAT, GR, and GST showed much higher enzyme activities in leaves of sheep fescue and perennial ryegrass than in leaves of colonial bentgrass and rough bluegrass, especially for SOD and GST at high SO2 concentrations (–).
Note: Mean values are presented with vertical error bars representing the standard deviations (n = 3). Different letters above the column within the same turfgrass species indicate significant differences among treatments (P < 0.05).
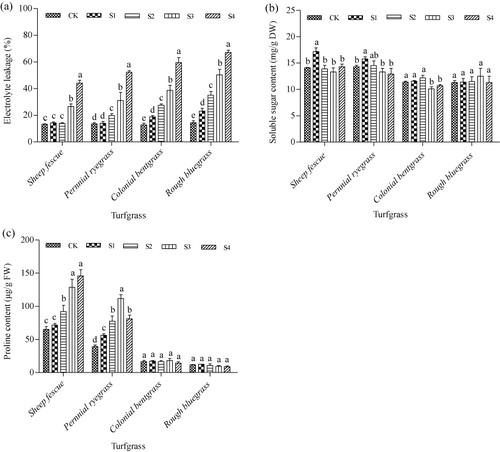
Effect of SO2 on EL and osmoprotectants
Membrane permeability was estimated by measuring EL using a conductivity meter. EL did not show significant difference in leaves of sheep fescue and perennial ryegrass at low SO2 concentrations, but increased significantly at high SO2 concentrations (). In leaves of colonial bentgrass and rough bluegrass, EL increased significantly from low SO2 concentration of S1 and showed a gradually increasing trend along with the increase of SO2 concentrations from S1 to S4. EL degree in leaves of colonial bentgrass and rough bluegrass were much higher than those in leaves of sheep fescue and perennial ryegrass. Changes of osmotic adjustment substances, including soluble sugars and proline, were measured in leaves of the four cool-season turfgrass species under SO2 stress conditions. After 14-day SO2 stress treatment, soluble sugar content remained steady in all of the four cool-season turfgrass species under all of the four SO2-treated conditions (). However, proline, an osmotic adjustment substance, showed different responses to SO2 stress in different turfgrass species (). Under SO2 stress conditions, proline contents showed no significant changes in leaves of colonial bentgrass and rough bluegrass, but displayed an increasing trend along with the increase of SO2 concentration in leaves of sheep fescue and perennial ryegrass, except for perennial ryegrass at SO2-treated condition of S4 ().
Note: Mean values are presented with vertical error bars representing the standard deviations (n = 3). Different letters above the column within the same turfgrass species indicate significant differences among treatments (P < 0.05).
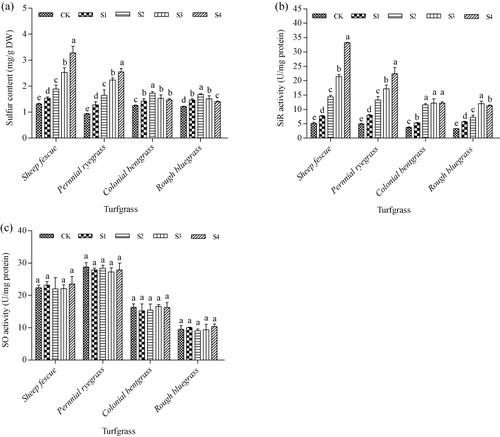
Effect of SO2 on sulfur content, and SiR and SO enzyme activities
Under the control conditions, no differences in sulfur contents were found in the four cool-season species (). After 14-day SO2 stress treatment, sulfur contents showed an increasing trend along with the increase of SO2 concentration from S1 to S4 in leaves of sheep fescue and perennial ryegrass. In leaves of colonial bentgrass and rough bluegrass, sulfur contents increased significantly at low SO2 concentrations and then decreased at high SO2 concentrations. Moreover, sulfur contents were much higher in leaves of sheep fescue and perennial ryegrass than those in leaves of colonial bentgrass and rough bluegrass at high SO2 concentrations of S3 and S4 (). At the highest SO2 concentration of S4, sulfur contents increased by 2.5-fold in leaves of sheep fescue and 2.7-fold in leaves of perennial ryegrass, respectively. However, sulfur contents in leaves of colonial bentgrass and rough bluegrass increased by less than 1.5-fold under all SO2-treated conditions (). SiR activities showed similar changes with sulfur content in all of the four cool-season turfgrass species under all SO2-treated conditions ( and ). In leaves of sheep fescue and perennial ryegrass, SiR activities increased by 6.5- and 4.6-folds, respectively, under the highest SO2 concentration of S4; however, its activities in leaves of colonial bentgrass and rough bluegrass increased by less than 3.5-fold under all SO2-treated conditions (). SO activities in all of the four cool-season turfgrass species showed no significant changes under any SO2-treated condition compared with their control without SO2 treatment (). However, SO activity levels in leaves of sheep fescue and perennial ryegrass were much higher than those in leaves of colonial bentgrass and rough bluegrass ().
Note: Mean values are presented with vertical error bars representing the standard deviations (n = 3). Different letters above the column within the same turfgrass species indicate significant differences among treatments (P < 0.05).
Discussion
Sulfur is an essential element for growth and physiological function of plants. Under normal conditions, it is absorbed and assimilated into organic sulfur compounds to participate various biochemical processes in plant cells. SO2 in the atmosphere can enter plant cells via their stomata during photosynthesis and respiration (Singh et al. Citation2012). After diffusion into mesophyll, sulfur is converted into sulfite and sulfate ions. Excessive accumulation of sulfate ions in leaf tissue will result in chronic injury, which is characterized by a general chlorotic appearance on leaves, or acute injury, which causes tissue death in marginal or intercostal areas of leaves (Darley & Middleton Citation1966). In the present study, injury of SO2 was observed on leaves of all of the four cool-season turfgrass species, but showed different injury degrees. Rough bluegrass and colonial bentgrass were sensitive to SO2 and visible injury immediately appeared on leaves at low SO2 concentration of S1. In comparison, only a small amount of yellow leaves was observed in sheep fescue and perennial ryegrass, even at the highest SO2 concentration. Photosynthetic pigments, especially the chlorophyll and carotenoids, play vital roles in absorbing and converting light energy into biochemical energy in the process of photosynthesis (Pilon et al. Citation2013). Consistent with injury on leaves, we observed that chlorophyll a, chlorophyll b, and carotenoid contents decreased under SO2-treated conditions in leaves of all of the four cool-season turfgrass species. However, the SO2-tolerant turfgrass species (sheep fescue and perennial ryegrass) showed much higher contents of chlorophyll a and carotenoids than the SO2-sensitive species (rough bluegrass and colonial bentgrass) at high SO2 concentrations. Chlorophyll a is considered as the primary pigment for photosynthesis in plants, and carotenoids are called as accessory pigment because they cannot transfer sunlight energy directly to the photosynthetic pathway but must pass their absorbed energy to chlorophyll (Lodish et al. Citation2012). Thereafter, chlorophyll a and carotenoids could be considered as indicators for SO2 tolerance.
In plant cells, ROS are inevitably and continuously generated as by-products in aerobic metabolism (Cha & Lee Citation2004). The amounts of ROS are moderate under normal condition, and cells suffer only mild oxidative stress under such condition. However, many exogenous stresses can greatly stimulate generation of ROS, such as hydrogen peroxide (H2O2), superoxide (O2−), and hydroxyl radical (HO−; Mohammed & Tarpley Citation2009), which disrupt physiological processes, and eventually result in cell death under severe stress conditions (Yan et al. Citation2003). Under such oxidative stress conditions, cell membrane lipids will be peroxidized to yield MDA (Xu & Huang Citation2009), which is usually considered as an indicator of oxidative-stress-related peroxidation of membrane lipids (Mahan & Mauget Citation2005). However, plants can scavenge excessive ROS by invoking the non-enzymatic (glutathione, ascorbate, α-tocopherol, and carotenoids) and antioxidant enzymatic defense system such as SOD, POD, and CAT (Darkó et al. Citation2009). In this study, we observed that ROS levels increased under SO2 stress conditions. As corresponding defendant responses, activities of antioxidant enzymes increased under such stress conditions. SOD catalyzes the dismutation reaction of O2−· into H2O2 and O2 (He et al. Citation2005), before H2O2 can be reduced to non-poisonous H2O and O2 by CAT and POD, thus preventing their destruction to the cell membrane by ROS (Xu & Huang Citation2009). Stress responses of antioxidant enzymes of SOD, CAT, and POD to SO2 were studied on a warm-season turfgrass C. dactylon in our previous study, and enzyme activities of three of them were increased under SO2 stress conditions (Li et al. Citation2014). In this study, we found that in addition to these three enzymes, GR and GST showed higher activities in all of the four cool-season turfgrass species under SO2 stress conditions. Strong up-regulated transcriptional responses of GSTs and GRs to SO2 were observed on grape berry (Giraud et al. Citation2012). More importantly, enzyme activities of the five antioxidants showed an increasing trend along with the increase of SO2 concentration in leaves of sheep fescue and perennial ryegrass. However, such defendant antioxidant responses in colonial bentgrass and rough bluegrass only appear at mild SO2 concentrations but not under high SO2 concentrations. Failure to scavenge excessive ROS by antioxidant enzymes in colonial bentgrass and rough bluegrass caused their accumulation in cells and then destroyed cell membrane at high SO2 concentrations, as observed in this study and reported previously by others (Tseng et al. Citation2007, Citation2008; Li & Yi Citation2012). Therefore, we suggest that lower ROS levels together with higher antioxidant enzyme activities under SO2 stress conditions, especially at high SO2 concentrations, are important factors correlated with SO2 tolerance in cool-season turfgrass species.
As discussed above, increased MDA level in cool-season turfgrass species indicated that ROS caused damage to membrane lipids by peroxidation under SO2 stress condition. This membrane damage was indirectly reflected by increase of EL in this study. Soluble sugars and proline, as two major osmotic adjustment substances, play important roles in osmo-protection under multiple stress conditions. Under many stress conditions, soluble sugars such as glucose, sucrose, and fructose can stabilize proteins and membranes of plants by replacing hydrogen bonding through polar residues and preventing denaturation of protein and fusion of membranes (Iturriaga et al. Citation2009). It is well known that proline not only functions as an osmolyte for osmotic adjustment, but also contributes to stabilizing sub-cellular structure (such as membranes and protein), buffering cellular redox potential, and scavenging free radicals under adverse stress conditions (Ashraf & Foolad Citation2007). In this study, we found that soluble sugar did not increase significantly in all of the four cool-season turfgrass species, indicating its limited role on SO2 stress tolerance. However, proline contents increased significantly in SO2-tolerant turfgrass species (sheep fescue and perennial ryegrass) but not in SO2-sensitive species (rough bluegrass and colonial bentgrass) at high SO2 concentrations. Since growth and development of turfgrass species were inhibited at high SO2 concentrations as discussed above, increased proline in turfgrass could not likely be used for protein biosynthesis but for other functions, such as osmo-protection. Therefore, proline content in turfgrass can be considered as an indicator for selection of SO2-tolerant turfgrass species.
Once SO2 in the atmosphere enters plant, it is rapidly converted to sulfite. Sulfite is a highly cytotoxic molecule, which can wreak havoc on the cellular organellae or even the entire plant. In plant cells, sulfite, as an intermediate substance, can be further converted to either sulfide by SiR to enter reductive pathway or sulfate by SO to enter oxidative pathway (Brychkova et al. Citation2013). Overexpression of SiR or SO in Arabidopsis thaliana and/or Solanum lycopersicum (tomato) plants increased their tolerance to sulfur dioxide toxicity (Brychkova et al. Citation2007; Lang et al. Citation2007; Yarmolinsky et al. Citation2013). SiR was rapidly induced by SO2, whereas SO was constitutively expressed and was not significantly induced by SO2 in A. thaliana and tomato plants (Brychkova et al. Citation2007). In this study, we found that SiR was also significantly induced by SO2 and SO was constitutively expressed regardless of concentration changes of SO2. More importantly, we found that SO2-tolerant turfgrass species (sheep fescue and perennial ryegrass) showed much higher SiR activities than SO2-sensitive turfgrass species (colonial bentgrass and rough bluegrass) under SO2 stress conditions, especially at high SO2 concentrations. As SiR catalyzes a reductive reaction, conversion of cytotoxic sulfite to sulfide by SiR will reduce oxidative stress on plant cells, and then contribute to SO2 tolerance in turfgrass species. Consequently, SO2-tolerant turfgrass species showed higher sulfur content in leaves.
Conclusion
In this research, we compared physiological responses of sheep fescue, perennial ryegrass, colonial bentgrass, and rough bluegrass to sulfur dioxide stress by estimating the visible injury, measuring the chlorophyll contents, testing the activities of antioxidant enzymes, measuring the contents of soluble osmoprotectants, and estimating sulfur content and metabolic enzyme activities. Our results showed that SO2 causes injury symptoms on cool-season turfgrass species in different degree; SOD, CAT, POD, GR, and GST antioxidant enzymes contributed to SO2 resistance; proline content in cool-season turfgrass species is correlated with SO2 tolerance; and SiR plays important role on sulfite metabolism and then contributes to SO2 tolerance. To the best of our knowledge, this is the first physiological study of effect of SO2 on cool-season turfgrass in details. This study gained some insights into the tolerant mechanisms of cool-season turfgrass to SO2 toxicity, and provided useful guidelines for selection of turfgrass species suitable for use in SO2 polluted urban and industrial areas in cold and transition region in cold season.
Additional information
Funding
References
- Aebi H. 1984. Catalase in vitro. Methods Enzymol. 105:121–126. 10.1016/S0076-6879(84)05016-3
- Ashraf M, Foolad MR. 2007. Roles of glycine betaine and proline in improving plant abiotic stress resistance. Environ Exp Bot. 59:206–216. 10.1016/j.envexpbot.2005.12.006
- Ayazloo M, Bell JNB. 1981. Studies on the tolerance to sulfur dioxide of grass populations in polluted areas. I. Identification of tolerant populations. New Phytol. 88:203–222. 10.1111/j.1469-8137.1981.tb01718.x
- Bates LS, Waldren RP, Teare ID. 1973. Rapid determination of free proline for water-stress studies. Plant Soil. 39:205–207. 10.1007/BF00018060
- Beauchamp C, Fridovich I. 1971. Superoxide dismutase: improved assays and an assay applicable to acrylamide gels. Anal Biochem. 44:276–287. 10.1016/0003-2697(71)90370-8
- Bradford MM. 1976. Rapid and sensitive method for the quantitation of microgram quantities of protein utilizing the principle of protein-dye binding. Anal. Biochem, 72:248–254. 10.1016/0003-2697(76)90527-3
- Brennan E, Halisky PM. 1970. Response of turfgrass cultivars to ozone and sulfur dioxide in the atmosphere. Phytopathology. 60:1544–1546. 10.1094/Phyto-60-1544
- Brychkova G, Grishkevich V, Fluhr R, Sagi M. 2013. An essential role for tomato sulfite oxidase and enzymes of the sulfite network in maintaining leaf sulfite homeostasis. Plant Physiol. 161:148–164. 10.1104/pp.112.208660
- Brychkova G, Xia Z, Yang G, Yesbergenova Z, Zhang Z, Davydov O, Fluhr R, Sagi M. 2007. Sulfite oxidase protects plants against sulfur dioxide toxicity. Plant J. 50:696–709. 10.1111/j.1365-313X.2007.03080.x
- Brychkova G, Yarmolinsky D, Ventura Y, Sagi M. 2012. A novel in-gel assay and an improved kinetic assay for determining in vitro sulfite reductase activity in plants. Plant Cell Physiol. 53:1507–1516. 10.1093/pcp/pcs084
- Cha BC, Lee EH. 2004. Antioxidant and anti-inflammation activities of Prunus persica tree extracts. Korean J Med Crop Sci. 12:289–294.
- Curtis CR. 1971. Disc electrophoretic comparisons of protein and peroxidases from Phaseolus vulgaris leaves infected with Agrobacterium tumefaciens. Can J Bot. 49:333–337. 10.1139/b71-056
- D'Amato G, Cecchi L, D'Amato M, Liccardi G. 2010. Urban air pollution and climate change as environmental risk factors of respiratory allergy: an update. J Investig Allergol Clin Immunol. 20:95–102.
- Darkó É, Ambrus H, Fodor J, Király Z, Barnabás B. 2009. Enhanced tolerance to oxidative stress with elevated antioxidant capacity in doubled haploid maize derived from microspores exposed to paraquat. Crop Sci. 49:628–636.
- Darley EF, Middleton JT. 1966. Problems of air pollution in plant pathology. Annu Rev Phytopathol. 4:103–118. 10.1146/annurev.py.04.090166.000535
- Eilers T, Schwarz G, Brinkmann H, Witt C, Richter T, Nieder J, Koch B, Hille R, Hänsch R, Mendel RR. 2001. Identification and biochemical characterization of Arabidopsis thaliana sulfite oxidase. A new player in plant sulfur metabolism. J Biol Chem. 276:46989–46994.
- Elstner EF, Heupel A. 1976. Inhibition of nitrite formation from hydroxylammoniumchloride: a simple assay for superoxide dismutase. Anal Biochem. 70:616–620. 10.1016/0003-2697(76)90488-7
- Giraud E, Ivanova A, Gordon CS, Whelan J, Considine MJ. 2012. Sulphur dioxide evokes a large scale reprogramming of the grape berry transcriptome associated with oxidative signalling and biotic defence responses. Plant Cell Environ. 35:405–417. 10.1111/j.1365-3040.2011.02379.x
- Guo YD, Li W, Li R, Wu XX, Zhao B, Mao PS. 2011. Progress in transgenic breeding research of gramineous forage and turfgrass. Sci Agr Sinica. 44:3812–3821. Chinese.
- Habig WH, Pabst MJ, Jakoby WB. 1974. Glutathione S-transferases: the first enzymatic step in mercapturic acid formation. J Biol Chem. 249:7130–7139.
- He J. 2009. China's industrial SO2 emissions and its economic determinants: EKC's reduced vs. structural model and the role of international trade. Environ Dev Econ. 14:227–262. 10.1017/S1355770X0800452X
- He Y, Liu Y, Cao W, Huai M, Xu B, Huang B. 2005. Effects of salicylic acid on heat tolerance associated with antioxidant metabolism in Kentucky bluegrass. Crop Sci. 45:988–995. 10.2135/cropsci2003.0678
- Heath RL, Packer L. 1968. Photoperoxidation in isolated chloroplasts. I. Kinetics and stoichiometry of fatty acid peroxidation. Arch Biochem Biophys. 125:189–198. 10.1016/0003-9861(68)90654-1
- Heyneke E, Strauss AJ, Strasser RJ, Krüger GHJ. 2012. Open-top chamber facility to study air pollution impacts in South Africa. Part II: SO2–drought interactions on yield, photosynthesis and symbiotic nitrogen fixation in soybean. S Afr J Plant Soil 29:9–23. 10.1080/02571862.2012.688373
- Honour SL, Bell JNB, Ashenden TW, Cape JN, Power SA. 2009. Responses of herbaceous plants to urban air pollution: effects on growth, phenology and leaf surface characteristics. Environ Pollut. 157:1279–1286. 10.1016/j.envpol.2008.11.049
- Hu L, Li H, Pang H, Fu J. 2012. Responses of antioxidant gene, protein and enzymes to salinity stress in two genotypes of perennial ryegrass (Lolium perenne) differing in salt tolerance. J Plant Physiol. 169:146–156. 10.1016/j.jplph.2011.08.020
- Irigoyen JJ, Emerich DW, Sánchez-Díaz M. 1992. Water stress induced changes in concentrations of proline and total soluble sugars in nodulated alfalfa (Medicago sativd) plants. Physiol Plantarum. 84:55–60. 10.1111/j.1399-3054.1992.tb08764.x
- Iturriaga G, Suárez R, Nova-Franco B. 2009. Trehalose metabolism: from osmoprotection to signaling. Int J Mol Sci. 10:3793–3810. 10.3390/ijms10093793
- Jim CY, Chen WY. 2009. Urbanization effect on floristic and landscape patterns of green spaces. Landscape Res. 34:581–598. 10.1080/01426390903178480
- Kong FX, Hu W, Chao SY, Sang WL, Wang LS. 1999. Physiological responses of the lichen Xanthoparmelia mexicana to oxidative stress of SO2. Environ Exp Bot. 42:201–209. 10.1016/S0098-8472(99)00034-9
- Lang C, Popko J, Wirtz M, Hell R, Herschbach C, Kreuzwieser J, Rennenberg H, Mendel RR, Hänsch R. 2007. Sulphite oxidase as key enzyme for protecting plants against sulphur dioxide. Plant Cell Environ. 30:447–455. 10.1111/j.1365-3040.2006.01632.x
- Leung DY, Tsui JK, Chen F, Yip WK, Vrijmoed LL, Liu CH. 2011. Effects of urban vegetation on urban air quality. Landscape Res. 36:173–188. 10.1080/01426397.2010.547570
- Li L, Yi H. 2012. Effect of sulfur dioxide on ROS production, gene expression and antioxidant enzyme activity in Arabidopsis plants. Plant Physiol Biochem. 58:46–53. 10.1016/j.plaphy.2012.06.009
- Li X, Li Y, Wang L, Sun L, Cai S, Huang Z. 2014. Comparative analyses of physilogical responses of Cynodon dactylon accessions from Southwest China to sulfur dioxide toxicity. Sci World J. 2014: article ID 916595, 13.
- Lichtenthaler HK, Wellburn AR. 1983. Determinations of total carotenoids and chlorophylls a and b of leaf extracts in different solvents. Biochem Soc T. 11:591–592.
- Lodish H, Berk A, Kaiser CA, Krieger M, Bretscher A, Ploegh H, Amon A, Scott MP. 2012. Molecular cell biology. 7th ed. New York: W. H. Freeman and Company.
- Mahan JR, Mauget SA. 2005. Antioxidant metabolism in cotton seedlings exposed to temperature stress in the field. Crop Sci. 45:2337–2345. 10.2135/cropsci2005.0106
- Mohammed AR, Tarpley L. 2009. Impact of high nighttime temperature on respiration, membrane stability, antioxidant capacity, and yield of rice plants. Crop Sci. 49:313–322. 10.2135/cropsci2008.03.0161
- Pickett STA, Cadenasso ML, Grove JM, Boone CG, Groffman PM, Irwin E, Kaushal SS, Marshall V, McGrath BP, Nilon CH, et al. 2011. Urban ecological systems: scientific foundations and a decade of progress. J Environ Manage. 92:331–362. 10.1016/j.jenvman.2010.08.022
- Pilon C, Soratto RP, Moreno LA. 2013. Effects of soil and foliar application of soluble silicon on mineral nutrition, gas exchange, and growth of potato plants. Crop Sci. 53:1605–1614. 10.2135/cropsci2012.10.0580
- Reyes-Díaz M, Meriño-Gergichevich C, Alarcón E, Alberdi M, Horst WJ. 2011. Calcium sulfate ameliorates the effect of aluminum toxicity differentially in genotypes of highbush blueberry (Vaccinium corymbosum L.). J Soil Sci Plant Nutr. 11:59–78.
- Singh LP, Gill SS, Gill R, Tuteja N. 2012. Mechanism of sulfur dioxide toxicity and tolerance in crop pants. In: Tuteja N, Tiburcio AF, Gill SS, Tuteja R, editors. Improving crop resistance to abiotic stress. 1st ed. Weinheim: Wiley-VCH Verlag GmbH & Co. KGaA; p. 133–163.
- Tan C, Liu Y. 1981. Research on the reaction and resistance of plants to SO2. VIII. Protection of radical scavengers to impairment of SO2. J Environ Sci. 1:197–206.
- Tanaka K, Saji H, Kondo N. 1988. Immunological properties of spinach glutathione reductase and inductive biosynthesis of the enzyme with the ozone. Plant Cell physiol. 29:637–642.
- Tseng MJ, Liu CW, Yiu JC. 2007. Enhanced tolerance to sulfur dioxide and salt stress of transgenic Chinese cabbage plants expressing both superoxide dismutase and catalase in chloroplasts. Plant Physiol Biochem. 45:822–833. 10.1016/j.plaphy.2007.07.011
- Tseng MJ, Liu CW, Yiu JC. 2008. Tolerance to sulfur dioxide in transgenetic Chinese cabbage transformed with both the superoxide dismutase containing manganeses and catalase genes of Escherichia coli. Sci Hortic. 115:101–110. 10.1016/j.scienta.2007.08.008
- Xu Y, Huang B. 2009. Effects of foliar-applied ethylene inhibitor and synthetic cytokinin on creeping bentgrass to enhance heat tolerance. Crop Sci. 49:1876–1884. 10.2135/cropsci2008.07.0441
- Yan J, Wang J, Tissue D, Holaday AS, Allen R, Zhang H. 2003. Photosynthesis and seed production under water-deficit conditions in transgenic tobacco plants that overexpress an ascorbate peroxidase gene. Crop Sci. 43:1477–1483. 10.2135/cropsci2003.1477
- Yang L, Stulen I, De Kok LJ. 2006. Sulfur dioxide: relevance of toxic and nutritional effects for Chinese cabbage. Environ Exp Bot. 57:236–245. 10.1016/j.envexpbot.2005.06.002
- Yarmolinsky D, Brychkova G, Fluhr R, Sagi M. 2013. Sulfite reductase protects plants against sulfite toxicity. Plant Physiol. 161:725–743. 10.1104/pp.112.207712