
Abstract
The objective of the present study was to determine the activity of antioxidant enzymes: superoxide dismutase (SOD), ascorbate peroxidase (APX), and catalase (CAT) and the expression of their genes in two barley genotypes under controlled severe drought. To fulfill this objective, 21-day-old barley plants of two genotypes: Rum and Yarmouk were exposed to controlled severe drought (25% field capacity) for 2, 9, and 16 days. The activity of SOD was significantly high in Rum genotype after 2 days of drought treatment. In Yarmouk genotype, the activity of APX was significantly high after 2 and 9 days of drought treatment. In Rum genotype, CAT2 was upregulated after 9 days of drought treatment and SOD and APX were upregulated after 16 days of drought treatment, whereas CAT2, SOD, and APX were upregulated in Yarmouk genotype after 2 days of drought treatment. The results indicate a unique pattern of activity and gene expression of the antioxidant enzymes in the two barley genotypes under controlled severe drought. Moreover, the data suggest that each genotype utilizes different molecular and biochemical responses under the same drought conditions.
Introduction
In response to drought stress plants are challenged by oxidative stress (Reddy et al. Citation2004; de Carvalho Citation2008; Kar Citation2011; Noctor et al. Citation2014). Oxidative stress is resulted from the generation of reactive oxygen species (ROS) such as superoxide (O2−), hydroxyl (OH−), hydrogen peroxide (H2O2), and singlet oxygen (1O2; Gill & Tuteja Citation2010). Although in plants, ROS are mainly produced in organelles involved in energy transformation (chloroplasts and mitochondria; Gill & Tuteja Citation2010), they are also found to be generated in other sites in plant cells such as peroxisomes, cytosol, endoplasmic reticulum, and apoplast (Gill & Tuteja Citation2010).
Under normal growth conditions plants produce ROS, but they are kept in balance with the different antioxidants of the cell (redox homeostasis; Kar Citation2011). Under stressful conditions, ROS are produced at a high rate. If these ROS are not scavenged by the different antioxidants, they will accumulate in plant cells. The accumulation of the ROS is harmful to the different macromolecules in the cell, since they cause degradation of proteins, DNA, and lipids and increase the permeability of membranes (de Carvalho Citation2008; Gill & Tuteja Citation2010). If the plant is not able to scavenge the ROS in a reasonable time, it will die eventually as a result of the continual accumulation of these ROS and the detrimental effects of their accumulation (Gill & Tuteja Citation2010).
In plants, there are enzymatic and nonenzymatic antioxidants (Reddy et al. Citation2004; Gill & Tuteja Citation2010). The first defense line against the accumulation of ROS is superoxide dismutase (SOD), which dismutates the O2− radicals to H2O2 (de Carvalho Citation2008). Catalase (CAT) and ascorbate peroxidase (APX) are two enzymes that scavenge H2O2 and prevent its accumulation to toxic levels. These two enzymes were shown to have different affinities to H2O2; CAT has low affinity to H2O2 and it was suggested that it is responsible for scavenging most of the H2O2. APX has high affinity to H2O2 that might act in the fine regulation of ROS (de Carvalho Citation2008). Moreover, APX is part of the ascorbate–glutathione cycle, which requires ascorbate to scavenge H2O2 (Reddy et al. Citation2004; de Carvalho Citation2008).
Previous studies on the oxidative stress and the activities of antioxidant enzymes in response to drought and osmotic stresses showed inconsistent results. This is because ROS accumulation and the upregulation of antioxidant enzymes are dependent on plant species, plant genotype, stress severity, stress duration, plant development, and metabolism (Reddy et al. Citation2004). Indeed, a study on barley plants under normal growth conditions showed that SOD and CAT activities were higher at the early developmental stage compared to the late developmental stage (Ehrenbergerová et al. Citation2009).
Drought-tolerant and drought-sensitive genotypes of durum wheat were exposed to progressive drought for 35 days. The results revealed insignificant difference in lipid peroxidation between the drought-treated and the well-watered control plants (Loggini et al. Citation1999). Rice seedlings were exposed to mild and severe osmotic stress using PEG-6000; as the severity of osmotic stress increased the activity of SOD and APX increased and the activity of CAT decreased (Sharma & Dubey Citation2005). In a study on two wheat genotypes with differential drought tolerance under osmotic stress for 2 days, the two genotypes showed an increase in lipid peroxidation, SOD and CAT activities (Wu et al. Citation2012). Another study on bread wheat under osmotic stress showed a differential change in the activity of SOD, CAT, and APX between the drought-tolerant and drought-sensitive genotypes. Hence, it was suggested that these enzymes could be reliable indicators of drought tolerance in plants under stress (Devi et al. Citation2012). In barley, SOD activity was increased in drought-resistant genotype under progressive drought for 12 days (Acar et al. Citation2001). In a study, 15-day-old plants of drought-tolerant and drought-sensitive barley genotypes were exposed to progressive drought for 8 days. The results showed an increase in the oxidative stress and a decrease in the activities of the enzymatic antioxidants (SOD and CAT) in the drought-sensitive genotype (Marok et al. Citation2013).
The expression of antioxidant enzyme genes under drought stress was tested in a few studies. Drought-tolerant and drought-sensitive genotypes of prairie junegrass were exposed to moderate drought by withholding watering for 7 days (Jiang et al. Citation2010). The results showed that drought did not cause lipid peroxidation or changes in the activities of SOD, CAT, and APX (Jiang et al. Citation2010). In the same study, the expression of APX gene was increased under drought conditions, and no difference in the expression of SOD and CAT genes was shown. In another study, progressive drought for 18 and 22 days was applied to drought-tolerant and drought-sensitive genotypes of Kentucky bluegrass, respectively (Xu et al. Citation2011). The results revealed a differential expression of SOD, CAT, and APX, which was not correlated with the changes in the activity of their enzymes.
To the best of our knowledge, there was no previous studies on the oxidative stress and the antioxidant responses in barley plants in a time course of controlled drought. Moreover, the literature on gene expression of antioxidant enzymes is scarce, and no expression studies on barley plants were carried out so far (Jiang et al. Citation2010; Xu et al. Citation2011; Shiriga et al. Citation2014). Two barley genotypes (Rum and Yarmouk) showed a decrease in growth, yield, and photosynthetic activitiy under controlled severe drought imposed at the flowering stage. But the decrease in Rum was lower than that in Yamrouk. Hence, Rum is drought-tolerant whileYarmouk is drought-sensitive (Samarah et al. Citation2009). A significant and similar decrease in growth and photosynthetic activity of the two genotypes was shown when exposed to controlled severe drought at the vegetative stage (Harb & Samarah Citation2015). However, the two genotypes showed differential expression of stress marker genes under controlled severe drought at the vegetative stage (Harb & Samarah Citation2015). Therefore, the objective of the present study was to test if the biochemical response in terms of the activity of antioxidant enzymes SOD, APX, and CAT and the expression of their genes will help in the differentiation of the response of the two genotypes to controlled severe drought at the vegetative stage.
Materials and methods
Plant material and drought treatment
Barley grains of two common Jordanian cultivars were provided by the National Center for Agricultural Research and Extension (NCARE), Al-Baqa, Jordan. Plant growth and drought treatment were done as described by Harb and Samarah (Citation2015). In brief, grains of two barley (Hordeum vulgare L.) genotypes (Rum and Yarmouk) were planted in a mixture of soil: peatmoss: perlite in a ratio of 2:2:1. Drought treatment started 3 weeks after planting. The plants of the two genotypes were exposed to two treatments: well-watered (plants grown at 75% of field capacity during the experiment) and severe-drought stress (plants grown at soil moisture of 25% of field capacity). The desired soil moisture content was maintained gravimetrically for 3 weeks by weighing the pots twice daily to compensate for the evaporated water.
For lipid peroxidation, antioxidant enzyme assay, and gene expression, samples were harvested after 2, 9, and 16 days of drought treatment. Samples were immediately frozen in liquid nitrogen and stored at –80°C until used. Four pooled samples were used for enzyme assay and gene expression. Each sample was a pool of five plants.
Determination of lipid peroxidation
Lipid peroxidation was measured as the amount of malondialdehyde (MDA) produced by the thiobarbituric acid (TBA) reaction (Heath & Packer Citation1968). A half gram of leaf samples was homogenized in 5 ml of 20% (w/v) trichloroacetic acid (TCA) and centrifuged at 10,000 × g for 10 min. About 1 ml of the supernatant was added to reaction mixture containing 4 ml of 0.5% (w/v) TBA prepared in 20% (w/v) TCA. The mixture was incubated at 95°C for 30 min followed by quick cooling on ice, and then centrifuged at 10,000 × g for 10 min. The absorbance of the supernatant was determined at 532 nm and corrected for nonspecific absorbance at 600 nm. MDA amount was determined using the extinction coefficient of 155 mM−1 cm−1 and expressed as µmol/g fresh weight (FW).
Extraction of the antioxidant enzymes
For antioxidant enzyme activities, the extraction was done as described by Hossain et al. (Citation2013). Briefly, 0.5 g of fresh plant tissue was homogenized in an extraction buffer of 5 ml of 50 mM ice-cold potassium phosphate buffer (pH 7.0) containing 100 mM potassium chloride, 1 mM ascorbate, 5 mM β-mercaptoethanol, and 10% (w/v) glycerol. Then, the homogenates were centrifuged at 11,500 × g for 10 min and the supernatants were used for enzyme assay.
Enzyme assay
Catalase
CAT (E.C.1.11.1.6) activity was determined by measuring the decrease in absorbance at 240 nm as a result of degradation of H2O2 (E = 0.0436/mM/cm; Aebi Citation1984). The reaction mixture contained 50 mM potassium phosphate buffer, pH 7.0, 15 mM H2O2, and 20 µl plant extract in a final volume of 2 ml. One unit of CAT activity was defined as the amount of enzyme that catalyzes the decomposition of 1 µmol of H2O2 per minute and the specific activity was expressed as units per mg protein.
Superoxide dismutase
SOD (E.C. 1.15.1.1) activity was determined by measuring the inhibition of the photochemical reduction of nitroblue tetrazolium chloride bn (NBT) by the enzyme in the reaction mixture containing 50 mM potassium phosphate buffer (pH 7.8), 3 mM of EDTA, 2.25 mM NBT, 200 mM methionine, 50 µl of plant extract, and 60 µM riboflavin (Beyer & Fridovich Citation1987). The reaction was initiated at room temperature by switching on 40 W florescent lamps for 15 min and stopped by switching the light off. Tubes without enzyme developed maximal color. A nonirradiated complete reaction mixture which did not develop color served as blank. The absorbance of O2−-nitro blue tetrazolium complex formed was recorded at 560 nm. One unit of SOD activity was defined as the amount of the enzyme that inhibited NBT reduction by 50% in comparison with tubes lacking enzymes. Enzyme activity was expressed as units per mg protein.
Ascorbate peroxidase
APX (E.C. 1.1.1.11) activity was measured by following the rate of H2O2- dependent oxidation of ascorbic acid (Nakano & Asada Citation1981). The reaction mixture contained 25 mM potassium phosphate buffer (pH 7), 0.1 mM EDTA, 1 mM H2O2, 0.25 mM ascorbate, and 40 µl of the plant extract. The enzyme activity was determined using an extinction coefficient of 2.8/mM/cm by measuring the decrease in absorbance at 290 nM for 1 min. One unit of APX activity was defined as the amount of enzyme needed for the oxidation of 1 μmol of ascorbate per minute.
Determination of total protein
Protein content of the samples was determined following Bradford method using bovine serum albumin as a standard (Bradford Citation1976).
Isolation of total RNA
Total RNA was isolated from three biological replicates (five plants/biological replicate) of the two genotypes at each time point using the RNeasy Kit (QIAGEN GmbH, Germany). The quality and quantity of the isolated RNA were checked by gel electrophoresis and spectrophotometrically using Epoch Microplate Spectrophotometer (BIOTEK, USA). RNA was cleaned from DNA contamination by RQ1 RNase-free DNase (Promega, USA). After that, 2 µg of the total RNA was used to synthesize the complementary DNA (cDNA) using Power cDNA Synthesis Kit (iNtRON Biotechnology, Korea).
Semiquantitative PCR
Primers for antioxidant enzyme genes were ordered from Integrated DNA Technologies (IDT), USA (). Primers for cyclophilin were designed from the sequence of Hv1-Contig2143-1 (Burton et al. Citation2004; http://barleyflc.dna.affrc.go.jp/bexdb). Primers for barley cytosolic Cu/Zn SOD were designed from the sequence of cDNA clone FLbaf147o13 (AK252295) that shows similarity to rice SOD1 (Shagimardanova et al. Citation2010).
Table1. Primers of genes coding for antioxidant enzymes used in semi-quantitative RT-PCR.
For each gene, the following PCR mix of a total volume of 20 µL was prepared: 0.5 µL cDNA, gene-specific forward primer (0.4 µM), gene-specific reverse primer (0.4 µM), 1X Taq DNA polymerase master mix red (Amplicon, Denmark) and free-nuclease water. The genes were amplified in 35 cycles of initial denaturation at 95°C for 2 min, denaturation at 95°C for 30 sec, annealing at specific temperature for each gene for 30 sec (), and extension at 72°C for 1 min. Final extension was at 72°C for 2 min.
Statistical analysis
Student’s t-test was used to compare the means of well-watered and drought-treated plants of Rum and Yarmouk barley genotypes. Differences with p < 0.05 were considered significant.
Results
Lipid peroxidation
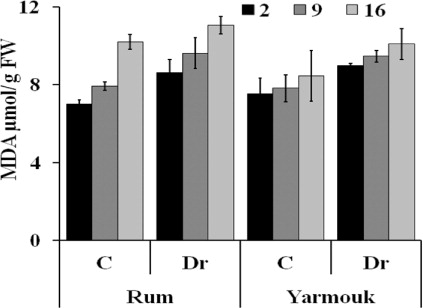
One consequence of oxidative stress is lipid peroxidation and the formation of MDA. Both barley genotypes showed insignificant difference in the MDA concentration between the well-watered and the drought-treated plants at the three stages of drought treatment: the early stage after 2 days, the intermediate stage after 9 days, and the late stage after 16 days of drought treatment ().
Antioxidant enzymes
CAT activity was similar in plants of Yarmouk genotype under both well-watered and drought conditions at the early, the intermediate and the late stages of drought treatment. The same result was shown in Rum genotype except for the significant decrease in CAT activity in the drought-treated plants (138.67 U/mg protein) compared with the well-watered plants (245.93 U/mg protein) at the early stage of drought (p = 0.015; ).
![Figure 2. The activity of CAT (A), SOD (B), and APX (C) in (U [unit]/mg protein) in Rum and Yarmouk genotypes under well-watered (WW) and drought (Dr) conditions at three time points: after 2 days of drought (early stage), after 9 days of drought (intermediate stage), and after 16 days of drought (late stage). Bars are the standard errors of the means and n = 4 pooled biological replications. *p < 0.05, **p < 0.01.](/cms/asset/b98e3493-e787-4d00-a672-f0b03f687743/tjpi_a_1033023_f0002_b.jpg)
In Rum genotype there was a highly significant increase in the activity of SOD in the drought-treated plants (11.53 U/mg protein) compared with the well-watered plants (2.93 U/mg protein) at the early stage of drought treatment (p = 0.0001). No significant differences were shown at the intermediate and the late stage of drought treatment. In Yarmouk genotype, plants at the early and the intermediate stages of drought treatment have similar SOD activity under drought and well-watered conditions. At the late stage of drought treatment, SOD activity was significantly higher in the well-watered plants (15.6 U/mg protein) compared with the drought-treated plants (8.92 U/mg protein; p = 0.006; ).
The activity of APX was significantly higher in the drought-treated plants (30.4 U/mg protein) compared with the well-watered plants (21.27 U/mg protein) of Yarmouk genotype at the early stage of drought treatment (p = 0.018). Moreover, in the same genotype, a significant increase in APX activity was also shown in the drought-treated plants (21.45 U/mg protein) compared with the well-watered plants (12.47 U/mg protein) at the intermediate stage of drought treatment (p = 0.03). In Rum genotype, drought treatment did not increase the activity of APX at the early and the late stages of drought treatment. At the intermediate stage, APX activity was significantly higher in the well-watered plants (28.63 U/mg protein) compared with the drought-treated plants (16.26 U/mg protein; p = 0.02; ).
Gene expression
The expression patterns of SOD, CAT2, and APX genes were tested in Rum and Yarmouk genotypes at three time points of drought treatment: the early stage (2 days of drought), the intermediate stage (9 days of drought), and the late stage (16 days of drought; ). At the early stage of drought, CAT2 gene was highly upregulated in the drought-treated plants of Yarmouk genotype, and it was moderately downregulated in the drought-treated plants of Rum genotype. SOD was highly upregulated and APX was slightly upregulated in the drought-treated plants of Yarmouk genotype. In Rum genotype, SOD gene was not expressed under drought treatment, and APX gene showed no expression in both the drought-treated and the well-watered plants ().
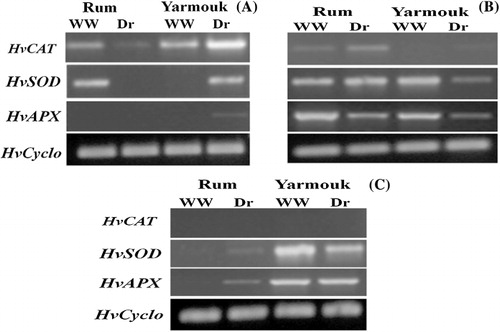
At the intermediate stage, CAT2 gene was moderately upregulated in the drought-treated plants of Rum genotype, and slightly upregulated in the drought-treated plants of Yarmouk genotype. SOD and APX genes were highly downregulated in the drought-treated plants of Yarmouk genotype. In Rum genotype, SOD expression was not affected by the drought treatment, but the expression of APX was highly downregulated in the drought-treated plants ().
At the late stage of drought, CAT2 gene showed no expression in both genotypes under both drought and well-watered conditions. SOD gene was slightly upregulated in the drought-treated plants of Rum genotype, and moderately downregulated in the drought-treated plants of Yarmouk genotype. The expression of APX was upregulated in the drought-treated plants of Rum genotype, but it was not changed in Yarmouk genotype ().
Discussion
At the three stages of controlled severe drought, drought-treated plants showed similar lipid peroxidation as the well-watered control. This is consistent with a study on drought-tolerant and drought-sensitive genotypes of durum wheat exposed to progressive drought for 35 days, which revealed insignificant difference in lipid peroxidation between the drought-treated and the well-watered control plants (Loggini et al. Citation1999). In prairie junegrass, progressive drought for 7 days did not affect lipid peroxidation (Jiang et al. Citation2010). Many studies showed that lipid peroxidation as a marker of oxidative stress was increased under drought stress. Barley plants exposed to progressive drought for 8 days showed an increase in lipid peroxidation in the drought-sensitive genotype but not in the drought-tolerant genotype (Marok et al. Citation2013). In a study on Kentucky bluegrass, progressive drought for 18 days of drought-tolerant genotype and 22 days of the drought-sensitive genotype showed an increase in lipid peroxidation in both genotypes, but the increase was higher in the drought-sensitive genotype (Xu et al. Citation2011). Plants under osmotic stress for 2 days of two wheat genotypes showed an increase in lipid peroxidation compared with the untreated control (Wu et al. Citation2012). The discrepancy in the results of lipid peroxidation can be explained by the different plant species that were tested and the differential severity and duration of drought stress (Reddy et al. Citation2004; Kar Citation2011). Furthermore, drought treatment that is based on water deficit in the soil stimulates distinct responses compared with that based on the use of osmoticum (Noctor et al. Citation2014). Hence, it might be suggested that in a time course of controlled severe drought ROS are not accumulating to a detrimental level that causes lipid peroxidation.
The activity of the antioxidant enzymes was differentially changed in the two barley genotypes under controlled severe drought. At the early stage of drought, the activity of SOD was highly increased in the drought-treated plants of Rum genotype, whereas drought-treated plants of Yarmouk genotype had significant increase in APX activity. A different pattern of the activity of the antioxidant enzymes was shown in the intermediate stage. At this stage, the activity of SOD, CAT, and APX in Rum genotype was similar in the well-watered and drought-treated plants, and APX was significantly high in the drought-treated plants of Yarmouk genotype. At the late stage of drought, the two barley genotypes showed similar enzyme activity in the well-watered and the drought-treated plants. In a previous study, controlled severe drought imposed at the vegetative stage was shown to significantly and similarly decrease photosynthesis and plant growth in the two barley genotypes (Harb & Samarah Citation2015). However, the same study showed differential expression of drought marker genes. This suggests that at the molecular level, there are specific drought responses to each genotype. Indeed, Yarmouk genotype was shown to be more drought-sensitive when drought started at the flowering stage than when started at the vegetative stage (Samarah et al Citation2009; Haddadin et al. Citation2013). Hence, in drought imposed at the vegetative stage different molecular and biochemical responses in the two genotypes result in the same physiological and morphological responses. The bulk literature showed increased activity of the antioxidant enzymes under drought stress (Sairam et al. Citation1998; Loggini et al. Citation1999; Acar et al. Citation2001; Sharma & Dubey Citation2005; Lee et al. Citation2009; Chugh et al. Citation2011; Chakraborty & Pradhan Citation2012; Marok et al. Citation2013). In a recent study on 15-day-old drought-tolerant and drought-sensitive barley genotypes exposed to progressive drought for 8 days, the activity of CAT and SOD showed higher increase in the drought-tolerant genotype than the drought-sensitive genotype (Marok et al. Citation2013). In barley, 21-day-old plants under progressive drought for 12 days, the activity of SOD was higher in the drought-resistant genotype than in the drought-sensitive genotype (Acar et al. Citation2001). A decrease in the activity of antioxidant enzymes SOD, CAT, and APX was also shown in Kentucky bluegrass genotypes (Xu et al. Citation2011). The activity of SOD, CAT, and APX was not changed in prairie junegrass under progressive drought (Jiang et al. Citation2010). Hence, the results of the activity of antioxidant enzymes under drought stress have no general pattern of activation or inhibition.
In this study, the expression profile of SOD, CAT2, and APX genes was specific to each genotype and showed no direct correlation with the corresponding enzyme activity. The activity of SOD was high at the early stage of drought in Rum genotype, but SOD gene was not expressed. At the intermediate stage, there was consistency between the enzyme activity of SOD and its gene expression. At the late stage of drought, SOD activity was the same in the drought-treated and the well-watered plants, but SOD was slightly upregulated. In Yarmouk genotype, APX activity was increased at the early and the intermediate stages of drought, but APX gene was upregulated at the early stage of drought and downregulated at the intermediate stage of drought. This can be explained by the presence of different isoforms of the antioxidant enzymes (Gill & Tuteja Citation2010). At the gene expression level, the expression of only one isoform was tested, whereas the assayed enzyme activity is the activity of more than one isoform (Furlan et al. Citation2013). In addition, because of the complex regulation mechanisms of gene expression, gene expression cannot be directly correlated with enzyme activity.
Plants of prairie junegrass were exposed to progressive drought for 7 days, the results showed no change in the activity of SOD, CAT, and APX, but an increase in the expression of APX gene in the drought-treated plants was shown (Jiang et al. Citation2010). Drought-tolerant and drought-sensitive Kentucky bluegrass plants were exposed to progressive drought for 18 and 22 days, respectively (Xu et al. Citation2011). Generally, the activity of SOD, CAT, and APX was significantly decreased in both the drought-tolerant and the drought-sensitive genotypes. But the drought-tolerant genotype has higher activity of APX compared with the drought-sensitive genotype under drought stress. The expression of SOD and APX was increased in the two genotypes, but the increase was higher in the drought-tolerant genotype (Xu et al. Citation2011). The expression of SOD was studied in three-leaf stage-old drought-tolerant and sensitive maize genotypes exposed to progressive drought for 7 days; there was an increase in the expression of SOD in the two genotypes, but the drought-tolerant genotype has higher SOD expression than the drought-sensitive genotype (Shiriga et al. Citation2014). A meta-analysis of microarray data from two drought experiments, osmotic stress, salt stress, and ABA treatment showed the specificity and complexity of the response of antioxidant systems at the gene expression level (Noctor et al. Citation2014). Therefore, no generalization about the activation or repression of genes of the different antioxidants can be made.
In this study, barley plants reached the level of controlled severe drought (25% FC) after 15 days of dry down, and then this level was kept for the rest of the experiment. The first sampling was done after 2 days of exposing the plants to soil moisture of 25% FC (the early stage of drought). At the three time points of drought, the two genotypes responded similarly to drought stress at the physiological and the morphological levels by decreasing plant photosynthetic rate and plant height, but differentially at the molecular level (Harb & Samarah Citation2015). Here it was shown that they responded differentially at the biochemical and molecular levels. Each barley genotype has its unique pattern of enzyme activity and gene expression. Hence, this indicates that the similar morphological and physiological responses are mediated by specific biochemical and molecular changes in each genotype.
In summary, the results of this study showed no change in lipid peroxidation under drought stress in the two barley genotypes. Moreover, unique pattern of the activity of SOD, CAT, and APX under drought stress was revealed for both barley genotypes. In Rum genotype, the activity of SOD was high and that of CAT was low at the early stage of drought treatment. At the intermediate stage, the activity of APX was low, and no change in enzyme activity was shown at the late stage of drought. In Yarmouk genotype, the activity of APX was high at the early and the intermediate stages of drought. At the late stage of drought, SOD activity was low. Gene expression of SOD, CAT2, and APX showed distinct profile in each genotype. In Rum genotype and under drought stress, CAT2 was downregulated, and SOD and APX were not expressed at the early stage of drought. Then, at the intermediate stage of drought, CAT2 was upregulated and APX was downregulated in the drought-treated plants, whereas the expression of SOD was not changed by drought treatment. At the late stage of drought, CAT2 was not expressed and SOD and APX were upregulated. The expression profile of SOD, CAT2, and APX in Yarmouk genotype was as follows: at the early stage of drought, SOD, CAT2, and APX were all upregulated, at the intermediate stage of drought, CAT was slightly upregulated and SOD and APX were downregulated, and at the late stage of drought, CAT2 was not expressed, SOD was downregulated and the expression of APX was not changed under drought stress. Taken together, the results suggest that the similar physiological and morphological responses to controlled severe drought of the two barley genotypes is mediated by the differential activity of the antioxidant enzymes and unique regulation of the expression of their genes. The genotype-specific antioxidant response of barley plants under the same drought treatment could be a valuable marker, which can be used in the screening of different genotypes for drought tolerance. Hence, this will help in the understanding of the mechanisms underlying drought tolerance and eventually in the development of drought-tolerant genotypes by breeding or genetic engineering.
Acknowledgment
The authors would like to thank Mr Abd Alkareem Abu Alhaija’a for doing the molecular part of this study.
Disclosure statement
No potential conflict of interest was reported by the authors.
Additional information
Funding
References
- Acar O, Tiirkan I, Ozdemir F. 2001. Superoxide dismutase and peroxidase activities in drought sensitive and resistant barley (Hordeum vulgare L.) varieties. Acta Physiol Plant. 23:351–356.10.1007/s11738-001-0043-8
- Aebi H. 1984. Catalase in vitro. Methods Enzymol. 105:121–126.
- Beyer WF, Fridovich I. 1987. Assaying for superoxide dismutase activity: some large consequences of minor changes in conditions. Anal Biochem. 161:559–566.10.1016/0003-2697(87)90489-1
- Bradford M. 1976. A rapid and sensitive method for the quantitation of microgram quantities of protein utilizing the principle of protein-dye binding. Anal Biochem. 72:248–254.10.1016/0003-2697(76)90527-3
- Burton R, Shirley N, King B, Harvey A, Fincher G. 2004. The CesA gene family of barley. Quantitative analysis of transcripts reveals two groups of co-expressed genes. Plant Physiol. 134:224–236.10.1104/pp.103.032904
- de Carvalho MC. 2008. Drought stress and reactive oxygen species: production, scavenging and signaling. Plant Signaling Behav. 3:156–165.
- Chakraborty U, Pradhan B. 2012. Oxidative stress in five wheat varieties (Triticum aestivum L.) exposed to water stress and study of their antioxidant enzyme defense system, water stress responsive metabolites and H2O2 accumulation. Braz J Plant Physiol. 24:117–130.10.1590/S1677-04202012000200005
- Chugh V, Kaur N, Gupta A. 2011. Evolution of oxidative stress tolerance in maize (Zea mays L.) seedlings in response to drought. Indian J Biochem Biophys. 48:47–53.
- Devi R, Kaur N, Gupta A. 2012. Potential pf antioxidant enzymes in depicting drought tolerance of wheat (Triticum aestivum L.). Indian J Biochem Biophys. 49:257–265.
- Ehrenbergerová J, Belcredi NB, Kopáček J, Melišová L, Hrstková P, Macuchová S, Vaculová K, Paulíčková I. 2009. Antioxidant enzymes in barley green biomass. Plant Foods for Hum Nutr. 64:122–128.
- Furlan A, Bianucci E, Tordable M, Castro S, Dietz KJ. 2013. Antioxidant enzyme activities and gene expression patterns in peanut nodules during a drought and rehydration cycle. Funct Plant Biol. 41:704–713.10.1071/FP13311
- Gill S, Tuteja N. 2010. Reactive oxygen species and antioxidant machinery in abiotic stress tolerance in crop plants. Plant Physiol Biochem. 48:909–930.10.1016/j.plaphy.2010.08.016
- Haddadin M, Abdel-Ghani A, Al-Majali N. 2013. Response of barley varieties to drought stress imposed at different developmental stages. Jordan J Agric Sci. 9:507–524.
- Harb A., Samarah N. 2015. Physiological and molecular responses to controlled severe drought in two barley (Hordeum Vulgare L.) genotypes. J Crop Improv. 29:82–94.
- Heath RL, Packer L. 1968. Photoperoxidation in isolated chloroplasts. I. Kinetics and stoichiometry of fatty acid peroxidation. Archiv Biochem Biophys. 125:189–198.
- Hossain M, Mostofa M, Fujita M. 2013. Cross protection by cold-shock to salinity and drought stress-induced oxidative stress in mustard (Brassica campestris L.) seedlings. Mol Plant Breed. 4:50–70.
- Janská A, Hodek J, Svoboda P, Zámečník J, Prášil IT, Vlasáková E, Milella L, Ovesna J. 2013. The choice of reference gene set for assessing gene expression in barley (Hordeum vulgare L.) under low temperature and drought stress. Mol Genet Genomics. 288:639–649.
- Jiang Y, Watkins E, Liu S, Yu X, Luo N. 2010. Antioxidative responses and candidate gene expression in prairie junegrass under drought stress. J Am Soc Hortic Sci. 135:303–309.
- Kar RK. 2011. Plant responses to water stress: role of reactive oxygen species. Plant Signaling Behav. 6:1741–1745.
- Lee BR, Li LS, Jung WJ, Jun YL, Avice JC, Ourry A, Kim TH. 2009. Water deficit-induced oxidative stress and the activation of antioxidant enzymes in white clover leaves. Biol Plant. 53:505–510.10.1007/s10535-009-0091-2
- Loggini B, Scartazza A, Brugnoli E, Navari-Izzo F. 1999. Antioxidative defense system, pigment composition, and photosynthetic efficiency in two wheat cultivars subjected to drought. Plant Physiol. 119:1091–1100.10.1104/pp.119.3.1091
- Marok M, Tarrago L, Ksas B, Henri P, Abrous-Belbachir O, Havaux M, Rey P. 2013. A drought-sensitive barley variety displays oxidative stress and strongly increased contents in low-molecular weight antioxidant compounds during water deficit compared to a tolerant variety. J Plant Physiol. 170:633–645.10.1016/j.jplph.2012.12.008
- Nakano Y, Asada K. 1981. Hydrogen peroxide is scavenged by ascorbate specific peroxidase in spinach chloroplasts. Plant Cell Physiol. 22:867–880.
- Noctor G, Mhamdi A, Foyer C. 2014. Roles of reactive oxygen metabolism in drought: not so cut and dried. Plant Physiol. 164:1636–1648.10.1104/pp.113.233478
- Reddy AR, Chaitanya KV, Vivekanandan M. 2004. Drought-induced responses of photosynthesis and antioxidant metabolism in higher plants. J Plant Physiol. 161:1189–1202.10.1016/j.jplph.2004.01.013
- Sairam RK, Shukla DS, Saxena DC. 1998. Stress induced injury and antioxidant enzymes in relation to drought tolerance in wheat genotypes. Biol Plant. 40:357–364.
- Samarah NH, Alqudah AM, Amayreh JA, McAndrews GM. 2009. The effect of late-terminal drought stress on yield components of four barley cultivars. J Agron Crop Sci. 195:427–441.10.1111/j.1439-037X.2009.00387.x
- Shagimardanova E, Gusev O, Bingham G, Levinskikh M, Sychev V, Tainsu Z, Kihara M, Ito K, Sugimoto M. 2010. Oxidative stress and antioxidant capacity in barley under space environment. Biosci Biotechnol Biochem. 74:1479–1482.10.1271/bbb.100139
- Sharma P, Dubey S. 2005. Drought induces oxidative stress and enhances the activities of antioxidant. Plant Growth Regul. 46:209–221.
- Shiriga K, Sharma R, Kumar K, Yadav S, Hossain F, Thirunavukkarasu N. 2014. Expression pattern of superoxide dismutase under drought stress in maize. Int J Innovative Res Sci Eng Technol. 3:11333–11337.
- Wu GO, Zhang LN, Wang YY. 2012. Response of growth and antioxidant enzymes to osmotic stress in two different wheat (Triticum aestivum L.) cultivars seedlings. Plant Soil Environ. 58:534–539.
- Xu L, Han L, Huang B. 2011. Antioxidant enzyme activities and gene expression patterns in leaves of Kentucky bluegrass in response to drought and post-drought recovery. J Am Soc Hortic Sci. 136:247–255.