
ABSTRACT
The present study was undertaken to identify the aluminum (Al) tolerant cultivar of Brassica juncea. We examined the changes in antioxidant enzymes, proline level, chlorophyll a fluorescence and psb A gene expression at vegetative and reproductive growth stages of B. juncea cultivars (Bio-902, CS-14, Pusa-Tarak and Laxmi). The selected cultivars were exposed to soil (pH 5.2) supplemented with Al (0, 50, 100 and 150 mg kg−1). We observed the lowest decline in photosynthetic efficiency (ΔF/Fm′), ETR, PPFD values and psb A expression to Al stress in the cultivar Bio-902 (tolerant cultivar) followed by CS-14 and Pusa-Tarak whereas the highest decline was observed in the cultivar Laxmi (sensitive cultivar). The improved performance of the cultivar Bio-902 under Al stress was accompanied by an increase in proline level, CAT and APX activities but without any increase in SOD activity. However, significant increase in SOD activity was observed in Laxmi.
1. Introduction
In soil, aluminum (Al) is one of the abundant metals which contributes to approximately 7% of the earth’s crust. About half of the arable lands have acidic soil (Divya Sri et al. Citation2016). Al toxicity is the major limiting factor in acidic soil for agricultural production (Gupta et al. Citation2013). Al adversely affects plant growth in its cationic form (Al3+) by causing injury to root cells and interferes with nutrient and water uptake in crop plants at low pH (Gupta et al. Citation2013). Excessive Al content in the soil causes higher accumulation of reactive oxygen species which leads to oxidative damage in plants (Yamamoto et al. Citation2001; Zheng and Yang Citation2005; He et al. Citation2014). However, despite huge crop losses due to Al toxicity, currently no effective strategies are available for Al removal and improved crop production in Al contaminated soil. In this context, identification and cultivation of Al-tolerant cultivars may be one such solution that leads to increased agricultural production in acidic soil. A tolerant cultivar is capable of growing easily in contaminated soils. Therefore, the study of a set of growth and biochemical parameters and tolerance ability of the plants are necessary before claiming the cultivar as ‘tolerant.’ Tolerance power of plants against abiotic stress basically depends on the level of the antioxidant system. The antioxidant system aids in achieving the plant tolerance by decreasing the level of reactive oxygen species (ROS) (Suzuki et al. Citation2012). Chlorophyll a fluorescence and activity of antioxidant enzymes are used to observe adverse environmental effects on plants as there is a reduction in photosynthetic efficiency (Leipner et al. Citation1999) and increase in antioxidant activity under stressful conditions (Mittal et al. Citation2012). In the previous studies, chlorophyll a fluorescence parameters were used to measure the damage caused to photosystem II (Maxwell and Johnson Citation2000) and tolerance capacity of a cultivar under adverse environmental conditions (Li et al. Citation2006; Mittal et al. Citation2012; Batra et al. Citation2014; Baunthiyal and Sharma Citation2014). Therefore, chlorophyll a fluorescence is a reliable parameter for measuring tolerance potential of crop cultivars as it is non-invasive, easy and instantaneous as well as more precise and sensitive in comparison to many other methods.
Several genes associated with photosystem I and II also show sensitivity towards adverse environment namely drought (Degenkolbe et al. Citation2009; Hayano-Kanashiro et al. Citation2009; Zhang et al. Citation2015), salt (Chaves et al. Citation2009) and light (Murchie et al. Citation2005). The psb A gene which is responsible for D1 protein of PSII is also a stress-responsive gene in plants (Tyagi and Chandra Citation2006). Further study of the psb A gene may also help in determining the best tolerant cultivar.
The most significant factor to enhance agricultural yield in contaminated soil is the identification and cultivation of Al-tolerant cultivars. India is the second largest producer of Brassica juncea in the world (Shah Citation2007). In recent decades, B. juncea (family – Brassicaceae) has drawn the attention of researchers because of its high biomass production with additional economical value.
The present study was carried out to assess the chlorophyll a fluorescence, biochemistry and psb A gene expression in four cultivars of B. juncea cultivars, namely (Bio-902, Pusa-Tarak, CS-14 and Laxmi) in the presence of Al stress. We also investigated the effect of Al on anti-oxidative systems to identify the correlation among Al stress and cultivar tolerance.
2. Materials and methods
2.1 Plant material and their growth
The seeds of four cultivars of B. juncea (L.) Czern (CS-14, Laxmi, Pusa-Tarak and Bio-902) were obtained from Krishi Vigyan Kendra (Agricultural Science Centre, Banasthali Vidyapith, India). The seeds of the selected cultivars were sterilized by using 0.01% HgCl2 and subsequently washed in distilled water. The sterilized seeds were sown in petriplates and three seedlings (4 days old) were transferred in each pot (soil pH 5.2). The original pH of soil in pots at room temperature was 7.3 and was maintained at 5.2 by the addition of 25% ammonia solution by volume. The pH was determined by using 1:2.5 soil and water suspension by glass electrode (Jackson Citation1973). The pH maintained pots were kept in sunlight for approximately 20 days to allow evaporation of excessive water. The pots were kept in a culture room at a 20 ± 2°C temperature and 16 h photoperiod. The various chlorophyll a fluorescence parameters, antioxidants level and level of the psb A gene expression were investigated in 60 days (vegetative stage) and 120 days (reproductive stage) old plants at various concentrations of Al (0, 50, 100, 150 mg kg−1). All the experiments were done in triplicate. The source used for Al was AlCl3.
2.2 Determination of soil organic content
The organic content of the soil was determined by Walkley and Black’s (Citation1934) as described by Abraham (Citation2013). 0.5 gm of soil sample was taken into a conical flask. Ten milliliter of 1 N K2Cr2O7 was added to the soil followed by the addition of 10 ml conc. H2SO4 and the mixture was gently swirled until the soil was mixed with reagents. The flask was allowed to stand on an insulating sheet for 30 min. Hundred milliliter of double distilled water was added in the above solution followed by four drops of o-phenanthroline indicator solution. The excess of dichromate with soil solution was back titrated with 0.5 M Fe (NH4)2 (SO4)2.6H2O solution. Simultaneously a blank was also run using the same procedure but with no soil sample.
Organic carbon content in the sample was calculated aswhere ‘B’ is the volume of ferrous solution used in the blank titration, ‘S’ is the volume of ferrous solution used in the sample titration, and ‘M’ is molarity of Fe.
2.3 Determination of dry biomass and Al content
The dry biomass and accumulation of Al in different plant parts were also determined in our earlier study (Yadav et al. Citation2018).
2.3.1 Dry biomass
Variation in dry biomass (%) with respect to stress was calculated using the formula (Thimmaiah, Citation1999):
2.3.2 Accumulation of Al
The roots, shoots, leaves and seeds of 60 and 120 days old plants were harvested and immersed in 5 mM CaCl2 for 5 min. Thereafter, the samples were washed with distilled water. These were then dried in an oven at 80°C for 3 days. Hundred milligram of the dried sample was homogenized to prepare an ash sample. Two milliliter of 3 M HNO3 was added to this ash sample. This solution was evaporated by keeping it at 480°C for 4 h to get a dry sample. To it 2 ml of conc. HCl was added and the solution was filtered through Whatman filter paper no. 42. The Al content was determined in the sample using Atomic Adsorption Spectrophotometer (Thermo Scientific Ice 3000).
2.4 Measurement of photosynthetic pigments
The level of photosynthetic pigments (total Chl, Chl a and b and Car) in control and Al-treated plants was measured using Arnon’s method (Citation1949). The photosynthetic pigments were extracted by grinding the leaves in a chilled mortar pestle using 5 ml of chilled 80% acetone. The homogenate was centrifuged at 10,000 rpm for 10 min at 4°C. The concentration of the photosynthetic pigments was calculated in mg g−1 dry weight of the sample.
Total Chl Content (mg l−1) = (A645 × 20.2) + (A663 × 8.3)
Chl a content (mg l−1) = (A663 × 12.7) − (A645 × 2.69)
Chl b content (mg l−1) = (A645 × 22.9) − (A663 × 4.68)
Car (mg l−1) = (A480 × 200)
2.5 Chlorophyll a fluorescence measurements
Chlorophyll a fluorescence parameters were measured using DUAL PAM 100 of H. Walz (Effeltrich, Germany) according to the method given by Klughammer and Schreiber (Citation2008). The fluorescence measurements were performed on 60 days (vegetative stage) and 120 days (reproductive stage) old plants. The quantum efficiency of PS II and the rate of electron transport (ETR) through PS II were measured simultaneously. The effective quantum yield of PS II (ΔF/Fm′) was determined by the formula (ΔF/Fm′) = (Fm′ – F)/Fm′, where F is the minimal fluorescence and Fm′ is the maximal fluorescence of light adapted leaves under a saturating light pulse i.e. 800 ms (Genty et al. Citation1989). Apparent ETR was then obtained as ETR = ɸPSII × PPFD × 0.5, where 0.5 accounts for equal excitation of both photosystems I and II, photosynthetic photon flux density (PPFD) (µ mol photon m−2 s−1) is absorbed light; ɸPSII is the quantum yield of PSII (Genty et al. Citation1989). The photosynthetic performance was determined using the light curve program of DUAL PAM, with increasing level of PPFD for 5 min, in 10 steps for 30 s each. The PPFD values varied from 0, 500, 1000 up to 1953 µ mol m−2 s−1. At the end of each light curve, a saturation pulse was applied and the chlorophyll a fluorescence parameters were recorded. The regression lines of light response curves were used to calculate the effective saturating photosynthetic photon flux density (PPFDsat), maximum electron transport rate (ETRmax), quantum yield (ΔF/Fm′) and, PPFD and ΔF/Fm′ at half ETRmax.
2.6 Measurement of proline
The proline level was estimated in leaves of control and Al-treated plants by following the method of Bates et al. (Citation1973). The chromophore from leaves was extracted using toluene and the absorbance was recorded at 520 nm. The standard curve was plotted using L-proline (0–100 µg ml−1) to measure the level of proline. The concentration of proline was expressed in µg g−1 fresh weight of leaves.
2.7 Measurement of protein
The protein content in B. juncea cultivars was measured quantitatively by using the method as given by Lowry et al. (Citation1951).
2.8 Extraction and analysis of antioxidant enzymes
The extraction of the enzymes was done by homogenizing the 1 g leaves in 5 ml extraction buffer (1 mM EDTA, 0.05% Triton X – 100, 2% PVP and 1 mM ascorbate in 50 mM phosphate buffer of pH 7). The homogenized samples were centrifuged at 13,500 rpm at 4°C for 30 min. The supernatant was used as enzyme extract.
2.8.1 Catalase activity (CAT)
For the estimation of CAT activity, 0.1 ml of enzyme extract was added to 2.8 ml of 50 mM phosphate buffer (pH 7.0). The absorbance of the solution was taken at 240 nm. The changes in absorbance were recorded at 240 nm after addition of 0.1 ml H2O2 to the solution. The analysis of enzyme activity was carried out following the method of Aebi (Citation1984).
2.8.2 Ascorbate peroxidase activity (APX)
The ascorbate peroxidase activity was analyzed according to the method of Asada (Citation1984). 0.1 ml of enzyme extract was mixed with 2.8 ml of reaction buffer (0.5 mM ascorbic acid and 50 mM phosphate buffer, pH 7.0. To this solution, H2O2 (0.1 ml) was added and changes in absorbance were recorded at 290 nm.
2.8.3 Superoxide dismutase activity (SOD)
The method of Beauchamp and Fridovich (Citation1971) was used to analyze the activity of SOD in terms of ability to inhibit the nitroblue tetrazolium (NBT) reduction to formazon. The inhibition of NBT reduction was recorded at 560 nm.
2.9 Gene expression level
2.9.1 RNA isolation and purification
Two hundred and fifty milligrams of leaf samples were crushed in liquid nitrogen and homogenized in 1.5 ml of Trizol. Then it was placed at room temperature for 10 min. 0.4 ml of chloroform was added in it and was centrifuged at 11,000 rpm for 15 min at 4°C. The upper aqueous phase was collected and 1 ml of 100% isopropanol was added and kept at room temperature for 10 min. The reaction mixture was centrifuged at 10,000 rpm for 10 min at 4°C. The RNA was sedimented in pellet and washed thrice using 75% ethanol via centrifugation at 7500 rpm for 5 min. The RNA was mixed in 30 µl DEPC water and stored at −80°C for further use.
2.9.2 Determination of RNA quality
RNA was diluted with the use of nuclease-free water and concentration was calculated by measuring absorbance at 260 nm using the formula:
Concentration (µg ml−1) = A260 × 40 × Dilution factor. The purity of RNA was determined by calculating the ratio of absorbance at 260 and 280 nm (A260/280 > 1.8).
2.9.3 cDNA synthesis
Five micrograms of the isolated RNA were treated with DNase I at 25°C for 15 min and was kept at 75°C for 5 min. From this, 3 µg of RNA was taken and the volume was made up to 9 µl with nuclease-free water. Two microliter Random hexamer was added and centrifuged at 1000 rpm for 10 min at 4°C and kept it for 10 min at 65°C followed by incubation for 2 min at room temperature. Various reagents such as RNase inhibitor – 1 µl, 100 mM DTT – 1 µl, 5X assay buffer – 4 µl, 10 mM dNTP Mix – 2 µl, M-Mulv reverse transcriptase – 1 µl and nuclease-free water 1 µl were added in the reaction mixture and centrifuged slowly at 1000 rpm for 15 s. Reaction mixture were kept at 37°C for 1 h for cDNA synthesis, followed by heating at 70°C for 15 min to stop the reaction.
2.9.4 Real time reverse transcriptase (RT) PCR/qRT-PCR
The expression of the psb A gene was detected using qRT-PCR in two selected cultivars i.e. Bio-902 (most tolerant) and Laxmi (most sensitive) under Al stress. The gene expression was estimated by following the method of Sharma et al. (Citation2014).
Primer pairs specific to B. juncea psb A gene (NCBI accession numbers AOAOPOKT86) cDNA (sense primer, 5′-TAC GTT CRT GCA TAA CTT CC-3′ and antisense primer 5′- CGA AGC TCC ATC TAC AAA TGG-3′) were used. Primer pairs of B. juncea ubiquitin 9 gene (UBQ9) (sense primer, 5′-GAA GAC ATG TTC CAT TGG CA-3′, antisense primer 5′- ACA CCT TAG TCC TAA AAG CCA CCT-3′) were used as a reference gene for internal control (Chandna et al. Citation2012).
For qRT-PCR, 2 µl of diluted cDNA (1:10, cDNA: RNase free water) was mixed with 10 µl SYBR Green PCR master mix, 0.5 µl of both forward and reverse primer and make the final volume up to 20 µl with RNase free water. The real time PCR conditions included an initial activation step at 95°C for 5 min, denaturation at 95°C for 30 s and combined annealing/extension at 60°C for 30 s. Melt curve analysis of PCR product was carried out at 72°C for 1 min and ramped from 72°C to 98°C by 1° every 5 s.
The relative gene expression was measured in fold change using the formula given below:where ΔCt = Ct, target – Ct, normalizer and Δ(ΔCt) = ΔCt, stimulated – ΔCt, Control.
2.10 Statistical analysis
The data have been presented as Mean ± SD (n = 3). The statistical analysis was performed using SPSS (version 17.0). The analysis was conducted by compare means test, using One Way Analysis of Variance (ANOVA) and then by applying post-hoc-Tukey’s test. Sigma Plot 12.0 software was used to plot the graphs.
3. Results
The experiments were performed to study the effect of Al stress on various parameters of chlorophyll a fluorescence, antioxidants level and the psb A gene expression at both vegetative and reproductive growth stages of B. juncea cultivars (Bio-902, CS-14, Pusa-Tarak and Laxmi). All the four cultivars of B. juncea exposed to Al stress revealed significant differences in sensitivity towards Al. The toxic effects of Al were clearly observed on photosynthetic performance, photosynthetic pigments and antioxidant enzyme activity at both stages for all the cultivars.
3.1 Soil organic content
The type and texture of soil was sandy and light brown in color and the organic content of the soil was 0.12 g kg−1 or 1.2%.
3.2 Effect of Al on photosynthetic pigments
The level of photosynthetic pigments was significantly reduced in all the cultivars as there was an increase in Al stress at both the growth stages (ANOVA, p < .001). During the vegetative stage, at a concentration of 150 mg kg−1, the cultivar Bio-902 had the lowest reduction followed by CS-14 and Pusa-Tarak in total chl (75.9%, 78.4%, 81.2%, respectively), chl a (74%, 76%, 80.9%, respectively) and chl b contents (78.6%, 82.6%, 84%, respectively) whereas the cultivar Laxmi did not germinate at this concentration. In all the cultivars namely Bio-902, CS-14 and Pusa-Tarak, the chl a:b increased (1.20 folds, 1.39 folds, 1.19 folds, respectively) with an increase in the concentration of Al stress reaching its highest at 150 mg kg−1 Al concentration. The carotenoid level also varies significantly at different Al concentrations. The carotenoid level declined to 74.1%, 78% and 78.5% in Bio-902, CS-14 and Pusa-Tarak respectively when exposed to 150 mg kg−1 Al (). Similarly, at the reproductive stage, the reduction in all the photosynthetic pigments was in the order Bio-902 < CS-14 < Pusa-Tarak < Laxmi ().
Table 1. Pigment and protein contents in 60 days old four cultivars of B. juncea (Bio-902, CS-14, Pusa-Tarak and Laxmi) treated with various concentrations of Al (0, 50, 100 and 150 mg kg−1).
Table 2. Pigment and protein contents in 120 days old four cultivars of B. juncea (Bio-902, CS-14, Pusa-Tarak and Laxmi) treated with various concentrations of Al (0, 50, 100 and 150 mg kg−1).
3.3 Effect of Al on chlorophyll a fluorescence
3.3.1 At the vegetative stage
In control plants, the ɸPSII values observed at zero PPFD of selected cultivars (Bio-902, CS-14, Pusa-Tarak and Laxmi) were 0.81, 0.80, 0.79 and 0.80, respectively. In all the cultivars the ɸPSII values decreased with an increase in Al concentrations. However, the ɸPSII value was drastically reduced in cultivar Laxmi suggesting its higher susceptibility to Al stress. When selected cultivars of mustard were treated with 150 mg kg−1 of Al, the ɸPSII values at zero PPFD were reduced to 44.4% in Bio-902, 45% in CS-14 and 51.8% in Pusa-Tarak cultivars whereas the cultivar Laxmi could not grow at this concentration of Al (Figure S1).
The light curves were recorded for each cultivar at different concentrations of Al stress (0, 50, 100, 150 mg kg−1). The regression lines were plotted from light curves to calculate the cardinal points ( and ) presenting the photosynthetic performance of B. juncea cultivars. At highest experimental concentration of Al (150 mg kg−1), all the cardinal points were minimally reduced in the cultivar Bio-902 with reduction of ETRmax (73%), PPFDsat (34.5%), ½PPFDsat (66.6%), ΔF/Fm′sat (68.9%), and ½ΔF/Fm′sat (68.9%) followed by CS-14 [(ETRmax, 82%), (PPFDsat, 36.2%), (½PPFDsat, 69.2%), (ΔF/Fm′sat, 75%), and (½ΔF/Fm′sat, 69.2%)] and Pusa-Tarak [(ETRmax, 84%), (PPFDsat, 37.9%), (½PPFDsat, 69.5%), (ΔF/Fm′sat, 93.6%), and (½ΔF/Fm′sat, 70.3%)] ().
Table 3. Cardinal points of the regression lines of PPFD dependencies of apparent electron transport rate (ETR) and effective quantum yield (ΔF/Fm′) in 60 days old four cultivars of B. juncea (Bio-902, CS-14, Pusa-Tarak and Laxmi) treated with various concentrations of Al (0, 50, 100 and 150 mg kg−1).
Table 4. Cardinal points of the regression lines of PPFD dependencies of apparent electron transport rate (ETR) and effective quantum yield (ΔF/Fm′) in 120 days old four cultivars of B. juncea (Bio-902, CS-14, Pusa-Tarak and Laxmi) treated with various concentrations of Al (0, 50, 100 and 150 mg kg−1).
3.3.2 At the reproductive stage
The results showed that the photosynthetic performance at the reproductive stage of B. juncea was almost similar to the vegetative stage. At the reproductive stage (120 days old cultivars), it was found that all cardinal points (ETRmax, PPFDsat, ½PPFDsat, ΔF/Fm′sat and ½ΔF/Fm′sat) declined under Al stress in all the cultivars (Bio-902, Laxmi, Pusa-Tarak, CS-14) (Figure S2 and ). However, the lowest decline in cardinal points was observed in Bio-902, with the highest decline in the cultivar Laxmi. The inhibitory effect of Al on all the cardinal points increased gradually with increased concentration of Al.
3.4 Effect of Al on proline content
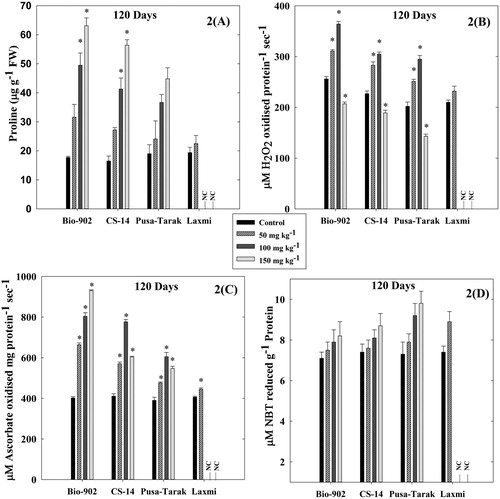
The effect of Al on the proline content in four cultivars namely Bio-902, CS-14, Pusa-Tarak and Laxmi is shown in and . At the vegetative stage, the proline content was maximum in Bio-902 with an increase of 4.3 folds, followed by 3.0 folds increase in CS-14 and 2.9 folds in Pusa-Tarak compared to their controls at 150 mg kg−1. Similarly, at the reproductive stage, the cultivar Bio-902 showed 3.7 folds increase in proline level as compared to other cultivars namely CS-14 (3.41 folds), Pusa-Tarak (2.3 folds) and Laxmi (non-germinated) treated with 150 mg kg−1.
Figure 1. A comparative analysis of changes in proline content (A), CAT activity (B), APX activity (C) and SOD activity (D) in 60 days old four cultivars of B. juncea cultivars (Bio-902, CS-14, Pusa-Tarak and Laxmi, respectively) exposed to different Al concentrations (0, 50, 100 and 150 mg kg−1). (NC represents experiment not conducted due to non-germination of seeds). The data are expressed as Mean ± SD (n = 3). * shows statistical significance (p < .001).
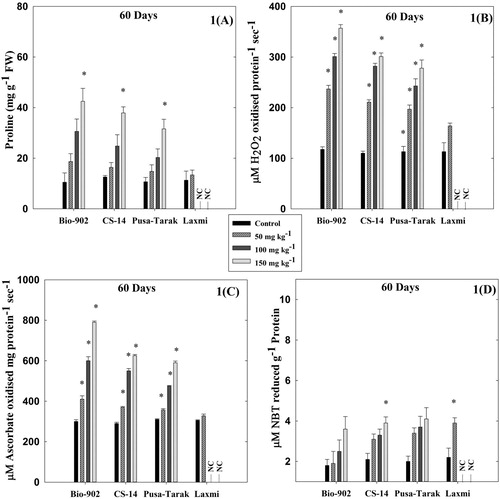
Figure 2. A comparative analysis of changes in proline content (A), CAT activity (B), APX activity (C) and SOD activity (D) in 120 days old four cultivars of B. juncea cultivars (Bio-902, CS-14, Pusa-Tarak and Laxmi, respectively) exposed to different Al concentrations (0, 50, 100 and 150 mg kg−1). (NC represents experiment not conducted due to non-germination of seeds). The data are expressed as Mean ± SD (n = 3). * shows statistical significance (p < .001).
3.5 Effect of Al on protein content
The B. juncea cultivars namely Bio-902, CS-14, Pusa-Tarak and Laxmi showed variability in protein content with increased Al stress ( and ). At the vegetative stage, in Al-tolerant cultivar Bio-902, the protein level increased by 3.22 folds at 150 mg kg−1 of Al. However, in other cultivars (CS-14, Pusa-Tarak and Laxmi), the Al stress also enhanced the level of protein but to a lower level ().
At the reproductive stage, the level of protein significantly increased up to Al conc. 100 mg kg−1 in all the cultivars with the highest increase of 3.8 folds in Bio-902 followed by CS-14 (2.2 folds) and Pusa-Tarak (1.44 folds) (). At 150 mg kg−1 Al, the amount of protein decreased in leaves of three selected B. juncea cultivars (Bio-902, CS-14 and Pusa-Tarak) and the cv. Laxmi was unable to grow at 100 and 150 mg kg−1 Al.
3.6 Effect of Al on antioxidant enzymes
The B. juncea cultivars namely Bio-902, CS-14, Pusa-Tarak and Laxmi showed a variable response in activity of CAT, APX and SOD with increased Al stress ( and ). At the vegetative stage, in Al-tolerant cultivar Bio-902, the activities of CAT and APX increased by 3.0 folds and 2.6 folds, respectively. However, in other cultivars (CS-14, Pusa-Tarak and Laxmi), the Al stress also induced the activity of CAT and APX but to a lower level (). At 150 mg kg−1, the highest increase in SOD activity was observed in Pusa-Tarak (2.1 folds) followed by CS-14 (1.9 folds) and Bio-902 (1.6 folds). The Al-sensitive cultivar Laxmi did not grow at 100 and 150 mg kg−1 of Al concentrations. However, at 50 mg kg−1, the SOD activity was induced to the maximum level in Laxmi (2.2 folds) followed by Pusa-Tarak, CS-14 and the lowest in Bio-902 (1.1 folds) ().
At the reproductive stage, the CAT activity significantly increased up to 100 mg kg−1 Al in all the cultivars with the highest increase of 1.4 folds in Bio-902 followed by CS-14 and Pusa-Tarak (). Similar to the vegetative stage, the cultivar Bio-902 showed a higher activity of APX as compared to other cultivars namely CS-14, Pusa-Tarak and Laxmi. Increase in the SOD activity was again highest in the Al-sensitive cultivar similar to the vegetative stage ().
3.7 Effect of Al on the psb A gene expression
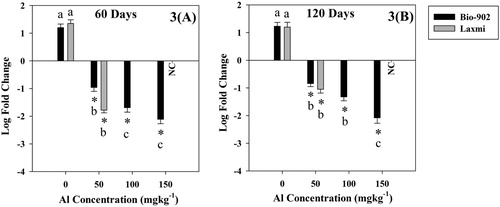
The most tolerant (Bio-902) and sensitive (Laxmi) cultivars of B. juncea showed a variable response to the psb A gene expression under Al stress at both the growth stages (vegetative and reproductive) (). The expression of the psb A gene was down-regulated in both the cultivars i.e. Bio-902 and Laxmi under stress of Al, however, down-regulation was more pronounced in the cultivar Laxmi. During the vegetative stage, the exposure of Al stress (150 mg kg−1) resulted in down-regulation of the psb A gene expression by 2.11 folds in Al-tolerant cultivar Bio-902 whereas sensitive cultivar Laxmi was not germinated at all. Similarly during the reproductive stage, the expression of the psb A gene was less down-regulated in the cultivar Bio-902 in comparison to the cultivar Laxmi ().
4. Discussion
In the present study, we have reported the photosynthetic performance, antioxidant system and level of the psb A gene expression of four B. juncea cultivars (Bio-902, CS-14, Pusa-Tarak and Laxmi) exposed to Al stress. Since photosynthetic performance depends directly on the activity of the photosystems I and II, attention was focused on them to study the environmental effect on plants. In this study, Al caused a decline in pigment content (Chl and Car), photosynthetic efficiency (ΔF/Fm′), ETR and PPFD values of PSII in all the cultivars. However, the lowest decline for Al stress was observed in Bio-902 followed by CS-14 and Pusa-Tarak whereas the highest decline was observed in the cultivar Laxmi (–). The variation in chlorophyll a fluorescence parameters and photosynthetic pigment levels of selected cultivars (Bio-902, CS-14, Pusa-Tarak and Laxmi) may be due to the intrinsic differences between the cultivars. Our results are comparable with the observation of Mihailovic et al. (Citation2008) who reported that the effect of Al on photosynthetic performance varies in maize cultivars. It is also confirmed from earlier study that Al causes a significant reduction in Chl content (Karimaei and Poozesh Citation2016) and photosynthetic performance (Mihailovic et al. Citation2008; Ribeiro et al. Citation2013) in plants. The decline in the photosynthetic performance under stress conditions may be attributed to either the damage of photosynthetic machinery (PSI and PSII) (Mittal et al. Citation2012) or deviation of biochemical processes involving in PSII reaction centers or decline in the catalytic activity of Rubisco or inhibition of chlorophyll synthesis as it is a key component of photosynthesis in plants (Batra et al. Citation2014; Haider et al. Citation2018). Along with this, the reduction in the chlorophyll content can be considered due to the decrease in activity of chlorophyll synthesis enzymes (Haider et al. Citation2018) which may result in inhibition of chl synthesis or high chl degradation in plants under stress conditions (Mittal et al. Citation2012; Baunthiyal and Sharma Citation2014). It has also been observed from this study that as the concentration and duration of the stress increases, the ratio of chl a and b also increases ( and ). Mittal et al. (Citation2012) also reported increased chl a and b ratio under elevated stress concentrations. The ratio of chl a and b indicates the change in PSI and PSII ratio under stress in plants (Anderson Citation1986).
Figure 3. Relative gene expression of the psb A gene at vegetative (A) and reproductive (B) growth stages of tolerant (Bio-902) and sensitive (Laxmi) cultivars of B. juncea. Each value represents the mean of three replicates with ± S.D. Mean differences are significant at 0.01 level.
Proline accumulates in response to abiotic stress and it is a source of carbon and nitrogen (Babaei et al. Citation2017). It provides energy for growth and survival to recover cells (Mittal et al. Citation2012) and improves stress response of plants (Vardharajula et al. Citation2011) and thus is considered as an important non-enzymatic antioxidant. Although all cultivars of B. juncea accumulate more proline with increasing Al concentration, cultivar Bio-902 accumulates the highest level of proline in comparison to other cultivars (CS-14, Pusa-Tarak and Laxmi) ( and ). Similar to our results it is also observed that proline accumulation was more in tolerant cultivar in comparison to sensitive cultivar under stress conditions (Rahneshan et al. Citation2018). The plants subjected to Al toxicity enhance proline level to increase stress tolerance as in Cajanus cajan (Divya Sri et al. Citation2016).
The scavenging potential of ROS is associated with the activity of antioxidant enzymes and the level of mannitol and proline (Xiong et al. Citation2002). H2O2 is considered as a stable signal ROS molecule in plants. CAT and APX enzymes can efficiently scavenge H2O2 induced in plants due to stress. However, APX has higher scavenging affinity for H2O2 in comparison to CAT (Chalanika de silva and Asaeda Citation2017). The activity of antioxidant enzymes showed a progressive increase in four cultivars of B. juncea; the highest increase in the activity of CAT and APX was found in the Al-tolerant cultivar Bio-902 followed by CS-14, Pusa-Tarak and Laxmi ( and ). During the reproductive stage, the decrease in CAT activity at the highest concentration of Al i.e. 150 mg kg−1 was because of photosensitivity of the enzyme () (Panda et al. Citation2003). However, the significant increase in the SOD activity was found in the susceptible cultivar Laxmi followed by Pusa-Tarak, CS-14 and Bio-902 ( and ). The finding of Mittal et al. (2014) shows an increase in antioxidant activity in response to salt stress with the highest activity shown by the tolerant variety. An increase in the activity of antioxidant enzymes (CAT, APX, and SOD) in response to Al stress was also reported in Cajanus cajan (Divya Sri et al. Citation2016). A significant increase was also observed in the activities of ROS enzymes (SOD, POD, CAT, GPX and APX) with respect to abiotic stress (Vardharajula et al. Citation2011; Haider et al. Citation2018).
Protein synthesis in plants is also affected under Al stress and soluble protein is a prime factor to signify the physiological condition of plants. Primarily protein content increases with respect to Al stress indicating adaptive responses along with anti-oxidative enzymes activity, confirming tolerance potential of the B. juncea cultivars. This increase in protein content is due to more synthesis of stress-induced protein under Al stress. However, the synthesis of proteins which are responsible for plant growth is decreased under stress conditions. But at the reproductive stage, there is a decrease in protein content at 150 mg kg−1 of Al concentration and this is possibly due to decrease in synthesis of stress-induced protein along with growth proteins at higher Al concentration. Our results confirm the findings of other researchers (Mittal et al. Citation2012).
We also observed the down-regulation of the psb A gene in B. juncea cultivars under Al stress. The synthesis of D1 protein of PS II in plants is regulated by the psb A gene (Mulo et al. Citation2012). The down-regulation of the psb A gene in Bio-902 and Laxmi cultivars might be due to the aggregation of ROS species under adverse conditions, which led to the reduction of net photosynthetic rate and decreased PSII activity (). Earlier studies have also reported that the genes related to photosystems I and II, RuBisCO subunits and Calvin cycle were repressed under adverse environment such as salt (Chaves et al. Citation2009), drought (Chaves et al. Citation2009; Degenkolbe et al. Citation2009) and light (Kimura et al. Citation2003; Murchie et al. Citation2005).
5. Conclusion
Al toxicity is of major concern in acidic soils worldwide as it decreases crop yield and thereby reduces agricultural productivity. This problem can be partially solved with the use of tolerant cultivars in Al-rich soils. On the basis of our results, parameters such as chlorophyll a fluorescence, psb A gene expression level, enzymatic and non-enzymatic antioxidant activity can be used as sensors to monitor and validate tolerant cultivars and can also be applied in ecophysiological studies to estimate crop damage. As evaluated from several parameters such as chlorophyll a fluorescence, proline accumulation and activity of antioxidants, the cultivar Bio-902 has been analyzed to be most tolerant amongst the selected four cultivars whereas the cultivar Laxmi is most susceptible to Al stress. Thus, it is suggested that the cultivar Bio-902 may be used in remediation of Al without a reduction in agricultural productivity. Also, the cultivar Bio-902 can be recommended in breeding programs as a germplasm to develop new tolerant cultivars against Al.
Supplemental Material
Download JPEG Image (2.3 MB)
Supplemental Material
Download JPEG Image (2.3 MB)
Acknowledgments
A Junior Research Fellowship provided to Manisha Yadav by University Grants Commission, New Delhi, India, is gratefully acknowledged.
Disclosure statement
No potential conflict of interest was reported by the authors.
Related Research Data
References
- Abraham J. 2013. Organic carbon estimations in soils: analytical protocols and their implications. Rubber Sci. 26(1):45–54.
- Aebi H. 1984. Catalase in vitro. Methods Enzymol. 105:121–126. doi: 10.1016/S0076-6879(84)05016-3
- Anderson JM. 1986. Photoregulation of the composition, function and structure of thylakoid membranes. Annu Rev Plant Physiol. 37:93–136. doi: 10.1146/annurev.pp.37.060186.000521
- Arnon DI. 1949. Copper enzymes in isolated chloroplast, polyphenol oxidase in Beta vulgaris. Plant Physiol. 24:1–1. doi: 10.1104/pp.24.1.1
- Asada K. 1984. Chloroplasts: formation of active oxygen and its scavenging. Methods Enzymol. 105:422–435. doi: 10.1016/S0076-6879(84)05059-X
- Babaei K, Seyed Sharifi R, Pirzad A, Khalilzadeh R. 2017. Effects of bio fertilizer and nano Zn-Fe oxide on physiological traits, antioxidant enzymes activity and yield of wheat (Triticum aestivum L.) under salinity stress. J Plant Interact. 12(1):381–389. doi: 10.1080/17429145.2017.1371798
- Bates LS, Aldren RP, Teare LD. 1973. Rapid determination of free proline for water stress studies. Plant Soil. 39:205–207. doi: 10.1007/BF00018060
- Batra NG, Sharma V, Kumari N. 2014. Drought-induced changes in chlorophyll fluorescence, photosynthetic pigments, and thylakoid membrane proteins of Vigna radiata, J Plant Interact. 9(1):712–721 doi: 10.1080/17429145.2014.905801
- Baunthiyal M, Sharma V. 2014. Response of three semi-arid plant species to fluoride; consequences for chlorophyll florescence. Int J Phytoremediation. 16(4):397–414. doi: 10.1080/15226514.2013.783790
- Beauchamp C, Fridovich I. 1971. Superoxide dismutase: improved assays and an assay applicable to acrylamide gels. Anal Biochem. 44:276–287. doi: 10.1016/0003-2697(71)90370-8
- Chalanika De Silva HC, Asaeda T. 2017. Effects of heat stress on growth, photosynthetic pigments, oxidative damage and competitive capacity of three submerged macrophytes. J Plant Interact. 12(1):228–236. doi: 10.1080/17429145.2017.1322153
- Chandna R, Augustine R, Bisht NC. 2012. Evaluation of candidate reference genes for gene expression normalization in Brassica juncea using real time quantitative RT-PCR. PloS One. 7(5):e36918. doi: 10.1371/journal.pone.0036918
- Chaves MM, Flexas J, Pinheiro C. 2009. Photosynthesis under drought and salt stress, regulation mechanisms from whole plant to cell. Ann Bot. 103:551–560. doi: 10.1093/aob/mcn125
- Degenkolbe T, Do PT, Zuther E, Repsilber D, Walther D, Hincha, DK, Köhl KI. 2009. Expression profiling of rice cultivars differing in their tolerance to long-term drought stress. Plant Mol Biol. 69:133–153. doi: 10.1007/s11103-008-9412-7
- Divya Sri N, Madhan Mohan M, Mahesh K, Raghu K, Seeta Ram Rao S. 2016. Amelioration of aluminium toxicity in Pigeon Pea [Cajanus cajan (L.) Millsp.] Plant by 24-Epibrassinolide. Am J Plant Sci. 7:1618–1628. doi: 10.4236/ajps.2016.712153
- Genty B, Briantais JM, Baker NR. 1989. The relationship between quantum yield of photosynthetic electron transport and quenching of chlorophyll fluorescence. Biochim Biophys Acta. 990:87–92. doi: 10.1016/S0304-4165(89)80016-9
- Gupta N, Gaurav SS, Kumar A. 2013. Molecular basis of aluminium toxicity in plants. A review. Am J Plant Sci. 4:21–37. doi: 10.4236/ajps.2013.412A3004
- Haider MS, Kurjogi MM, Khalil-ur-Rehman M, Pervez T, Songtao J, Fiaz M, Jogaiah S, Wang C, Fang J. 2018. Drought stress revealed physiological, biochemical and gene-expressional variations in ‘Yoshihime’peach (Prunus Persica L) cultivar. J Plant Interact. 13(1):83–90. doi: 10.1080/17429145.2018.1432772
- Hayano-Kanashiro C, Calderon-Vazquez C, Ibarra-Laclette E, Herrera-Estrella L, Simpson J. 2009. Analysis of gene expression and physiological responses in three Mexican maize landraces under drought stress and recovery irrigation. PLoS One. 4(10):e7531. doi: 10.1371/journal.pone.0007531
- He H, He L, Gu M. 2014. Role of micro RNAs in aluminium stress in plants. Plant Cell Rep. 33:831–836. doi: 10.1007/s00299-014-1565-z
- Jackson ML. 1973. Methods of chemical analysis. New Delhi: Prentice Hall of India.
- Karimaei M, Poozesh V. 2016. Effects of aluminum toxicity on plant height, total chlorophyll (Chl a+b), potassium and calcium contents in spinach (Spinacia oleracea L.). Int J Farm Allied Sci. 5(2):76–82.
- Kimura M, Yamamoto YY, Seki M, Sakurai T, Sato M, Abe T, Yoshida S, Manabe K, Shinozaki K, Matsui M. 2003. Identification of Arabidopsis genes regulated by high light-stress using cDNA microarray. Photochem Photobiol. 77:226–233.
- Klughammer C, Schreiber U. 2008. Complementary PS II quantum yields calculated from simple fluorescence parameters measured by PAM fluorometry and the saturation pulse method. PAM Appl Notes. 1:27–35.
- Leipner J, Fracheboud Y, Stamp P. 1999. Effect of growing season on the photosynthetic apparatus and leaf antioxidative defences in two maize genotypes of different chilling tolerance. Environ Exp Bot. 42:129–139. doi: 10.1016/S0098-8472(99)00026-X
- Li R, Guo P, Baum M, Grande S, Ceccarelli S. 2006. Evaluation of chlorophyll content and fluorescence parameters as indicators of drought tolerance in barley. Agric Sci China. 5:751–757. doi: 10.1016/S1671-2927(06)60120-X
- Lowry OH, Rosebrough NJ, Farr AL. 1951. Protein measurement with the folin phenol reagent. J Biol Chem. 193(1):265–275.
- Maxwell K, Johnson GN. 2000. Chlorophyll fluorescence—a practical guide. J Exp Bot. 51:659–668. doi: 10.1093/jexbot/51.345.659
- Mihailovic N, Drazic G, Vucinic Z. 2008. Effects of aluminium on photosynthetic performance in Al-sensitive and Al-tolerant maize inbred lines. Photosynthetica. 46(3):476–480. doi: 10.1007/s11099-008-0082-0
- Mittal S, Kumari N, Sharma V. 2012. Differential response of salt stress on Brassica juncea: photosynthetic performance, pigment, proline, D1 and antioxidant enzymes. Plant Physiol Biochem. 54:17–26. doi: 10.1016/j.plaphy.2012.02.003
- Mulo P, Sakurai I, Aro EV. 2012. Strategies for psbA gene expression in cyanobacteria, green algae and higher plants, from transcription to PSII repair. Biochim Biophys Acta. 1817:247–257. doi: 10.1016/j.bbabio.2011.04.011
- Murchie EH, Hubbart S, Peng S, Horton P. 2005. Acclimation of photosynthesis to high irradiance in rice, gene expression and interactions with leaf development. J Exp Bot. 56:449–460. doi: 10.1093/jxb/eri100
- Panda SK, Singha LB, Khan MH. 2003. Does aluminium phytotoxicity induce oxidative stress in greengram (Vigna radiata)? Bulg J Plant Physiol. 29:77–86.
- Rahneshan Z, Nasibi F, Moghadam AA. 2018. Effects of salinity stress on some growth, physiological, biochemical parameters and nutrients in two pistachio (Pistacia vera L.) rootstocks. J Plant Interact. 13(1):73–82. doi: 10.1080/17429145.2018.1424355
- Ribeiro MAQ, Almeida AAF, Mielke MS, Gomes FP, Pires MV, Baligar VC. 2013. Aluminum effects on growth, photosynthesis, and mineral nutrition of cacao genotypes. J Plant Nutr. 36(8):1161–1179. doi: 10.1080/01904167.2013.766889
- Shah SH. 2007. Effects of salt stress on mustard as affected by gibberellic acid application. Gen Appl Plant Physiol. 33(1–2):97–106.
- Sharma I, Kumari N, Sharma V. 2014. Defense gene expression in Sorghum bicolor against Macrophomina phaseolina in leaves and roots of susceptible and resistant cultivars. J Plant Interact. 9(1):315–323. doi: 10.1080/17429145.2013.832425
- Suzuki N, Koussevitzky S, Mittler RON, Miller GAD. 2012. ROS and redox signalling in the response of plants to abiotic stress. Plant Cell Environ. 35(2):259–270. doi: 10.1111/j.1365-3040.2011.02336.x
- Thimmaiah SK. 1999. Standard methods of biochemical analysis. New Delhi: Kalyani Publishers. p. 534.
- Tyagi A, Chandra A. 2006. Isolation of stress responsive PsbA gene from rice using differential display. Indian J Biochem Biophys. 43: 244–246.
- Vardharajula S, Zulfikar Ali S, Grover M, Reddy G, Bandi V. 2011. Drought-tolerant plant growth promoting Bacillus spp.: effect on growth, osmolytes, and antioxidant status of maize under drought stress. J Plant Interact. 6(1):1–14. doi: 10.1080/17429145.2010.535178
- Walkley A, Black IA. 1934. An examination of the Degtijariff method for determining soil organic matter and a proposed modification of the chromic acid titration method. Soil Sci. 37:29–38. doi: 10.1097/00010694-193401000-00003
- Xiong L, Schumaker KS, Zhu J-K. 2002. Cell signaling during cold, drought and salt stresses. Plant Cell. 14:S165–S183. doi: 10.1105/tpc.000596
- Yadav M, Sharma V, Kumari N. 2018. Phytoremediation efficiency of Brassica juncea cultivars at vegetative and reproductive growth stages under individual and combined treatment of fluoride and aluminium. Int J Phytoremediation. 20(9):922–929. doi: 10.1080/15226514.2018.1448361
- Yamamoto Y, Kobayashi Y, Matsumoto H. 2001. Lipid peroxidation is an early symptom triggered by aluminum, but not the primary cause of elongation inhibition in Pea roots. Plant Physiol. 125(1):199–208. doi: 10.1104/pp.125.1.199
- Zhang C, Zhang L, Zhang S, Zhu S, Wu P, Chen Y, Li M, Jiang H, Wu G. 2015. Global analysis of gene expression profiles in physic nut (Jatropha curcas L.) seedlings exposed to drought stress. BMC Plant Biol. 15(1):17. doi: 10.1186/s12870-014-0397-x
- Zheng SJ, Yang JL. 2005. Target sites of aluminum phytotoxicity. Biol Plant. 49(3):321–331. doi: 10.1007/s10535-005-0001-1