
ABSTRACT
To investigate the deeper coloring mechanism of berry, the ‘Benitaka’ (Be) grape, ABA treatment on ‘Benitaka’ (Be (ABA)), and its deeper coloring bud mutation ‘Brasil’ (Br) grape were compared three weeks post-ABA treatment (11 weeks post-flowering, 200 mg/g ABA). Firstly, the ABA-treated group exhibited a deeper coloring at three weeks post-ABA treatment than the ‘Brasil’. Deeper color in ‘Brasil’ was caused by higher content of peonidin-3-O-monoglucoside, malvidin-3-O-monoglucoside, and malvidin-3-O-coumarylglucoside, while the deeper color in ABA-treated group was mainly caused by higher content of cyanidin-3-O-monoglucoside and peonidin-3-O-monoglucoside. In addition, the results revealed that ‘Brasil’ showed deeper coloring than ‘Benitaka’ was probably due to the higher expression of the VvmybA1 and VvmybA1-1 genes, similar with ABA-treated group. Compared with ‘Benitaka’, the distinction between the ABA-treated group and ‘Brasil’ was the expression of VvmybA1 gene. The gene expression was delayed in the ABA-treated group until three weeks post treatment. The VvmybA1 gene and transcription factor play an important role in the anthocyanin biosynthesis, and showed the difference in expressions of the VvmybA1 and VvmybA1-1 gene during different period of time probably due to different kind of anthocyanins. Based on these results, a possible mechanism of anthocyanins biosynthesis was established to elaborate the reason for the deeper coloring in ABA-treated ‘Benitaka’ and ‘Brasil’ grapes.
KEYWORDS:
Introduction
Grape is a popular fruit crop around the globe. The table grape cultivar ‘Italia’ (Vitis vinifera), was obtained from a cross between ‘Bicane’ and ‘Muscat’ from Hamburg. The berries of ‘Italia’ are very large with thick pericarp, having a slightly musky flavor, and the pericarp shows amber yellow becoming pinkish and crunchy at full maturity stage (Carreno et al. Citation1998). ‘Italia’ has produced a couple of bud mutation cultivars including Ruby Okuyama, Flame Muscat, ‘Benitaka’ and ‘Brasil’ (Kobayashi et al. Citation2001; Leão et al. Citation2011). Among these, the ‘Benitaka’ grape shows red color at the ripening time, while the ‘Brasil’ grape, which was obtained from ‘Benitaka’, always has a deeper color compared with ‘Benitaka’ during their ripening time.
These color mutations have been proven to be determined by the variety of anthocyanin (Boss et al. Citation1996a). The anthocyanin biosynthetic pathway was discovered approximately 30 years ago. Five primary anthocyanins (Cyanidin-3-glucoside, Peonidin-3-glucoside, Malvidin-3-glucoside, Petunidin-3-glucoside and Delphinidin-3-glucoside) have been demonstrated in grapes as well as in other fruit crops (Boss et al. Citation1996b; Fraige et al. Citation2014). The Cyanidin, Peonidin and Malvidin were mostly found in red table and red-wine grape (Roggero et al. Citation1986; Negro et al. Citation2003; Cho et al. Citation2004). The Cyanidin can also be found in black raspberries (Tulio et al. Citation2008). The Delphinidin can be detected in blue-red pericarp colored grapes as well as in concord grapes (Ribéreau-Gayon and Ribéreau-Gayon Citation1958) and the specific anthocyanins present in the ‘purple’ or ‘black’ tomatoes are mainly petunidin (Mes Citation2004). More than 30 anthocyanin derivative varieties have been confirmed in grapes (He et al. Citation2010). Genes and transcription factors take an important roles in the anthocyanin biosynthetic pathway (Mol et al. Citation1989). The hotspot which caused the most color sport in grapes were found to be on the VvMybA1 gene or transcription factor. Researchers found that the VvMybA1 gene was suppressed due to a retrotransposon insert on the promoter region of VvMybA1 in white grapes, while it can be expressed in color mutation cultivars (Kobayashi et al. Citation2004). Another study reported that the deletion of VvMybA1 in white grape was the main reason causing black-pericarp ‘Pinot Noir’ to change to white-skinned ‘Pinot Noir’ mutation (Yakushiji et al. Citation2006). The WD40-bHLH-MYB protein complex was proved involved in controlling of anthocyanin biosynthesis in coloring plants, which can regulate anthocyanin biosynthesis-related genes (Ramsay and Glover Citation2005). Since anthocyanin biosynthesis influences the coloring, besides myb genes, any changes on anthocyanin biosynthesis function-genes, such as CHS1, PAL, 4CL, CHI, F3H1, DFR, LDOX, 5GT, ANS, 3GT and UFGT, could affect the berry’s coloring (Kobayashi et al. Citation2001). Other factors which influence on coloring were environmental conditions such as high temperature or high sunlight which can also reduce the biosynthesis of anthocyanin (Mori et al. Citation2005; Miao et al. Citation2016). In addition, the study by detected SSR molecular markers, SNPs, structure variations and Indels by whole genome re-sequence strategy was also applied to study the mechanism of coloring bud sports (Xu et al. Citation2016).
Grapes are categorized as non-respiratory fruit. The endogenous hormone abscisic acid (ABA) plays an important role in the ripening and coloring on berries and grape cell cultures. Numerous experiments on different grape cultivars have confirmed that treating clusters with proper concentration of exogenous ABA before veraison, will contribute to coloring on berries (Peppi et al. Citation2006; Gagnéet et al. Citation2011; Roberto et al. Citation2012, Citation2013; Yamamoto et al. Citation2015). The NECD was revealed to be a key gene on the ABA biosynthesis pathway (Seo and Koshiba Citation2002). Some non-synonymous SNPs and structure variations on the NECD9 gene were found by a whole genome re-sequencing of Summer Black and it’s ten-days-earlier coloring and ripening bud mutation cultivar (Xu et al. Citation2016). By treating V. vinifera cv. Cabernet Sauvignon grape berries with 1000 mg·L−1 of ABA, Jeong et al proved that the genes, mentioned above, which participated in the anthocyanin biosynthesis pathway were all increased at two to four weeks after veraison (Jeong et al. Citation2004). Some studies also proved application of abscisic acid on Br hybrid grape Isabel (V. vinifera × Vitis labrusca) not only promoted coloring but also increased the content of antioxidant capacity and phenolic composition of grape juice (Koyama, et al. Citation2014; Yamamoto et al. Citation2015). Based on previous studies above, what’s the difference among Be, deeper color bud sports cultivar Br, and Be grapes treated with ABA?
As far as we know, most varieties of anthocyanins were detected by HPLC-LC/MS/MS method (Huang et al. Citation2009; Zhang et al. Citation2016). Here, we use the new hybrid quadrupole time-of-flight tandem mass spectrometer (TripleTOF 5600+AB) instrument which is an innovation in LC-MS/MS performance that provides rapid profiling and qualitative exploration while uniquely integrating comprehensive and high-resolution quantitation workflows on one platform. Also, it combines high resolution, high-sensitivity detection with stable mass accuracy and fast acquisition speeds over periods of days (Andrews et al. Citation2011).
In order to figure out the difference in anthocyanins between the black and red coloring bud mutations of Be and Br, we tried to further explore other possible mechanisms of grape bud sports and the effects on berries treated by ABA. The present study was aimed to explore the molecular as well as physiological changes in treated and not treated berries peel with ABA.
Methods
Treatment on plant materials
The eight years old Be and Br grapevines were planted at the vineyard of Nanjing Agriculture University (Houjiatang, Nanjing City, Jiangsu Province, China). The trees were grown under a shelter which protected the trees from the rain. The tree’s shape on top view was an ‘H’. One side of (south side of the ‘H’ tree form) 10 clusters was dipped with 25 mg/L gibberellic acid (GA3) for five seconds at full flowering periods and again dipped after two weeks interval; then the clusters were bagged. The Be group involved 10 clusters dipped in 200 mg/g ABA (Sigma, Shanghai, China.) for five seconds before veraison (eight weeks post flowering). The opposite side (north side of the ‘H’ tree form) of Be and Br 10 clusters were dipped in distilled water as a control. After dipping in ABA solution the branches were slightly shaked. The berries of Be, Be (ABA), and Br were collected at one week to four weeks post treatment. The berries were put into an ice box and shifted in to lab for further analysis. The peels from the berries were removed and put into liquid nitrogen and stored at −80°C.
Determination of physiological parameters
Three weeks post- ABA treatment (11 weeks post flowering) berries were sampled to measure the physiological index. The content of anthocyanins was determined as described by Mori et al. (Citation2005) with some modifications. Ten g of grape peel were ground and soaked in 100 mL of 1% methanoic acid methyl alcohol solution for 12 h, kept in a dark place at 23°C, then centrifuged at 6000 g for 20 min. The supernatant was detected at 530 nm by a Microplate Reader (SynergyH4, BioTek company, America). We set the absorbancy A = 0.1 which amounts to 1 g sample soaked at 10 mL methanoic acid methyl alcohol solution as one unit of anthocyanins (U). The cross diameter and vertical diameter were measured by vernier caliper, the fruit’s weight was measured by electronic balance, (twenty berries were measured each time). The titratable acid (TA, %) was titrated by a solution of 1% mol/L NaOH with three duplicates. The total soluble solids (TSS, oBrix) were measured by saccharimeter (Master-M, ATAGO company, Japan). All the physiological parameters were measured by three technical repetitions.
Triple TOF 5600+ AB-LC/MS/MS analysis anthocyanins
The extraction of anthocyanins was carried out following the above-described methods. The supernatant was filtered through a 0.22μm membrane after centrifuging, and analyzed by a Triple TOF 5600+ AB-LC/MS/MS instrument (AB SCIEX company, USA). The procedure set was as described by Zhang et al. (Citation2016) with some modifications. The mobile phase of aqueous 0.1% formic acid (solvent A) and acetonitrile (solvent B) were employed for the Triple TOF 5600+ AB- LC/MS/MS analysis. At a flow rate of 0.2 mL/min, the following linear gradient was used (proportion of solvent B): 0–5 min, 10%; 5–40 min, 5–95%; 40–50 min, 95%; 50–52 min, 95–10%; and 52–60 min, 10%. The shot volume was 5 μL each time with 525 nm set as the detection wavelength. The positive ion was carried out on MS pattern and the instrument parameters used an ESI interface with 35 psi as nebulizer pressure, using N2, 10 L/min drying gas, a 300°C drying gas, and scan range of 150–1200 m/z. The duration time set as 42 min, 65 ion source gas 1, 65 ion source gas 2, 35 curtain gas, 550 temperature and 5500 ionspray voltage floating, 80 declustering potential and 10 collision energy. The Masterview software (SCIEX company, US) was used to input the information of the chemical formula of different varieties of anthocyanins and their relative molecular weight. One ‘H’ proton was added to each of the relative molecular weights. The Peakview software (SCIEX company, US) was applied to detect the peak of anthocyanins. We inputted the information about different anthocyanins to Masterview software as described by (He et al. Citation2010). The labeled instrumentation and protocol enabled the identification of anthocyanins based on mass accuracy, retention time, isotope abundance, and second-order spectrum. After comparing the chemical formula and relative molecular weight with recorded data on the Masterview software, the desired anthocyanins were selected. In this study, no standard samples and standard curves were made. The peak intensity and peak area square roughly represent the relative content of anthocyanin.
RNA extracted and RT-qPCR experiments
The RNA of Be, Be (ABA) and Br from one week to four weeks post-treatment peels were extracted using a plant total RNA isolation kit (Foregene Company, Chengdu, China) with three biological replication. After detection by 2% agarose gel, all three biological replicates were mixed, and then the RNA was inverse transcribed by an inverse transcription kit (Takara, Shanghai, China) to make cDNA. After detecting the cDNA using the VvActin housekeeping gene, the genes CHS1, PAL, 4CL, CHI, F3H1, DFR, LDOX, 5GT, ANS, 3GT, VvmybA1, VvmybA1-1, VvmybA1b, VvmybA1C, WD40 and OMT, which involved in anthocyanin biosynthesis and color-control, were selected for a RT-qPCR experiment at one to four weeks after-treatment with ABA. The primers of these genes were designed by Beacon Designer 7 software; the primers were placed in the supplementary file 1. The genes expression were detected by 7300 Real Time PCR system (Life company, America), with three technical duplications. The relative expression of genes was calculated by the 2−ΔΔC T Method (Livak and Schmittgen Citation2001). The data were analyzed by SPSS statistics 17.0 software.
Results
Physiological traits of berries
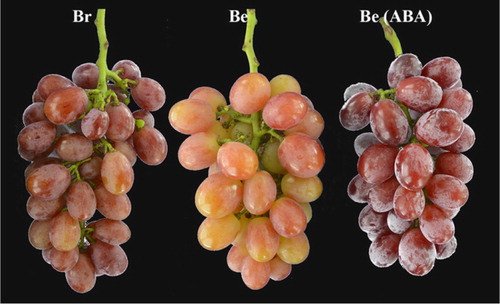
The treated Be berries (Be (ABA) showed much deeper color compared with Be and Br, and Br looked deeper than Be three weeks post-ABA treatment (11 weeks post- flowering). All the color was formed with strip texture ().
Figure 1. Picture of Br, Be and Be (ABA) three weeks post-ABA treatment (11 weeks post flowering).
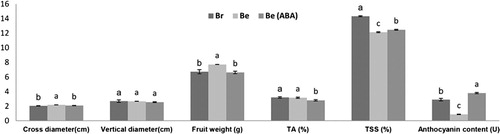
The Be suggested higher cross diameter and fruit weight than Be (ABA) and Br, but the vertical diameters were remained same for all samples. Be (ABA) obviously reduced the content of titratable acid (TA), while the Be and Br have the same TA content. Br shows the highest total soluble solids (TSS) while the Be treatment ranked second. The most difference among them was in anthocyanin content; Be (ABA) and Br turned in a significantly greater anthocyanin content than that in Be, and Be (ABA) had much more anthocyanin than Br ().
Figure 2. Physiological parameters of Br, Be and Be (ABA) three weeks post-ABA treatment (11 weeks post flowering). TA, titratable acid; TSS, total soluble solids. All the data were analyzed by SPSS, p < .05. Note: Due to the value of anthocyanin content was quite low, the data of anthocyanin content here were magnified 10 times.
A mass spectrometry and two stage mass spectrometry
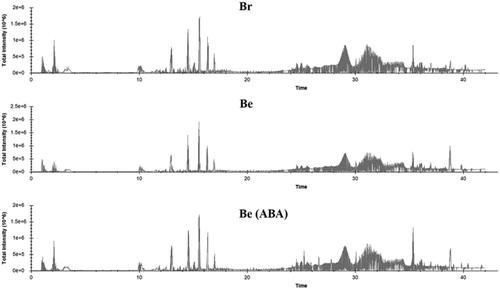
The total intensity of all substances in the berries peel of Br, Be and Be (ABA) three weeks post- ABA treatment (11 weeks post flowering) were measured. According to the chart of the total intensity, all three samples showed the same total intensity peaks and trends from 0 to 40 min. The detected substances showed very near similarities between Be and Be (ABA) from 25 to 40 min, which were generally higher in Br in this period. Be showed a lower average value at 2 min compared with the other two samples. Overall, the intensity peaks were higher in Br than in Be and Be (ABA) ().
Figure 3. The total intensity of all substances in the berries peel of Br, Be and Be (ABA) three weeks post-ABA treatment (11 weeks post flowering). This chart was made by MSconvertGUI software.
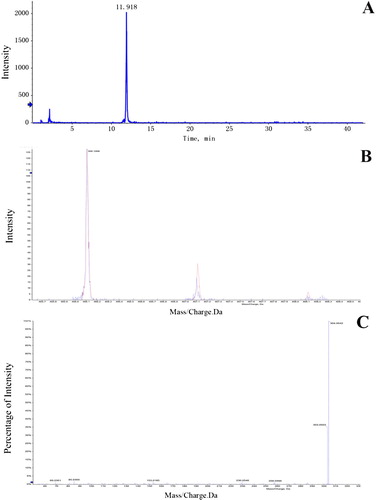
shows a mass spectrometry detected time peak intensity ((A)), a relative molecular weight peak intensity with it’s hydrogenation peak intensity ((B)), and a two stage mass spectrometry peak intensity ((C)). This chart gives an example which represents how the delphinidin-3-O-monoglucoside can be found, in the same manner as other types of anthocyanins.
Figure 4. The chart to show how delphinidin-3-O-monoglucoside was found. A: a mass spectrometry detected time peak intensity. B: relative molecular weight peak intensity and its hydrogenation peaks intensity. C: two stage mass spectrometry peak intensity.
The type of anthocyanins which were detected by TripleTOF 5600+AB
Five common anthocyanins in grapes – cyaniding, peonidin, malvidin, delphinidin and petunidin – were detected by TripleTOF 5600+AB. Ten types of anthocyanins which were cyanidin-3-O-monoglucoside, peonidin-3-O-monoglucoside, malvidin-3-O-monoglucoside, delphinidin-3-O-monoglucoside, peonidin-3-O-acetylglucoside, petunidin-3,5-O-diglucoside, malvidin-3-O-coumarylglucoside, malvidin-3-O-acetylglucoside, cyanidin-3,5-O-diglucoside and peonidin-3-O-coumarylglucoside were found by TripleTOF 5600+AB ( and ). The areas within the peaks show a very close positive relationship with the peak heights (R2 = 0.9982). The cyanidin-3-O-monoglucoside and peonidin-3-O-acetylglucoside were only found in Be (ABA), and peonidin-3-O-acetylglucoside had a much lower relative area. The malvidin-3-O-coumarylglucoside was only detected in Br which also has a much lower expression. The most obvious changes were in the peonidin-3-O-monoglucoside which Be (ABA) showed more than 40 and six times higher than that in Be and Br, respectively. Be (ABA) shows the highest total anthocyanin area with Br having the second highest level, and Be the third ().
Figure 5. The type of anthocyanins which were detected by Triple TOF 5600+ AB, the peak height shows similar trend with the area (R2=0.9982). Note: Cya-3-O-mon, cyanidin-3-O-monoglucoside; Peo-3-O-mon, peonidin-3-O-monoglucoside; Cya-3,5-O-dig, cyanidin-3,5-O-diglucoside; Peo-3-O-cou, peonidin-3-O-coumarylglucoside; Mal-3-O-mon, malvidin-3-O-monoglucoside; Del-3-O-mon, delphinidin-3-O-monoglucoside; Peo-3-O-ace, peonidin-3-O-acetylglucoside; Pet-3,5-O-dig, petunidin-3,5-O-diglucoside; Mal-3-O-cou, malvidin-3-O-coumarylglucoside; Mal-3-O-ace, malvidin-3-O-acetylglucoside.
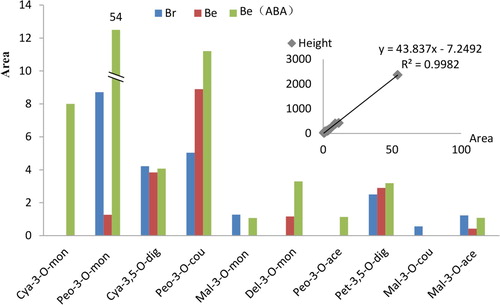
Table 1. The type of anthocyanins and areas which were detected by Triple TOF 5600+ AB
RT-qPCR of 18 coloring-related genes
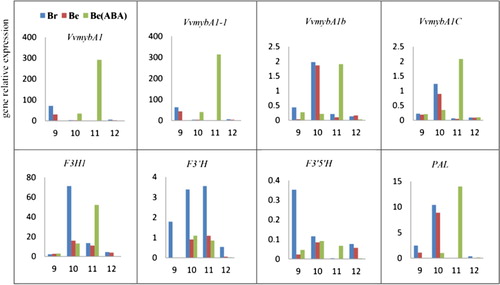
The RT-qPCR assay of eighteen genes which were related to the anthocyanin biosynthetic pathway was carried out from nine weeks post-flowering to 12 weeks post-flowering (one to four weeks post-ABA treatment). Overall, within the complete relative gene expression data for Br, Be and Be (ABA), different genes showed different top expression period, but most genes exhibited their highest expression at 11 weeks post-flowering on Be (ABA). Four sorts of the myb gene have different expression patterns; the VvmybA1 and VvmybA1 gene have much greater expression than VvmybA1b and VvmybA1C at eight and 11 weeks post-flowering. The VvmybA1 and VvmybA1-1 gene showed its highest expression at nine weeks post-flowering and more especially at 11 weeks post-flowering. Most genes in Br display higher expression than those in Be nearly at all times. The expression of the F3H1, ANS, CHI, LODX, 3GT, 5GT, OMT, PAL, DFR and 4CL genes ranked as the second highest expression group; other genes such as VvmybA1b, VvmybA1C, WD40, F3’H, F3’5’H and CHS display lower expressions (; Supplementary file 2).
Figure 6. RT-qPCR of anthocyanin biosynthetic pathway related genes. The Y-axis represents gene relative expression and the X-axis represents weeks post flowering.
Discussion
Mutation breeding acts as an important mechanism for new grape varieties to develop, such as several early-ripening mutations selected in the ‘Summer Black’ grape recently (Xu et al. Citation2016). The ‘Brasil’, ‘Benitaka’, ‘Ruby Okuyama’ and ‘Flame Muscat’ mutations were originally selected by Italia (Kobayashi et al. Citation2001; Leão et al. Citation2011). The color changes in grapes have been shown to be caused by natural changes in the DNA sequence of coloring-related genes (Kobayashi et al. Citation2004; Azuma et al. Citation2009; Xu et al. Citation2017). One artificial way isdeeper color in grapes by applying an appropriate percentage of ABA; the same is true for other un-climacteric respiratory fruits. About the cultivars of Br and Be, they were verified to show the same band on polyacrylamide gel with ‘Italia’ by more than 70 SSR markers which can be inferred that they are the bud mutation of ‘Italia’ (Xu et al. Citation2017). Also, the same shape of total intensity peaks of their peel in shows that Br, Be and Be (ABA) have very close material compositions.
ABA treatment in Be showed deeper color compared with Br and Be in our results (), and this result was replicated on other cultivars of grape or grape in vitro (Hiratsuka et al. Citation2001; Ferrara et al. Citation2015; Yamamoto et al. Citation2015). GA3 was confirmed to enlarge the size and the weight of berries (Han and Lee Citation2004; Xin et al. Citation2015), while ABA was verified in our experiment for reducing the weight of berries; this mechanism is probably due to the smaller cross diameter. Meanwhile, the average weight on Br displayed a lower value compared with Be. These results probably suggested that the weight (or size) of fruit has a negative relation to coloring. ABA treatment could also reduce the content of TA without obvious changes on TSS ().
The total anthocyanin area results in suggested that the Be (ABA) treatment increased the content of anthocyanin which resulted in the deepest color on the peel of berries, followed by Br and Be. Compared with HPLC methods on grape cultivars Clinton, Isabella (Flamini and Tomasi Citation2000) and ‘Houman’ (Zhang et al. Citation2016), our approach found fewer types of anthocyanins (ten types of anthocyanins). The percentage of anthocyanin types in different cultivars were not the same. ‘Clinton’ and ‘Isabella’ obtained more petunidin-3,5-O-diglucoside + delphinidin-3-O-monoglucoside, petunidin-3-O-monoglucoside and malvidin-3-O-monoglucoside (Flamini and Tomasi Citation2000), while the peonidin-3,5-O-diglucoside, malvidin-3-O-(6ʺ-O-coumaroyl)-glucoside, 5-O-glucoside and malvidin-3-O-(6ʺ-O-coumaroyl)-glucoside ranked higher in ‘Houman’ grapes. Our results suggest that the peonidin-3-O-monoglucoside, cyanidin-3,5-O-diglucoside and peonidin-3-O-coumarylglucoside anthocyanin types in Br were more abundant than in others. In Be, most abundant were cyanidin-3,5-O-diglucoside and peonidin-3-O-coumarylglucoside, petunidin-3,5-O-diglucoside, and in Be (ABA) most abundant were cyanidin-3-O-monoglucoside, peonidin-3-O-monoglucoside, peonidin-3-O-coumarylglucoside ( and ). Interestingly, the cyanidin-3-O-monoglucoside and peonidin-3-O-acetylglucoside were only found in measurable amounts in Be (ABA). Also, the cyanidins and peonidins displayed the highest the peak area square in Br and Be (ABA). In addition, malvidin-3-O-monoglucoside only appeared in Br and Be (ABA) with a lower peak area square. Moreover, malvidin-3-O-coumarylglucoside was only detected in Br and with a lower peak area square.
The gene relative expression results prove that the VvmybA1 and VvmybA1-1 genes were revealed to have the highest expression compared with other genes among these three samples. Both of these two genes expressed at ten weeks post-flowering (two weeks post treatment) and acquired the highest expression at 11 weeks post-flowering (three weeks post treatment). These two results demonstrate that the VvmybA1 and VvmybA1-1 genes play the most important role in anthocyanin biosynthesis. Coincidentally, the gene structure of VvmybA1 has been shown to be the main reason for coloring alterations in ‘Italia’, Be and Br (Kobayashi et al. Citation2004; Xu et al. Citation2017). In addition, by looking at the expression of these 18 genes, we found that most genes in the Be (ABA) treatment group revealed their highest expression at 11 weeks post-flowering, while the genes in Br indicated a higher expression from nine (veraison period) to 11 weeks post-flowering. These results suggest that the mechanism of coloring on berries were different among them which the Be (ABA) treatment was expressed later then Be and Br in natural condition. This hysteresis express the effects of ABA on VvmybA1 gene was consistent with Jeong’s results too (Jeong et al. Citation2004). Furthermore, the CHI, ANS, LODX and F3H1 gene also showed a higher level of gene expression from 11 to 12 weeks post-flowering among these three samples, followed by OMT, 3GT, 5GT and PAL gene. However, it is worth noting that the F3’5’H and WD40 gene expressed rather less.
According to the type of anthocyanins which were detected by TripleTOF 5600+AB and the results of RT-qPCR of coloring-related genes, a probable pathway chart on anthocyanin biosynthesis was built by combining with previous studies (Boss et al. Citation1996a; Jaakola Citation2013; Zhang et al. Citation2014) as follows ().
Figure 7. The probable anthocyanin biosynthesis mechanism of deeper coloring bud mutation in (Br) and Be (ABA) cultivars. The whole process takes place in natural conditions; the red pathway may demonstrate the effects of ABA. Del, delphinidin; Pet, petunidin; Mal, malvidin; Cya, cyanidin; Peo, peonidin.
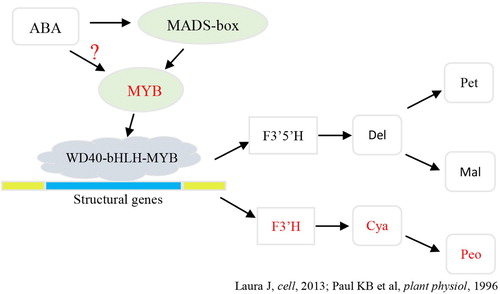
Firstly, from the distinguish on the anthocyanin types of Be and Br (), some kind of the malvidin, cyaniding and peonidin in Br were composited more than Be while some were composited less compared with Be. The total composited anthocyanin was higher in Br than that in Be. This natural control mechanism in Be and Br revealed the similarities in anthocyanin synthesis with the Houman and Cencibel grape (Gómez-Alonso et al. Citation2007; Zhang et al. Citation2016). Interestingly, the Be (ABA) treatment displays a distinct mechanism in which only cyaniding and peonidin show a huge increase. Combined with the gene expression of F3H1 which has a higher expression at 11 weeks post-flowering, we can infer that the ABA treatment on the berries probably improved the route of the F3H1-cyaniding-peonidin pathway. Secondly, the delayed expression of the VvmybA1 and VvmybA1-1 genes after treatment by ABA implied that compared with natural conditions, the plant growth regulator ABA was not effective on the myb gene directly, but indirectly by influencing the myb gene through the ABA to MADs-box to myb pathway.
Anthocyanin has potential health benefits in plant-derived anthocyanin-rich foods, which can help people with diabetes control, cardiovascular disease prevention, cancer control, obesity control and improvement of visual and brain functions (Wang and Stoner Citation2008; Tsuda Citation2012). Since different maturity periods can generate distinctly different types of anthocyanins, the study focuses on the types of anthocyanins that occur at different maturity times. This information will be helpful for selecting suitable harvest periods. Studying the mechanisms of coloring-related bud mutations and the evolution of grape berries can be beneficial for curing a range of human health issues.
Conclusions
The present study related to anthocyanin and gene expression comparison among the ‘Benitaka’, an ABA-treated ‘Benitaka’, and its deeper-colored bud mutation revealed the different coloring mechanisms in grapes. The results suggested that the VvmybA1 gene and transcription factor play an important role in the anthocyanin biosynthesis, and the differing expressions of the VvmybA1 and VvmybA1-1 gene in different time probably was the main reason on generated different kind of anthocyanins. Based on our results the possible mechanism of anthocyanins was established to elaborate the reason for the deeper coloring in ABA-treated ‘Benitaka’ and ‘Brasil’ grapes.
Supplemental Material
Download MS Excel (10.1 KB)Supplemental Material
Download TIFF Image (221 KB)Acknowledgements
JT and YX contributed to the design of the study, YX and HZ write this paper, YX, do the most of the experiment, QW analyses the TripleTOF 5600+AB data. LM sampled the berries and analyses the RT-qPCR results. MK corrected the language of this paper. And all authors contributed to the critical revision of the article. We are grateful to Anne Hoyt for proof reading of the manuscript.
Disclosure statement
No potential conflict of interest was reported by the authors.
Additional information
Funding
Related Research Data
Reference
- Andrews GL, Simons BL, Young JB, Hawkridge AM, Muddiman DC. 2011. Performance characteristics of a new hybrid quadrupole time-of-flight tandem mass spectrometer (TripleTOF 5600). Anal Chem. 83:5442–5446. doi: 10.1021/ac200812d
- Azuma A, Kobayashi S, Goto-Yamamoto N, Shiraishi M, Mitani N, Yakushiji H, Koshita Y. 2009. Color recovery in berries of grape (Vitis vinifera L.) ‘Benitaka’, a bud sport of ‘Italia’, is caused by a novel allele at the VvmybA1 locus. Plant Sci. 176:470–478. doi: 10.1016/j.plantsci.2008.12.015
- Boss PK, Davies C, Robinson SP. 1996a. Anthocyanin composition and anthocyanin pathway gene expression in grapevine sports differing in berry skin colour. Aust J Grape Wine R. 2:163–170. doi: 10.1111/j.1755-0238.1996.tb00104.x
- Boss PK, Davies C, Robinson SP. 1996b. Analysis of the expression of anthocyanin pathway genes in developing Vitis vinifera L. cv Shiraz grape berries and the implications for pathway regulation. Plant Phy. 111:1059–1066. doi: 10.1104/pp.111.4.1059
- Carreno J, Faraj S, Martinez A. 1998. Effects of girdling and covering mesh on ripening, color and fruit characteristics of ‘Italia’ grapes. J Horticul Sci Biotechnol. 73:103–106. doi: 10.1080/14620316.1998.11510951
- Cho MJ, Howard LR, Prior RL, Clark JR. 2004. Flavonoid glycosides and antioxidant capacity of various blackberry, blueberry and red grape genotypes determined by high-performance liquid chromatography/mass spectrometry. J Sci Food Agr. 84:1771–1782. doi: 10.1002/jsfa.1885
- Ferrara G, Mazzeo A, Matarrese AMS, Pacucci C, Punzi R, Faccia M, Gambacorta G. 2015. Application of abscisic acid (S-ABA) and sucrose to improve colour, anthocyanin content and antioxidant activity of cv. Crimson Seedless grape berries. Aust J Grape Wine R. 21:18–29. doi: 10.1111/ajgw.12112
- Flamini R, Tomasi D. 2000. The anthocyanin content in berries of the hybrid grape cultivars Clinton and Isabella. Vitis-Geilweilerhof. 39:79–82.
- Fraige K, Pereira-Filho ER, Carrilho E. 2014. Fingerprinting of anthocyanins from grapes produced in ‘Brasil’ using HPLC–DAD–MS and exploratory analysis by principal component analysis. Food Chem. 145:395–403. doi: 10.1016/j.foodchem.2013.08.066
- Gagné S, Cluzet S, Mérillon JM, Gény L. 2011. ABA initiates anthocyanin production in grape cell cultures. J Plant Growth Regul. 30:1–10. doi: 10.1007/s00344-010-9165-9
- Gómez-Alonso S, García-Romero E, Hermosín-Gutiérrez I. 2007. HPLC analysis of diverse grape and wine phenolics using direct injection and multidetection by DAD and fluorescence. J Food Compos Anal. 20:618–626. doi: 10.1016/j.jfca.2007.03.002
- Han DH, Lee CH. 2004. Effects of GA3, CPPU and ABA applications on the quality of kyoho (Vitis vinifera L. x Labrusca L.) grape. Acta Hortic. 653:193–197. doi: 10.17660/ActaHortic.2004.653.27
- He F, Mu L, Yan GL, Liang NN, Pan QH, Wang J, Duan CQ. 2010. Biosynthesis of anthocyanins and their regulation in colored grapes. Molecules. 15:9057–9091. doi: 10.3390/molecules15129057
- Hiratsuka S, Onodera H, Kawai Y, Kubo T, Itoh H, Wada R. 2001. ABA and sugar effects on anthocyanin formation in grape berry cultured in vitro. Sci Hortic. 90:121–130. doi: 10.1016/S0304-4238(00)00264-8
- Huang Z, Wang B, Williams P, Pace RD. 2009. Identification of anthocyanins in muscadine grapes with HPLC-ESI-MS. LWT Food Sci Technol. 42:819–824. doi: 10.1016/j.lwt.2008.11.005
- Jaakola L. 2013. New insights into the regulation of anthocyanin biosynthesis in fruits. Trends Plant Sci. 18:477–483. doi: 10.1016/j.tplants.2013.06.003
- Jeong ST, Goto-Yamamoto N, Kobayashi S, Esaka M. 2004. Effects of plant hormones and shading on the accumulation of anthocyanins and the expression of anthocyanin biosynthetic genes in grape berry skins. Plant Sci. 167:247–252. doi: 10.1016/j.plantsci.2004.03.021
- Kobayashi S, Goto-Yamamoto N, Hirochika H. 2004. Retrotransposon-induced mutations in grape skin color. Science. 304:982–982. doi: 10.1126/science.1095011
- Kobayashi S, Ishimaru M, Ding CK, Yakushiji H, Goto N. 2001. Comparison of UDP-glucose: flavonoid 3-O-glucosyltransferase (UFGT) gene sequences between white grapes (Vitis vinifera) and their sports with red skin. Plant Sci. 160:543–550. doi: 10.1016/S0168-9452(00)00425-8
- Koyama R, de Assis AM, Yamamoto LY, Borges WF, de Sá Borges R, Prudêncio SH, Roberto SR. 2014. Exogenous abscisic acid increases the anthocyanin concentration of berry and juice from ‘Isabel’grapes (Vitis labrusca L.). HortScience. 49(4):460–464. doi: 10.21273/HORTSCI.49.4.460
- Leão PCDS, Cruz CD, Motoike SY. 2011. Genetic diversity of table grape based on morphoagronomic traits. Sci Agr. 68:42–49. doi: 10.1590/S0103-90162011000100007
- Livak KJ, Schmittgen TD. 2001. Analysis of relative gene expression data using real-time quantitative PCR and the 2−ΔΔCT method. Methods. 25:402–408. doi: 10.1006/meth.2001.1262
- Mes PJ. 2004. Breeding tomatoes for improved antioxidant activity [PhD thesis]. Oregon State University.
- Miao L, Zhang Y, Yang X, Xiao J, Zhang H, Zhang Z, Jiang G. 2016. Colored light-quality selective plastic films affect anthocyanin content, enzyme activities, and the expression of flavonoid genes in strawberry (Fragaria× ananassa) fruit. Food Chem. 207:93–100. doi: 10.1016/j.foodchem.2016.02.077
- Mol J, Stuitje A, Gerats A, van der Krol A, Jorgensen R. 1989. Saying it with genes: molecular flower breeding. Trends Biotechnol. 7:148–153. doi: 10.1016/0167-7799(89)90025-5
- Mori K, Saito H, Goto-Yamamoto N, Kitayama M, Kobayashi S, Sugaya S, Hashizume K. 2005. Effects of abscisic acid treatment and night temperatures on anthocyanin composition in Pinot noir grapes. VITIS-GEILWEILERHOF. 44:161.
- Negro C, Tommasi L, Miceli A. 2003. Phenolic compounds and antioxidant activity from red grape marc extracts. Bioresource Technol. 87:41–44. doi: 10.1016/S0960-8524(02)00202-X
- Peppi MC, Fidelibus MW, Dokoozlian N. 2006. Abscisic acid application timing and concentration affect firmness, pigmentation, and color of flame seedless’ grapes. HortScience. 41:1440–1445. doi: 10.21273/HORTSCI.41.6.1440
- Ramsay NA, Glover BJ. 2005. MYB–bHLH–WD40 protein complex and the evolution of cellular diversity. Trends Plant Sci. 10:63–70. doi: 10.1016/j.tplants.2004.12.011
- Ribéreau-Gayon J, Ribéreau-Gayon P. 1958. The anthocyans and leucoanthocyans of grapes and wines. Am J Enol Viticult. 9:1–9.
- Roberto SR, Assis AMD, Yamamoto LY, Miotto LCV, Koyama R, Sato AJ, Borges RDS. 2013. Ethephon use and application timing of abscisic acid for improving color of ‘Rubi’ table grape. Pesquisa Agropecu Bras. 48(7):797–800. doi: 10.1590/S0100-204X2013000700013
- Roberto SR, de Assis AM, Yamamoto LY, Miotto LCV, Sato AJ, Koyama R, Genta W. 2012. Application timing and concentration of abscisic acid improve color of ‘Benitaka’ table grape. Sci Hort. 142:44–48. doi: 10.1016/j.scienta.2012.04.028
- Roggero JP, Coen S, Ragonnet B. 1986. High performance liquid chromatography survey on changes in pigment content in ripening grapes of Syrah. An approach to anthocyanin metabolism. Am J Enol Viticult. 37:77–83.
- Seo M, Koshiba T. 2002. Complex regulation of ABA biosynthesis in plants. Trends Plant Sci. 7:41–48. doi: 10.1016/S1360-1385(01)02187-2
- Tsuda T. 2012. Dietary anthocyanin-rich plants: biochemical basis and recent progress in health benefits studies. Mol Nutr Food Res. 56:159–170. doi: 10.1002/mnfr.201100526
- Tulio AZ, Reese RN, Wyzgoski FJ, Rinaldi PL, Fu R, Scheerens JC, Miller AR. 2008. Cyanidin 3-rutinoside and cyanidin 3-xylosylrutinoside as primary phenolic antioxidants in black raspberry. J Agr Food Chem. 56:1880–1888. doi: 10.1021/jf072313k
- Wang LS, Stoner GD. 2008. Anthocyanins and their role in cancer prevention. Cancer Lett. 269:281–290. doi: 10.1016/j.canlet.2008.05.020
- Xin SP, Liu S, Yu Y, Nie SQ, Gao ZH, Tao JM. 2015. Effects of GA, and CPPU on grape fruit adjacent leaf photosynthesis and fruit quality. Ying Yong Sheng tai xue bao = J Appl Ecol. 26:1814–1820. Chinese.
- Xu Y, Gao Z, Tao J, Jiang W, Zhang S, Wang Q, Qu S. 2016. Genome-wide detection of SNP and SV variations to reveal early ripening-related genes in grape. PLoS One. 11:e0147749. doi: 10.1371/journal.pone.0147749
- Xu Y, Jiang N, Zhang Y, Wang M, Ren J, Tao J. 2017. A SNP in the promoter region of theVvmybA1 gene is responsible for differences in grape berry color between two related bud sports of grape. Plant Growth Regul. 82:457–465. doi: 10.1007/s10725-017-0272-5
- Yakushiji H, Kobayashi S, Goto-Yamamoto N, Jeong ST, Sueta T, Mitani N, Azuma A. 2006. A skin color mutation of grapevine, from black-skinned Pinot Noir to white-skinned Pinot Blanc, is caused by deletion of the functional VvmybA1 allele. Biosci Biotech Bioch. 70(6):1506–1508. doi: 10.1271/bbb.50647
- Yamamoto LY, de Assis AM, Roberto SR, Bovolenta YR, Nixdorf SL, García-Romero E, Hermosín-Gutiérrez I. 2015. Application of abscisic acid (S-ABA) to cv. Isabel grapes (Vitis vinifera× Vitis labrusca) for color improvement: effects on color, phenolic composition and antioxidant capacity of their grape juice. Food Res Int. 77:572–583. doi: 10.1016/j.foodres.2015.10.019
- Zhang Y, Butelli E, Martin C. 2014. Engineering anthocyanin biosynthesis in plants. Curr Opin Plant Biol. 19:81–90. doi: 10.1016/j.pbi.2014.05.011
- Zhang L, Xu YS, Jia Y, Wang JY, Yuan Y, Yu Y, Tao JM. 2016. Effect of floral cluster pruning on anthocyanin levels and anthocyanain-related gene expression in ‘Houman’ grape. Hortic Res. 3:16037. doi: 10.1038/hortres.2016.37