
ABSTRACT
Drought invokes a variety of metabolic alterations in plant leaves to cope with stress situations. To understand the effects of CO2 and drought stress for leaf metabolic changes in potato [Solanum tuberosum (L)], two contrasting potato cultivars Harley Blackwell (HB, an early maturing, newer cultivar) and Snowden (SD, an established, full-season cultivar) were tested under water-limited conditions and CO2 enrichment. The results revealed that most of the drought-triggered metabolites were lower in HB compared to SD. However, HB showed quicker adjustments in the metabolic processes such as conversion of starch into soluble sugars and biosynthesis of phenylalanine and other compatible solutes at the early stages of the drought progression. Moreover, the existence of genotypic differences for leaf water potential (LWP) in response to CO2 enrichment was evident. Our study provides insights into the possible metabolic strategies of drought tolerance in potato cultivars under ambient and elevated CO2.
Introduction
Climate trends over the past several decades suggest that frequent and intensified drought episodes, as well as increased atmospheric CO2 level are likely (USGCRP Citation2009). Potato, one of the most important staple food crops, is drought sensitive compared to other crops as it is shallow and sparsely rooted (Iwama and Yamaguchi, Citation2006) and its sustainable yield is threatened by soil moisture deficits (Karafyllidis et al. Citation1996; Deblonde and Ledent Citation2001). Also, substantial yield reduction was found when drought stress was subjected during the tuber bulking period compared to applying water deficits during the other growth stages (Vanloon Citation1981). Major U.S. crops have a large potential for improving yield through genetic manipulation; genotypic selection is an important approach for improving crop production in unfavorable environments (Boyer Citation1982). Progress in sustainable production in potato quality and quantity largely relies on the identification of superior genotypes that are better adapted to drought stress.
Internal heat necrosis (IHN) is a physiological disorder that generates an undesirable browning of tuber tissue. This symptom has been found in potato cultivars in the Eastern United States (Yencho et al. Citation2008) and it causes significant economic loss to growers (Stevenson et al. Citation2001; Yencho et al. Citation2008). One of the possible causes of IHN in tubers is inadequate soil moisture (Yencho et al. Citation2008). Harley Blackwell is a newer potato cultivar that is adapted to the U.S. Eastern Seaboard with improved yield characteristics for the potato chipping industry. This potato cultivar has increased resistance to IHN, which enhances its value to the chipping industry (Hutchinson et al. Citation2006).
Upon stress, plants evolve complex physiological, molecular and biochemical responses for adapting to the environment. Exposure to water stress results in stomatal closure, induction of Reactive Oxygen Species (ROS) scavenging systems, metabolic changes and altered photosynthetic rates (Bray Citation1997; Obidiegwu et al. Citation2015). The accumulation of compatible solutes, such as Proline (Pro) and soluble sugars (eg. mannitol, trehalose, etc) is a basic survival strategy of plants exposed to water stress (Sharp & Ober Citation1992; Krasensky & Jonak Citation2012). In potato, drought-triggered accumulation of these osmotically active metabolites, i.e. proline, inositol, raffinose, galactinol, and trehalose, was also reported (Schafleitner et al., Citation2007; Vasquez-Robinet et al., Citation2008; Evers et al., Citation2010; Legay et al., Citation2011; Kondrak et al., Citation2012). The overexpression of genes involved in Pro and trehalose biosynthesis also enhanced drought tolerance in several crops (Garg et al. Citation2002; de Ronde et al. Citation2004; Cortina & Culianez-Macia Citation2005; Jun et al. Citation2005). Sugars including raffinose are also important in controlling ROS production during drought stress (Pelleschi et al. Citation1997). These reports suggest that metabolic adjustments are a key factor in stress avoidance in plants. In addition, the degree of metabolic changes in plant tissues varies with the duration and intensity of drought exposure across CO2 levels. For instance, drought-triggered total metabolites varied across CO2 levels under different drought cycle treatment in both the potato leaflets and tubers (Barnaby et al. Citation2015; Yang et al. Citation2015).
Examining genotypic differences in metabolite responses to abiotic stress can be an important tool to identify the metabolic signatures to be used for cultivar selection for drought tolerance (Roessner et al. Citation2001; Vasquez-Robinet et al. Citation2008; Barnaby et al. Citation2013). The carbohydrates derived from photosynthesis are the primary sources of carbon skeleton and energy for the biosynthesis of various leaf metabolites. Since, drought and elevated CO2 exhibit strong but opposite impacts on plant photosynthesis and carbon gain, an alteration in the leaf metabolic profile is likely to occur. Therefore, it is imperative to understand how the new potato cultivar with the reduced IHN modifies primary metabolism to meet the demands of diverse biochemical pathways in response to drought under ambient and elevated CO2. The objective of this study was to compare the effects of CO2 enrichment and drought on foliar metabolite concentrations in two contrasting and commercially grown U.S. Eastern Seaboard potato cultivars [Solanum tuberosum L.] Snowden (SD, an established, full-season cultivar) and Harley Blackwell (HB, an early maturing, newer cultivar).
Materials and methods
Plant materials and leaf water potential measurement
Experiments 1 and 2 were conducted at U.S. Department of Agriculture - Agricultural Research Service (USDA-ARS) facilities in Beltsville, Maryland, on separate dates in the same growing season using 8 Soil-Plant Atmosphere Research (SPAR) chambers with natural lighting. Experiment 1 ran from May 3 to July 18, and experiment 2 from July 13 to October 1, 2012. SPAR chambers, composed of transparent Plexiglas® (Evonik Industries, Essen, Germany) walls and ceilings, were located outdoors and enclosed an air volume of 3.4 kL and had a horizontal production area of 1 m2 each. Air temperature, chamber air CO2 levels, irrigation, nutrient supply and humidity were carefully controlled for each chamber. An array of sensors automatically monitored air, canopy and soil temperatures, as well as, relative humidity, CO2 fluxes and photosynthetically active radiation (PAR). Each chamber was equipped with an infrared gas analyzer (LI-6262; LI-COR Biosciences, Lincoln, NE) to measure CO2 and the desired set point was maintained using mass flow controllers (Omega Engineering Inc., Stanford, CT) and research grade CO2 was provided from a compressed gas cylinder (Air Products, Tamaqua, PA). Additional chamber design and operational details were as described previously (Tingey et al. Citation1996; Reddy et al. Citation2001; Fleisher et al. Citation2009).
In each chamber, four 16 L pots were placed, and a 3:1 volume ratio of washed construction sand and vermiculite (Grace Construction Products, Cambridge, MA) were filled in each pot. Sprouted seed tubers from Solanum tuberosum var. Harley Blackwell and Snowden (averaging 50 g fresh weight) were planted at 10 cm depths, with one cultivar per pot. Complete mineral nutrient solution was supplied via an automated, pressure-compensated micro-fertigation system as described previously (Robinson Citation1984). After 100% emergence (at 16 days after planting in experiment 1, and 21 days in experiment 2), pots were watered twice a day using this fertigation solution and the amount of water delivered to each pot was calculated based on soil volumetric water content as described previously (Fleisher et al. Citation2009, Citation2013, Citation2014). Since fertilizer delivery was integrated with the irrigation system, a slow release fertilizer (Osmocote, 14-14-14; Scotts Company LLC, Marysville, OH) was also supplied during planting at a rate of 1.5 g per pot (equivalent to 100 kg N ha-1) to minimize potential differences in fertilizer availability across treatment groups when inducing drought responses.
The SPAR chambers were set to maintain either ambient (aCO2, 400 ppm) or elevated (eCO2, 800 ppm) air CO2 concentration. A 16/8-h thermal period was maintained with 22/17 ± 0.3°C day/night temperatures. Average 24-h relative humidity ranged between 65 and 75%. Water was withheld for 9 days from all plants in one SPAR chamber from each CO2 treatment beginning approximately 30-day post emergence (during tuber formation stage). Treatment combinations included well-watered + aCO2 (400 ppm), well-watered + eCO2 (800 ppm), dehydrated + aCO2 (400 ppm), and dehydrated + eCO2 condition (800 ppm)). The experimental design and conditions in Experiments 1 and 2 were same except the experimental time and random position of the pots and chambers.
The leaf water status was monitored by measuring leaf water potential (LWP) with a model HR-33 T dewpoint microvolt meter after a 40-min incubation period (Wescor, Logan, UT). The LWP in the recently fully expanded leaves was measured between 11:00-13:00 h from four plants in each treatment. Measurements of LWP were performed every 3rd d during drought treatment. At day 9, SD reached severe water stress level (below −2.0 Mpa) and showed leaves wilted, curled, turned brown, at which time the experiment was terminated.
Metabolite measurements
Leaf disc samples were collected from the recently fully expanded leaflets near the top of the canopy. Samples were taken at 13:00 h from four plants each treatment. The sampled leaf discs were quickly transferred to small envelopes, placed in liquid N2 to quench metabolism, and freeze-dried for 3 days. The samples were stored at −20°C for up to 1 month prior to analysis.
Leaf tissue (approximately 30 mg DW) was pulverized using a TissueLyser II bead mill (Qiagen, Valencia, CA). The pulverized tissue was extracted twice with 1.4 ml of 70% aqueous methanol. A mixture of internal standards containing 62.5 nmol of α-aminobutyric acid and 26 μmol of ribitol in a total volume of 45 μl was injected into each sample during the first extraction. The first extraction was heated to 45°C for 15 min in a water bath. The extracts were combined in a 15-ml Falcon tube and stored at −80°C for up to 2 weeks. Aliquots of each extract were derivatized for chromatography as described previously (Sicher Citation2008). Standard curves were prepared with four point curves using known mixtures of soluble sugars, organic acids and amino acids. Stress related foliar metabolites were determined by gas chromatography coupled to mass spectrometry as described previously (Sicher and Barnaby Citation2012; Barnaby et al. Citation2013; Barnaby et al. Citation2015a).
Statistical and hierarchical clustering analysis
Light intensity and length of day/night (Experiment 1 vs 2) affected the levels of metabolites. The levels of metabolites from Experiment 1 (May to July) was consistently 1.5-1.8 fold higher than those from the Experiment 2 (Jul-Oct). However, the whole pattern of drought-triggered accumulation of metabolites was similar (data not shown). We therefore pooled the data from two experiments. To determine the significant effects of the treatments, analysis of variance (ANOVA) was performed using Stat view software. (StatView 5.0, Mountain View, CA). Hierarchical Clustering Analysis (HCA) was performed to compare patterns of metabolic changes between the two potato cultivars under aCO2 and eCO2 conditions. Clustering analysis was performed with data from days 0, 3, 6 and 9 of each drought treatment. First, leaf metabolite ratios were obtained by dividing metabolite concentrations from drought-treated samples by corresponding values from the well-watered control treatment. The resultant ratios were averaged across the four replications and used to generate slopes, which were then employed for calculating P-values for hierarchical clustering (Pvclust) analysis. One-way hierarchical clustering was used to identify relationships among various water stress responsive metabolites and to quantify the interacting effects of CO2 enrichment in the two different potato cultivars. Metabolite data were clustered using Pearson correlation to generate distance matrices. Hierarchical clusters were constructed as described by (Suzuki and Shimodaira Citation2006). Data were processed using a statistical program (InfoStat, Universidad Nacioal de Córdoba, Argentina) as described previously (Barnaby et al. Citation2013).
Results
Responses of LWP to water stress and CO2 enrichment
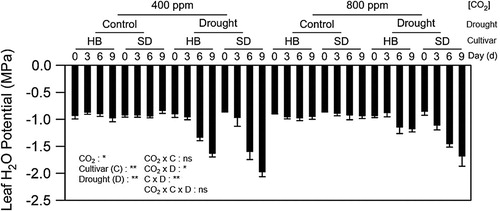
The mean LWP just before the initiation of the drought treatment was −0.9 ± 0.02 MPa in both cultivars averaged across CO2 treatments (). Thus, neither CO2 enrichment nor genotype altered LWP of well-watered plants (P > 0.05). Following 9 d of drought treatment, LWP of HB decreased to-1.6 ± 0.1 and −1.2 ± 0.1 MPa and for SD −2.0 ± 0.1 and −1.7 ± 0.2 MPa under aCO2 and eCO2 treatments, respectively. LWP also showed a CO2 × Drought and Cultivar × Drought interactions ().
Figure 1. Effects of CO2 enrichment, genotype, and water stress on changes of potato LWP. Changes of leaf water potential (LWP) in two potato cultivars, Harley Blackwell (HB) and Snowden (SD), when plants were subjected to progressive drought at 0, 3, 6 and 9 days (d) after water was withheld at ambient (400 ppm) and elevated (800) CO2 levels. Control: well-watered condition; Drought: water deficit condition. Error bars represent SEM (n = 6). The ANOVA for the treatments and duration of drought (days) are also given as *; P < 0.05; **; P < 0.01.
Genotypic differences in the responses of potato leaflet metabolites to the duration of drought treatment and to CO2 enrichment
The main effect of drought on all of the leaf metabolites was significant (P < 0.05) (). Nineteen out of the 30 metabolites also exhibited three-way (CO2 × Cultivar × Drought) interactions. The most abundant non-structural carbohydrates that responded to drought in both potato cultivars were fructose, glucose, raffinose, myo-inositol, pinitol, sucrose, and starch ( and ). Fructose, glucose, and myo-inositol increased relative to the well-watered controls following 3 and 6 d of water stress treatment but little or no accumulation was observed at 9 d of drought treatment. Conversely, raffinose and pinitol increased commensurate with water stress and maximal tissue concentrations were observed on the final day of drought treatment. The drought dependent accumulation of the above mentioned soluble carbohydrates differed among CO2 treatments (P ≤ 0.01) and maximal leaflet concentrations were 2- to 4-fold greater in the eCO2 compared to aCO2 treatment. Leaflet starch levels decreased in response to drought treatment but this was unaffected by CO2 enrichment. Note that starch mobilization was 2–3 fold greater in leaflets of SD compared to HB when measured 6 d after drought treatments were initiated. Significant genotype effects were also observed for fructose, glucose, myo-inositol, and sucrose with greater concentrations in SD compared to HB. However, the accumulation of raffinose in response to water stress was greater in the HB than SD.
Figure 2. Diagram of foliar metabolic changes due to water stress and CO2 enrichment in Harley Blackwell. The x-axis shows days of drought treatment. The y-axis shows leaf metabolite concentrations. The open and closed circle represents well-watered (C) and drought (D) condition. The grey and black color represents ambient (400 ppm) and elevated (800 ppm) CO2 levels. Error bars represent SEM (n = 8). Abbreviations are for carbohydrates, CB (Suc, sucrose; Raff, raffinose; Mal, maltose; Pin, pinitol; Rib, ribose; Fru, fructose; Glc, glucose; myo-ino, myo-inositol; Stch, leaf starch), amino acids, AA (Gly, glycine; Ser, serine; Leu, leucine; Phe, phenylalanine; Val, valine; Ala, alanine; Asp, aspartate; Ile, isoleucine; Pro, proline; Phe, phenylalanine), and organic acids, OA (Mala, malate; Fum, fumarate; Succ, succinate; Cit, citrate; cis-acon, cis-aconitate; Oxo, 2-oxoglutaric acid; Quin, quinate; Malo, malonate; Male, maleate; Glyc, glycerate; Shik, Shikimate). Put, Putrescine
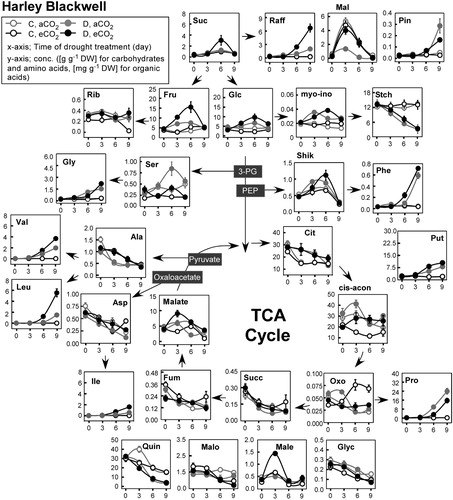
Figure 3. Diagram of foliar metabolic changes due to water stress and CO2 enrichment in Snowden. Other details are as in .
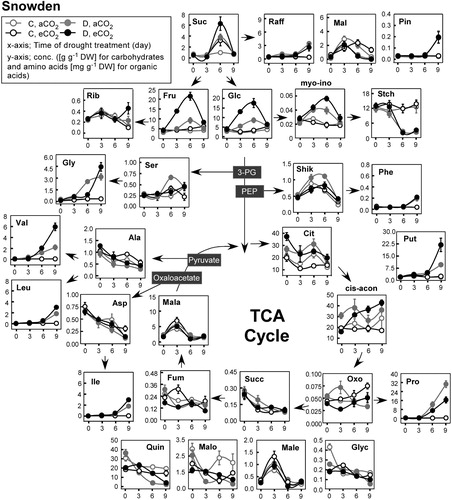
Table 1. Analysis of variance (ANOVA) results for leaf water potential and metabolites. Treatment effects of CO2, drought (D), and cultivar (C) and their interactions on the leaf water potential and responses of leaf metabolites.
Among 11 organic acids, shikimate, malate, and cis-aconitate increased in response to drought treatment as compared to well-watered plants in both cultivars. Citrate, fumarate, glycerate, succinate, and quinate decreased throughout the drought treatment. However, fumarate and quinate decreased in response to drought but citrate decreased in the well-watered plants in both cultivars. Succinate slightly decreased in the well-watered SD plants while it decreased in the dehydrated HB plants. This pattern was opposite for glycerate.
Among the 10 major amino acids measured, valine (Val), isoleucine (Ile), leucine (Leu), proline (Pro), phenylalanine (Phe), putrescine (Put), glycine (Gly), and serine (Ser) increased and aspartic acid (Asp) and alanine (Ala) decreased in response to drought treatment. Interestingly, the drought-induced accumulation of branched-chain amino acids (Val, Ile, and Leu) was similar or greater in SD compared to HB when plants were grown in the aCO2 treatment. However, under the eCO2 treatment, Val and Ile were greater in SD while Leu was greater in HB. Similarly, the accumulation of Gly is somewhat higher after 6 days of drought under aCO2 in both HB and SD, although the values for eCO2 are greater after 9 days.
The opposite occurred when both genotypes were grown in the eCO2 treatment. The accumulation of Phe, and Put in both potato cultivars due to drought was greater in the eCO2 compared to the aCO2 treatment. Furthermore, genotype specificity was evident in that the drought-triggered accumulation of Phe exhibited 3–4 fold greater increase in HB than in SD regardless of CO2 treatment while that of Put was 3 fold higher in SD under the eCO2 condition. Meanwhile, the accumulation of Pro was greater when plants were grown in the aCO2 treatment in both cultivars..
Hierarchical clustering analysis of cultivars differences for metabolite response to the treatments
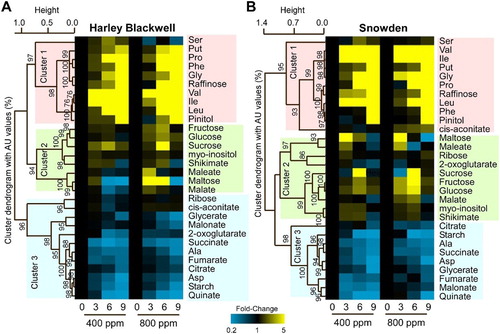
One-way hierarchical clustering (HCL) was used to identify relationships among stress responsive and non-responsive metabolites in the two potato cultivars, HB and SD (). Metabolite data from the two genotypes were clustered separately using a Pearson correlation to generate distance matrices and to assemble the metabolite clusters (labeled as Cluster 1, 2 and 3) in response to water stress (labeled as 0, 3, 6 and 9) and CO2 (400 and 800 ppm) treatments and the results were expressed per the treatments. Three main metabolite clusters were identified in water-stressed potato leaves. Cluster 1 and 3 contained metabolites that increased and decreased in response to drought, respectively, and Cluster 2 contained metabolites that transiently increased during drought progression. Except for cis-aconitate, the same metabolites from both genotypes were observed in cluster 1. The degree of change for cis-aconitate is also relatively low for each cultivar – reducing the significance of this metabolite falling into different clusters for each cultivar. Also, metabolites that accumulated in a transient manner (Cluster 2) were less numerous in potato cultivar HB than SD, i.e. 8 versus 10 metabolites. However, there were fewer total metabolites that decreased (Cluster 3) in SD (9) than in HB (12). There were 18 and 21 out of 30 total metabolites that accumulated, either permanently or transiently in response to drought treatment, in HB and SD, respectively (). The largest qualitative and quantitative metabolite differences among genotypes were in cluster 2.
Figure 4. One-way Hierarchical clustering analysis of metabolites in two potato cultivars, Harley Blackwell (HB) and Snowden (SD) across drought and CO2 treatments. Heatmap with hierarchical clustering analysis showing either the increase (shown in yellow) or decrease (shown in blue) of leaf metabolites in response to time of drought treatment (0, 3, 6, and 9 days), and CO2 treatments (ambient, 400 ppm vs. elevated, 800 ppm) in the HB (A) and SD (B). Values are given as ratios obtained from drought and well-watered (control) treatments and are shown in gradations from 0.2–5× (see scale bar). Ratios that were unchanged are shown in black. AU represent approximately unbiased P-values (0–100%, the higher the number the more significant).
Discussion
Leaf water potential and metabolic response of potato cultivars to water deficit
In general, both potato cultivars (HB and SD) responded to water deficit by consistently decreasing leaf water potential and starch concentration while increasing several plant metabolites including those which act as compatible solutes. The water deficit treatment affected the leaf metabolic profile to a greater extent than the CO2 treatments across cultivars. However, the plants grown under eCO2 had greater (less negative) LWP under water deficit conditions in both cultivars. The eCO2 improves plant water use efficiency and tissue water status by reducing the transpiration due to partial stomatal closure and increased photosynthesis, especially in the C3 species, such as potato (Ziska and Bunce Citation2007; Sicher and Barnaby Citation2012).
The current study revealed that the potato cultivar HB experienced less water stress than SD as deduced from the lesser (more negative) LWP under water deficit conditions in SD across CO2 regimes. The greater tolerance capacity of HB to water deficit was attributed to a relatively greater accumulation of compatible solutes especially low molecular weight carbohydrates (e.g. sucrose, fructose, glucose, and myo-inositol) than in SD. Plants adjust to environmental stress by modifying metabolism and by accumulating compounds that serve as compatible solutes to stabilize and protect cellular proteins and membranes. Compatible solutes are normally small organic molecules such as soluble sugars and amino acids (Bohnert and Jensen Citation1996). In this study, raffinose was accumulated under the eCO2 level in HB (2x greater) compared to SB, leading to greater tolerance to water stress in HB. Improved abiotic stress resistance has been observed when various compatible solutes were over-expressed in genetically transformed plants (Tarczynski et al. Citation1993; Hayashi and Murata Citation1998; Bajaj et al. Citation1999; Holmstrom et al. Citation2000; Bhaskara et al. Citation2015). Metabolites can also function as osmolytes that increase the intracellular osmotic potential and prevent water loss without disturbing normal cellular functions (Yancey et al. Citation1982). In general, foliar starch is mobilized during water stress and used for the biosynthesis of low molecular weight soluble carbohydrates and other metabolites including amino acids (Vyas et al. Citation1985; Pelleschi et al. Citation1997; Vu et al. Citation1998). In fact, we also found a large reduction in the leaf starch concentration as water stress progressed in severity across CO2 in both cultivars. However, the starch depletion in HB began earlier (6 days after drought initiation) and the rate of depletion was gradual while the depletion in SD was essentially competed at 6 days of drought. This implied that HB was relatively quicker in response to water deficit to protect cellular organelles by accumulating compatible solutes to adjust the leaf osmotic potential.
Seven out of ten amino acids were consistently enhanced under water deficit, especially from the 6 d after withholding irrigation. Prominent among them were, Gly, Phe, branched-chain amino acids Val, Ile, and Leu, and stress responsive amino acids Pro and Put. Enhanced Gly levels may be associated with the accumulation of glycine betaine, which stabilizes cellular proteins and membranes during environmental stress situations (Gorham Citation1995; Sakamoto and Murata Citation2002). Phe level was 3x greater in HB compared to SD throughout the drought treatment. Phe serves as a precursor for the biosynthesis of lignin and other cell wall related compounds (Bhardwaj et al. Citation2013). Lignin is deposited predominantly in the secondarily thickened cell walls, making the cell wall rigid and resistant to abiotic and biotic stresses (Vanholme et al. Citation2010). The drought dependent accumulation of branched-chain amino acids (i.e. Val, Ile, Leu), did not differ among genotypes and has been reported to accumulate in several crops including, maize, soybean, and potato in response to drought and high temperature (Bowne et al. Citation2012; Sicher & Barnaby Citation2012; Barnaby et al. Citation2013; Barnaby et al. Citation2015; Yang et al. Citation2015). An accumulation of Pro and Put under drought signified their role in the osmotic adjustment and desiccation avoidance under stress situations (Bouchereau et al. Citation1999).
Hierarchical clustering analyses of leaf metabolites across cultivars, CO2 and drought
Hierarchical clustering analysis showed that the accumulation of the metabolites in response to water stress, CO2 enrichment, and/or genotypes was qualitatively and quantitatively different. In other words, some metabolites were gradually induced, transiently induced, or gradually reduced during the progression of drought from 0 to 9 d after withholding irrigation, and these drought-triggered responses varied between two cultivars. The majority of the amino acids were induced and soluble carbohydrates showed a transient increase, whereas organic acids were largely reduced. A reduced carbohydrate supply due to depressed photosynthesis under drought stress often results in less biosynthesis of carbon compounds relative to the nitrogenous compounds such as amino acids (Sale & Campbell Citation1986; Rotundo et al. Citation2009). In fact, the starch and organic compounds, which are mostly composed of carbon, declined while a majority of amino acids increased under drought across cultivars and CO2 levels. Since carbohydrate (i.e. sucrose and derivatives) supply is crucial for the biosynthesis of cellular compounds (e.g. protein, lipids), the decreases in the leaf levels of carbohydrates such as sucrose, glucose, and fructose in both cultivars at the end of the drought (9th day) period were not surprising.
Rising CO2 levels can ameliorate the negative impacts of water stress on harvestable yields through enhanced photosynthetic rates and improved leaf water status (Sicher & Barnaby Citation2012). However, this positive CO2 effect varies widely among and within species and yield increases of modern cultivars are not consistently responsive to CO2 enrichment (Ziska et al. Citation1998; Ziska & Bunce Citation2007). Altered solute partitioning among different genotypes has frequently been observed in plants exposed to water stress and stress-responsive metabolites contribute to osmotic protection as one important mechanism of drought tolerance (Vasquez-Robinet et al. Citation2008; Silvente et al. Citation2012; Barnaby et al. Citation2013). In this study, genotypic differences in the metabolic responses to water stress were evident, and both qualitative and quantitative differences among genotypes were present. For instance, several metabolites in the Cluster 2 (), which displayed transient accumulation under drought, were more responsive in SD than in HB. However, in Cluster 3, the number of metabolite with decreasing trend under drought was greater in HB than SD (12 versus 9). In fact, HB had higher LWP (less negative) than SD under the drought treatments. Therefore, the above described qualitative and quantitative differences in metabolite levels between the cultivars could be due to the inherent capacity for drought tolerance. Interestingly, all the metabolites of the Cluster 1, which accumulated in drought treated samples, were same in both genotypes except aconitate. We speculate that the Cluster 1 metabolites might accumulate when plants sense and respond to even mild water stress. For instance, Phe accumulated in HB at an earlier stage of the drought with compared to SD.
In summary, leaf metabolites were impacted more due to the drought than CO2 treatments in both cultivars. In addition, the leaf metabolite response between cultivars differed, which was dependent on the intensity and duration of the drought across the CO2 levels. The cultivar HB showed an obvious tolerance to the water deficit due to greater (less negative) LWP than SD; however, both cultivars commonly retained their water status better under the eCO2 level. Results further showed that raffinose was efficiently accumulated under the eCO2 level in HB compared to SB, leading HB to be more tolerant to future climatic water stress condition. In contrast, accumulation of starch and Phe was genotype specific regardless of CO2 levels. We speculated that an adjustment in the metabolic processes such as conversion of starch into soluble sugars and biosynthesis of phenylalanine and other compatible solutes due to an early response under drought conditions might be a strategy to maintain relatively higher leaf water status in potato cultivars such HB. Our results also showed that Pro was accumulated greater under the aCO2 level and in the SB indicating that accumulation of Pro is based on plant water status, leading Pro as a potential means for detecting plant’s water stress level. An obvious effect of eCO2 to maintain relatively greater LWP in HB than SD under stress condition was also observed, indicating the existence of genotypic differences in LWP in response to CO2 enrichment, especially under water deficit conditions. Overall, most leaf metabolites showed a similar pattern between cultivars in response to eCO2 under drought conditions. Thus, genotypic variability for leaf water status and metabolic changes in response to water deficit exist in potato, which can be utilized to identify tolerant cultivars and traits such as LWP and metabolic signatures to develop improved cultivars.
Acknowledgements
The authors thank Mr. Robert Erdman for valuable technical assistance, and Dr. Anna M. McClung for critical reading of the manuscript.
Disclosure statement
No potential conflict of interest was reported by the authors. Mention of a trademark or proprietary product does not constitute a guarantee or warranty of the product by the U.S. Department of Agriculture and does not imply its approval to the exclusion of other products that also can be suitable. USDA is an equal opportunity provider and employer. All experiments complied with the current laws of the United States, the country in which they were performed.
Additional information
Funding
References
- Bajaj S, Targolli J, Liu LF, Ho THD, Wu R. 1999. Transgenic approaches to increase dehydration-stress tolerance in plants. Mol Breed. 5:493–503. doi: 10.1023/A:1009660413133
- Barnaby JY, Fleisher D, Reddy V, Sicher R. 2015. Combined effects of CO2 enrichment, diurnal light levels and water stress on foliar metabolites of potato plants grown in naturally sunlit controlled environment chambers. Physiol Plant. 153:243–252. doi: 10.1111/ppl.12238
- Barnaby JY, Kim M, Bauchan G, Bunce J, Reddy V, Sicher RC. 2013. Drought responses of foliar metabolites in three maize Hybrids Differing in water stress tolerance. Plos One. 8(10):e77145. doi: 10.1371/journal.pone.0077145
- Bhardwaj R, Handa N, Sharma R, Kaur P. 2013. Lignins and abiotic stress: An overview. In: Parvaiz Ahmad, Mohd Rafiq Wani, editor. Physiological mechanisms and adaptation strategies in plants under changing environment-I, Chapter: Lignins and abiotic stress: An overview. New York: Springer; p. 267–296.
- Bhaskara GB, Yang TH, Verslues PE. 2015. Dynamic proline metabolism: importance and regulation in water limited environments. Front Plant Sci. 6:484. doi: 10.3389/fpls.2015.00484
- Bohnert HJ, Jensen RG. 1996. Strategies for engineering water-stress tolerance in plants. Trends Biotechnol. 14:89–97. doi: 10.1016/0167-7799(96)80929-2
- Bouchereau A, Aziz A, Larher F, Martin-Tanguy J. 1999. Polyamines and environmental challenges: Recent development. Plant Sci. 140:103–125. doi: 10.1016/S0168-9452(98)00218-0
- Bowne JB, Erwin TA, Juttner J, Schnurbusch T, Langridge P, Bacic A, Roessner U. 2012. Drought responses of leaf tissues from Wheat cultivars of Differing drought tolerance at the metabolite level. Mol Plant. 5:418–429. doi: 10.1093/mp/ssr114
- Boyer JS. 1982. Plant Productivity and environment. Science. 218:443–448. doi: 10.1126/science.218.4571.443
- Bray EA. 1997. Plant responses to water deficit. Trends Plant Sci. 2:48–54. doi: 10.1016/S1360-1385(97)82562-9
- Cortina C, Culianez-Macia FA. 2005. Tomato abiotic stress enhanced tolerance by trehalose biosynthesis. Plant Sci. 169:75–82. doi: 10.1016/j.plantsci.2005.02.026
- Deblonde PMK, Ledent JF. 2001. Effects of moderate drought conditions on green leaf number, stem height, leaf length and tuber yield of potato cultivars. Eur J Agron. 14:31–41. doi: 10.1016/S1161-0301(00)00081-2
- de Ronde JA, Laurie RN, Caetano T, Greyling MM, Kerepesi I. 2004. Comparative study between transgenic and non-transgenic soybean lines proved transgenic lines to be more drought tolerant. Euphytica. 138:123–132. doi: 10.1023/B:EUPH.0000046806.68554.5b
- Evers D, Lefevre I, Legay S, Lamoureux D, Hausman JF, Rosales ROG, et al. 2010. Identification of drought-responsive compounds in potato through a combined transcriptomic and targeted metabolite approach. J Exp Bot. 61:2327–2343. doi: 10.1093/jxb/erq060
- Fleisher DH, Barnaby JY, Sicher RC, Resop J, Timlin DJ, Reddy VR. 2014. Potato gas exchange response to drought cycles under varying radiation environment and CO2. Agron J. 106:2024–2034. doi: 10.2134/agronj14.0220
- Fleisher DH, Barnaby JY, Sicher RC, Resop JP, Timlin DJ, Reddy VR. 2013. Effects of elevated CO2 and cyclic drought on potato under varying radiation regimes. Agricultural. 171-172:270–280.
- Fleisher DH, Timlin DJ, Yang Y, Reddy VR, Reddy KR. 2009. Uniformity of soil–plant–atmosphere-research chambers. Trans ASABE. 52:1–11. doi: 10.13031/2013.29134
- Garg AK, Kim JK, Owens TG, Ranwala AP, Do Choi Y, Kochian LV, Wu RJ. 2002. Trehalose accumulation in rice plants confers high tolerance levels to different abiotic stresses. Proc Natl Acad Sci U S A. 99:15898–15903. doi: 10.1073/pnas.252637799
- Gorham J. 1995. Betaines in higher plants – biosynthesis and role in stress metabolism. In: RM Wallsgrove, editor. Amino acids and their derivatives in higher plants. Cambridge: Cambridge University Press; p. 171–203.
- Hayashi H, Murata N. 1998. Genetically engineered enhancement of salt tolerance in higher plants. In: Satoh K, Murata N, eds. stress responses of photosynthetic organisms Amsterdam: Elsevier. 133–148.
- Holmstrom KO, Somersalo S, Mandal A, Palva TE, Welin B. 2000. Improved tolerance to salinity and low temperature in transgenic tobacco producing glycine betaine. J Exp Bot. 51:177–185. doi: 10.1093/jexbot/51.343.177
- Hutchinson CM, Gergela DM, Dinkins DA, Redden EE. 2006. “Harley Blackwwell” a new chip stock potato variety for Florida. Proc Fla State Hort Soc. 119:279–281.
- Iwama K, Yamaguchi J. 2006. “Abioticstresses,”in Handbook of potato production, Improvement and Postharvest Management, eds J. Gopal and S.M. Khurana (New York, NY:Food Product Press), 231–278.
- Jun SS, Yang JY, Choi HY, Kim NR, Park MC, Hong YN. 2005. Altered physiology in trehalose-producing transgenic tobacco plants: enhanced tolerance to drought and salinity stresses. J Plant Biol. 48:456–466. doi: 10.1007/BF03030588
- Karafyllidis DI, Stavropoulos N, Georgakis D. 1996. The effect of water stress on the yielding capacity of potato crops and subsequent performance of seed tubers. Potato Research. 39:153–163. doi: 10.1007/BF02358215
- Kondrak M, Marincs F, Antal F, Juhasz Z, Banfalvi Z. 2012. Effects of yeasttrehalose-6-phosphate synthase 1 on gene expression and carbohydrate contents of potato leaves under drought stress conditions. BMC Plant Biol. 12:74. doi: 10.1186/1471-2229-12-74
- Krasensky J, Jonak C. 2012. Drought, salt, and temperature stress-induced metabolic rearrangements and regulatory networks. J Exp Bot. 63:1593–1608. doi: 10.1093/jxb/err460
- Legay S, Lefevre I, Lamoureux D, Barreda C, Luz RT, Gutierrez R, et al. 2011. Carbohydrate metabolism and cell protection mechanisms differentiate drought tolerance and sensitivity in advanced potato clones (Solanum tuberosum L.). Funct Int Genom. 11:275–291. doi: 10.1007/s10142-010-0206-z
- Obidiegwu JE, Bryan GJ, Jones HG, Prashar A. 2015. Coping with drought: stress and adaptive responses in potato and perspectives for improvement. Front Plant Sci. 6:542. doi: 10.3389/fpls.2015.00542
- Pelleschi S, Rocher JP, Prioul JL. 1997. Effect of water restriction on carbohydrate metabolism and photosynthesis in mature maize leaves. Plant Cell Environ. 20:493–503. doi: 10.1046/j.1365-3040.1997.d01-89.x
- Reddy KR, Hodges HF, Read JJ, McKinion JM, Baker JT, Tarpley L, Reddy VR. 2001. Soil–plant–atmosphereresearch (SPAR) facility, a tool for plant research and modeling. Biotronics. 30:27–50.
- Robinson JM. 1984. Photosynthetic carbon metabolism in leaves and Isolated-Chloroplasts from Spinach plants grown under Short and Intermediate photosynthetic Periods. Plant Physiol. 75:397–409. doi: 10.1104/pp.75.2.397
- Roessner U, Luedemann A, Brust D, Fiehn O, Linke T, Willmitzer L, Fernie AR. 2001. Metabolic profiling allows comprehensive phenotyping of genetically or environmentally modified plant systems. Plant Cell. 13:11–29. doi: 10.1105/tpc.13.1.11
- Rotundo JL, Borrás L, Westgate ME, Orf JH. 2009. Relationship between assimilate supply per seed during seed filling and soybean seed composition. Field Crops Res. 112:90–96. doi: 10.1016/j.fcr.2009.02.004
- Sakamoto A, Murata N. 2002. The role of glycine betaine in the protection of plants from stress: clues from transgenic plants. Plant Cell Environ. 25:163–171. doi: 10.1046/j.0016-8025.2001.00790.x
- Sale PWG, Campbell LC. 1986. Yield and composition of soybean seed as a function of potassium supply. Plant Soil. 96:317–325. doi: 10.1007/BF02375136
- Schafleitner R, Gaudin A, Rosales ROG, Aliaga CAA, Bonierbale M. 2007. Proline accumulation and real time PCR expression analysis of genes encoding enzymes of proline metabolism in relation to drought tolerance in Andean potato. Acta Physiol Plant. 29:19–26. doi: 10.1007/s11738-006-0003-4
- Sharp RE, Ober ES. 1992. Regulation of osmotic adjustment in maize roots growing at low water potentials. In: Randall DD, Sharp RE, Novacky AJ, Blevins DG (eds) Current Topics in plant Biochemistry and Physiology, Vol. 11. University of Missouri, Columbia, MO, pp 155–167.
- Sicher RC. 2008. Effects of CO2 enrichment on soluble amino acids and organic acids in barley primary leaves as a function of age, photoperiod and chlorosis. Plant Sci. 174:576–582. doi: 10.1016/j.plantsci.2008.03.001
- Sicher RC, Barnaby JY. 2012. Impact of carbon dioxide enrichment on the responses of maize leaf transcripts and metabolites to water stress. Physiol Plant. 144:238–253. doi: 10.1111/j.1399-3054.2011.01555.x
- Silvente S, Sobolev AP, Lara M. 2012. Metabolite adjustments in drought tolerant and sensitive soybean genotypes in response to water stress. Plos One. 7(6):e38554. doi: 10.1371/journal.pone.0038554
- Stevenson WR, Loria R, Franc GD, Weingartner DP. 2001. Physiological Disorders of tubers: internal Symptoms. In: Compendium of potato Diseases. 2nd ed. St. Paul, MN: American Phytopathological Society.
- Suzuki R, Shimodaira H. 2006. Pvclust: an R package for assessing the certainty in the hierarchical clustering. Bioinformatics. 22:1540–1542. doi: 10.1093/bioinformatics/btl117
- Tarczynski MC, Jensen RG, Bohnert HJ. 1993. Stress protection of Transgenic Tobacco by production of the Osmolyte Mannitol. Science. 259:508–510. doi: 10.1126/science.259.5094.508
- Tingey DT, McVeety BD, Waschmann R, Johnson MG, Phillips DL, Rygiewicz PT, Olszyk DM. 1996. A versatile sun-lit controlled-environment facility for studying plant and soil processes. J Environ Qual. 25:614–625. doi: 10.2134/jeq1996.00472425002500030030x
- USGCRP. 2009. Global Climate change impacts in the United States. In: Karl TR, JM Melillo, TC Peterson, editor. United States Global change Research program. New York, NY, USA: Cambridge University Press.
- Vanholme R, Demedts B, Morreel K, Ralph J, Boerjan W. 2010. Lignin biosynthesis and structure. Plant Physiol. 153:895–905. doi: 10.1104/pp.110.155119
- Vanloon CD. 1981. The effect of water-stress on potato growth, Development, and yield. Am Potato J. 58:51–69. doi: 10.1007/BF02855380
- Vasquez-Robinet C, Mane SP, Ulanov AV, Watkinson JI, Stromberg VK, De Koeyer D, Schafleitner R, Willmot DB, Bonierbale M, Bohnert HJ, et al. 2008. Physiological and molecular adaptations to drought in Andean potato genotypes. J Exp Bot. 59:2109–2123. doi: 10.1093/jxb/ern073
- Vu JCV, Baker JT, Pennanen AH, Allen LH, Bowes G, Boote KJ. 1998. Elevated CO2 and water deficit effects on photosynthesis, ribulose bisphosphate carboxylase-oxygenase, and carbohydrate metabolism in rice. Physiol Plant. 103:327–339. doi: 10.1034/j.1399-3054.1998.1030305.x
- Vyas SP, Kathju S, Garg BK, Lahiri AN. 1985. Performance and metabolic alterations in Sesamum indicum under different intensities of water stress. Ann Bot. 56:323–332. doi: 10.1093/oxfordjournals.aob.a087018
- Yancey PH, Clark ME, Hand SC, Bowlus RD, Somero GN. 1982. Living with water-stress - Evolution of Osmolyte systems. Science. 217:1214–1222. doi: 10.1126/science.7112124
- Yang JY, Fleisher DH, Sicher RC, Kim J, Baligar VC, Reddy VR. 2015. Effects of CO2 enrichment and drought pretreatment on metabolite responses to water stress and subsequent rehydration using potato tubers from plants grown in sunlit chambers. J Plant Physiol. 189:126–136. doi: 10.1016/j.jplph.2015.10.004
- Yencho GC, McCord PH, Haynes KG, Sterrett SBR. 2008. Internal heat necrosis of potato - A review. Am J Potato Res. 85:69–76. doi: 10.1007/s12230-008-9008-4
- Ziska LH, Bunce JA. 2007. Predicting the impact of changing CO2 on crop yields: some thoughts on food. New Phytol. 175:607–617. doi: 10.1111/j.1469-8137.2007.02180.x
- Ziska LH, Bunce JA, Caulfield F. 1998. Intraspecific variation in seed yield of soybean (glycine max) in response to increased atmospheric carbon dioxide. Aust J Plant Physiol. 25:801–807.