
 ?Mathematical formulae have been encoded as MathML and are displayed in this HTML version using MathJax in order to improve their display. Uncheck the box to turn MathJax off. This feature requires Javascript. Click on a formula to zoom.
ABSTRACT
The present study was conducted to determine the predictive screening parameters of quinoa salt tolerance that can be applied at early development stages, based on physiological and biochemical approaches. Four quinoa varieties (Tumeko, Red Faro, Kcoito and UDEC-5) were cultivated using hydroponic system, and treated for 2 weeks with different NaCl concentrations (0, 100, 300 and 500 mM). Salt treatment induced a decrease of plant growth depending on NaCl concentrations, plant organs and varieties. Red Faro and UDEC-5 exhibited low level of Na+ accumulation and high K/Na selectivity. UDEC-5 showed high stomatal conductance leading to high net photosynthesis, even at 500 mM NaCl. Red Faro and UDEC-5 exhibited low level of lipid peroxidation, high antioxidant activities and high proline accumulation, as an indicator of ROS defense and osmotic adjustment. This study suggested that these physiological and biochemical traits could be used as screening criteria for selecting salt tolerant genotype.
1. Introduction
Global climate change represents a major constraint to meet the world food demand by affecting the conditions under which crops can be grown, in particular due to increasing salinization and aridity (Vineis et al. Citation2011; Vineis and Khan Citation2012; Banerjee et al. Citation2017). Indeed, increasing salinization is projected to affect more than 50% of all arable lands by the year 2050 (Jamil et al. Citation2011). At the same time, it is predicted that the human population will reach nine billion within the next decades. This represents an urgent concern since already today 870 million people are suffering from starvation in underdeveloped countries, and more than two billion people are undernourished as a result of inadequate diets (Jacobsen et al. Citation2013; Ruiz et al. Citation2014). Together with an increasing pressure on the world’s food production due to an expanding human population, the pressure on crop production is increasing besides a reduced availability of fresh water for agriculture (Rozema and Flowers Citation2008).
Face to this situation, the expansion of the limited agricultural area in the arid and semi-arid regions of the world, requires the use of suitable crops or genotypes within species tolerant to abiotic stresses such as drought or salinity (Koyro Citation2003; Koyro et al. Citation2006; Shabala Citation2013; Nikalje et al. Citation2017). Moreover, the genetic variability within species often, leads to the identification of tolerant genotypes which can also reduce the cost of saline soils reclamation and clean-up of polluted sites (Nikalje et al. Citation2017). As an example, the so-called ‘cash crop halophytes’ can be cultivated sustainably on dry and/or saline soils under seawater irrigation and can be used for food, fodder, combating soil erosion and various other purposes (Abdelly et al. Citation2006, Citation2011), known as a halophyte plant, Chenopodium quinoa could be used as a potential alternative crop for salt-affected areas (Jacobsen et al. Citation2003; Jacobsen Citation2014; Ruiz et al. Citation2014; Zurita-Silva et al. Citation2014). Quinoa has been recognized as a climate resilient crop of great value and there is an increasing effort to introduce it in different marginal agriculture production systems (Bertero et al. Citation2004; Iqbal et al. Citation2018). Moreover, its suitability for biosaline agriculture is based on the number of different subspecies, varieties and landraces and its ability to adapt different environments (Karyotis et al. Citation2003; Shabala et al. Citation2013). The high variability in stress tolerance among varieties, together with the ecological and economic potential, is the reason for studying the quinoa salt resistance mechanisms at early seedling stage in the present investigation.
It has been widely demonstrated that salinity affects almost every aspect of plant physiology and biochemistry by three ways: (i) osmotic stress induced by the low water potential in the root surface (ii) toxic effects due to the specific Cl− and Na+ stresses, and (iii) nutrient imbalance caused by excess of theses ions (Munns and Termaat Citation1986; Munns and Tester Citation2008). Salinity affects plant growth and development through the perturbation of gas exchange and photosynthesis process. In fact, the photosynthetic rate (AN), stomatal conductance (gs), intracellular CO2 concentration (Ci), transpiration (E) and water use efficiency (WUE) are susceptible to salt stress (James et al. Citation2002; Koyro Citation2006; Eisa et al. Citation2012; Goussi et al. Citation2018). All these processes are highly complex and related to many factors such as: stress duration, plant development stage, genotype tolerance and also the genotype x environment interaction (Manaa et al. Citation2011, Citation2019; Negrão et al. Citation2017). Moreover, plants showed different physiological and biochemical mechanisms of salt stress tolerance, which are quite complex including: osmotic adjustment, compartmentation of toxic ions (Munns and Tester Citation2008), osmoprotection and compatible solutes accumulation (Flowers and Colmer Citation2008), redox control, and scavenging of active oxygen species (Gill and Tuteja Citation2010). All these parameters are generally used as screening techniques for salinity tolerance in a wide range of plant species. In fact, proline accumulation is used as one of the most important physiological indicator for salt tolerance (Ashraf and Harris Citation2004; Misra and Gupta Citation2005; Mansour and Ali Citation2017).
One of the biochemical changes occurring when plants are subjected to salt stress is the accumulation of reactive oxygen species (ROS), such as both free radical (superoxide O2•−, and hydroxyl radicals OH•) and non-radical forms (hydrogen peroxide H2O2 and singlet oxygen 1O2) (Mittler Citation2002; Gill and Tuteja Citation2010). These ROS are highly reactive and could affect various cellular functions through damaging nucleic acids, oxidizing proteins, and causing lipid peroxidation (Apel and Hirt Citation2004; Foyer and Noctor Citation2005). Indeed, previous studies revealed that malondialdehyde (MDA) accumulation (a product of lipid peroxidation) should be considered as an indicator of oxidative stress and membrane integrity and could be used to discriminate between salt-tolerant and salt-sensitive genotypes (Demiral and Türkan Citation2005). To cope with oxidative stress, plants can regulate the ROS by scavenging them through an antioxidant defense system including enzymatic and non-enzymatic antioxidants (Gill and Tuteja Citation2010; Manaa et al. Citation2014a; Waqas et al. Citation2019).
Discrimination between resistant and sensitive genotypes within species is clearly a challenging but tricky issue and should allow for a better understanding of the physiological and biochemical mechanisms of salt tolerance cited above. Accordingly, the main objective of this work is to study the variability in salt tolerance of four quinoa varieties as assessed by physiological and biochemical traits. The present work will contribute to determine the predictive screening parameters for selecting salt tolerant genotypes that can be applied at early development stages, especially in halophyte species.
2. Materials and methods
2.1. Plant material and growth conditions
Quinoa (Chenopodium quinoa Willd.) seeds were provided by the United States, Department of Agriculture (USDA) and the seedbank of International Center for Biosaline Agriculture (ICBA). The collected seeds were multiplied in a greenhouse in the Centre of Biotechnology of Borj-Cedria (CBBC) in north east of Tunisia, (N 36°42′33.25″–E10°25′37.99″) which is characterized by sub-humid mediterranean climate. Seeds of four quinoa varieties: Tumeko (Q1), Red Faro (Q2), Kcoito (Q3) and UDEC-5 (Q4) were collected on June 2018, and surface-sterilized by soaking in 20% (v/v) sodium hypochlorite solution for 5 min, then rinsed generously with distilled water. The seeds were sown at the depth of 0.5–1.5 cm in fine sand, and irrigated with distilled water. The obtained seedlings (3 weeks old) were transferred to continuously aerated hydroponic medium, with a half-strength Hewitt’s (Citation1966) solution containing: 3.5 mM Ca(NO3)2, 3.0 mM KNO3, 1.5 mM MgSO4, 1.6 mM KH2PO4, 0.6 mM K2HPO4, 3 µM Fe–K-EDTA, 0.05 µM H3BO3, 0.5 µM MnSO4, 0.04 µM CuSO4, 0.05 µM ZnSO4, and 0.02 µM (NH4)6Mo7O24. After 10 days of plant acclimation, hydroponic medium was substituted by full-strength nutrient Hewitt’s solution. After seedlings establishment, at four full expanded leaves stage (28 days after sowing) mentioned as BBCH-14 (Sosa-Zuniga et al. Citation2017), salt treatment was started. To prevent the osmotic shock, NaCl was added with the gradual increase of 50 mM d−1 to achieve the desired concentrations of 100, 300 and 500 mM. Salt stress was maintained for 2 weeks. Culture was conducted during February and March 2019 in a controlled greenhouse with temperature of 24/18°C and relative humidity of 70/90% day/night, respectively. The photoperiod increased from 12 h in February to 13 h in March.
2.2. Plant growth determinations and ion analysis
After 2 weeks of salt treatment, plants were harvested, fresh weight (FW) and dry weight (DW) were determined after desiccation at 80°C for 72 h. Water content (WC, ml.g−1 DW) was estimated using the equation: WC = (FW-DW)/DW.
Dried samples of leaves, stems and roots were finely ground and digested with nitric acid (1% (v/v) HNO3), according to the method of Wolf (Citation1982). The cations (K+, Ca2+, and Na+) were assayed by flame emission photometry, using an Eppendorf spectrophotometer (Eppendorf Geratebau Netherler). Magnesium (Mg2+) was measured by atomic absorption spectrophotometer (Philips PU9100X).
2.3. Gas exchange and pigment analysis
Gas exchange measurements were performed using a portable infrared gas analyzer (model LCpro+, ADC BioScientific Ltd., Hoddesdon Herts, EN11 0NT England) as described by Farhat et al. (Citation2013). Net CO2 assimilation rate (An) [μmol(CO2) m–2 s–1], stomatal conductance (gs) [mol(H2O) m–2 s–1], transpiration rate (E) [mol(H2O) m–2 s–1], and intercellular CO2 concentration (Ci) [μmol(CO2) m–2 s–1] were determined on expanded leaves from 10:00 to 12:00 am. All measurements were carried out in the greenhouse at 24 ± 2°C air temperature and 70 ± 10% relative air humidity and with 1177 μmol m−2 s−1 photosynthetic active radiations. Water use efficiency (WUE) was calculated as An/E ratio.
Chlorophyll pigments were determined according to the method of Lichtenthaler (Citation1987). Briefly, 100 mg of fresh leaf discs (0.2 cm2) were immersed in 5 ml of 80% (v/v) acetone and kept in dark for 72 h, under room temperature. Chl a, chl b and total chl contents were measured by spectrophotometry according to Lichtenthaler’s (Citation1987) equations:
2.4. Biochemical parameters
2.4.1. Proline content
Proline concentration was determined using the method of Bates et al. (Citation1973). Briefly, proline was extracted from fresh leaves and roots (200 mg for each sample) with 10 ml of 3% Sulfosalicylic acid, at 70°C for 30 min. An aliquot of 1 ml of the extract was mixed with 1 ml of glacial acetic acid and 1 ml of acid ninhydrin. The mixture was heated at 90°C for 1 h in water bath and the reaction was stopped using ice. The mixture was extracted with toluene, and the absorbance of toluene fraction (aspired from the liquid phase) was measured at 520 nm using UV/VIS spectrophotometer (PerkinElmer, Norwalk, USA). Proline concentration was determined using calibration curve as μmol proline g−1 FW.
2.4.2. Lipid peroxidation
The level of lipid peroxidation was measured as 2-thiobarbituric acid-reactive substances (mainly malondialdehyde, MDA) according to Rao and Sresty (Citation2000). Frozen samples (500 mg FW) were homogenized with a pre-chilled mortar and pestle with 2 ml of ice-cold trichloroacetic acid TCA (0.1%, w/v) and centrifuged at 15.000 × g for 15 min and at 4°C. Assay mixture containing 2 ml aliquot of supernatant and 2 ml of 0.67% (w/v) thiobarbituric acid (TBA), was heated at 95°C for 20 min and then rapidly cooled in ice-bath. The samples were centrifuged (10.000 × g for 10 min at 4°C) and the supernatant absorbance was measured at 532 and 600 nm. The concentration of MDA was calculated from the difference between the two values using extinction coefficient (155 mM−1 cm−1).
2.4.3. Hydrogen peroxide (H2O2) content
The hydrogen peroxide (H2O2) concentration was measured according to the method previously described by Loreto and Velikova (Citation2001). Frozen leaf samples (500 mg) were homogenized in 5 ml of 1% (w/v) ice-cold trichloroacetic acid (TCA) and centrifuged at 14.000 × g, for 20 min at 4°C. Subsequently, 0.5 ml of supernatant was mixed with 0.5 ml of potassium phosphate buffer (10 mM, pH 7.0) and 1.5 ml of potassium iodide (1 M) in a ratio 2:1 (v/v). The absorbance was spectrophotometrically measured at 390 nm. The hydrogen peroxide content was calculated using a standard curve using different concentrations of H2O2.
2.4.4. Protein quantification and antioxidants assay
Total soluble protein content was measured according to the method of Bradford (Citation1976). Fresh leaves (100 mg) were homogenized with ice-cold sodium phosphate buffer (50 mM, pH 7.2) containing 1 mM EDTA.Na2 and 2% (w/v) PVPP and then centrifuged at 13.000 × g for 40 min at 4°C. The supernatant was collected and stored in small aliquots at −80°C. For protein quantification, the supernatant was mixed with Bradford reagent (B6916) and incubated thereafter in the dark for 5 min. The absorbance was measured at 595 nm using UV/VIS spectrophotometer. Soluble protein concentration in enzyme extract was estimated according to Bradford (Citation1976) using bovine serum albumin (BSA) as standard.
Total catalase (CAT, EC 1.11.1.6) activity was evaluated according to the method of Aebi (Citation1984), by monitoring the decline in the absorbance at 240 nm, as H2O2 was consumed. A volume of 3 ml of the reaction mixture contained 30% H2O2 (v/v) and 0.1 mM EDTA, was suspended in sodium-phosphate buffer (50 mM, pH 7.2). The catalase activity was expressed as U mg−1 protein min−1.
Ascorbate peroxidase (APX, EC 1.11.1.11) activity was assayed according to Nakano and Asada (Citation1981). The reaction mixture (1.5 mL) contained phosphate buffer 50 mM (pH 7.0), 0.1 µM EDTA, 0.5 mM ascorbate, 2 mM H2O2, and 50 µL enzyme extract. The reaction was started by the addition of H2O2 and ascorbate oxidation measured at 290 nm. The molar extinction coefficient was 2.8 mM-1cm-1.
2.5. Statistical analysis
The statistical analysis was performed using ‘Statistica’ software (version 6.0). All means values and standard error (SE), of physiological and biochemical parameters were obtained from 6 replicates. Only differences with a P value < 0.05 were considered statistically significant according to Duncan’s multiple range tests. The relationship between varietal and NaCl effects was assessed by two-way ANOVA analysis (P < 0.01, P < 0.001 and P < 0.0001).
3. Results
3.1. Plant growth and water status
Our results showed some differences between genotypes in biomass production under control conditions (). In fact, the varieties (Q2 and Q4) showed better plant growth as revealed by the highest value of DW under control condition (0 mM NaCl), as compared to the two other varieties (A). Under salinity conditions, plant growth decreased with increasing NaCl concentrations, depending on plant organs and varieties. Indeed, whole plant DW, significantly decreased with increasing NaCl concentrations, as compared to control, in all varieties. At all NaCl concentrations, Q2 and Q4 showed the highest values of plant DW production (A). Under moderate salinity (100 mM NaCl), Q3 exhibits the biggest loss in DW (about 33%, as compared to control), while this decrease reached only 21% for Q4. Under high salinity (500 mM NaCl), the decrease of plant growth was more pronounced and was about 52% and 58% for Q1 and Q2 respectively, and about 62% for both varieties (Q3 and Q4).
Figure 1. Varietal difference in plant growth parameters; Dry Weight of Whole plant (A), leaves (B), Stems (C) and Roots (D) of quinoa genotypes cultivated under different NaCl concentrations (0, 100, 300 and 500 mM) during 15 days of treatment. Data are means of 6 replicates ± SE. Means with similar letters are not different at P < 0.05 according to Duncan’s multiple range test at 95%.
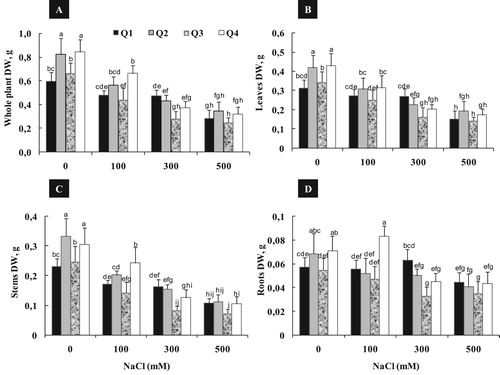
The magnitude of salt effect was also linked to the plant organ considered (B–D). For example, Q3 and Q4 varieties showed a reduction of leaves DW, which was approximately 27%, 52% and 60% as compared to control, respectively for 100, 300 and 500 mM NaCl (B).
The root DW was less sensitive to salt treatment than shoot in all varieties (D). Indeed, no significant variation was detected in root DW between control and moderate salinity (100 mM NaCl) at all varieties. Salt treatment induced a stimulation of root growth: the increase of root DW was about 17% for Q4 treated by 100 mM and about 10% for Q1 treated by 300 mM. Under high salinity (500 mM NaCl), difference among varieties becomes more pronounced, when root DW reduction was just about 22% for Q1 and about 40, 37% and 39%, as compared to control, respectively for Q2, Q3 and Q4.
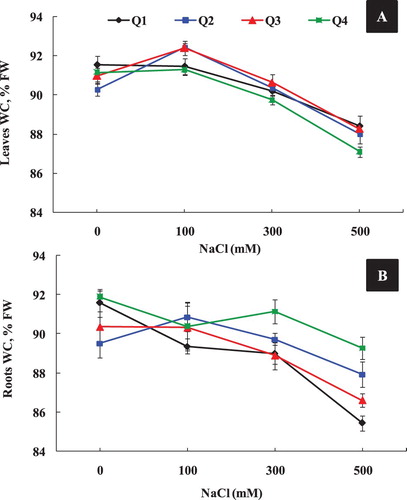
On the other hand, salinity induced some variations in water component with respect to varieties, plant organ and NaCl concentration. Our data showed that under moderate salinity (100 mM NaCl), Q4 maintained its shoot and root water content (WC), as compared to control (A), whereas, a significant increase of shoot WC was detected in Q2 and Q3 varieties. High NaCl treatment (500 mM), significantly reduced shoot and root WC of all genotypes. In fact, Q2 and Q4 varieties showed the highest value of root WC under high salinity (300 and 500 mM) as compared to Q1 and Q3 varieties.
Figure 2. Leaves (A) and Roots (B) water content of four quinoa genotypes cultivated under different NaCl concentrations (0, 100, 300 and 500 mM) during 15 days of treatment. Data are means of 6 replicates ± SE.
3.2. Mineral analysis
The addition of NaCl to the culture medium induced an accumulation of large amount of toxic ion Na+ in all varieties (A, A). Under moderate salinity (100 mM NaCl), no significant difference in shoot Na+ content was detected between varieties, while, Na+ was more accumulated in root of Q2 and Q4 than in Q1variety (A). High salt treatment (300 mM NaCl) induced an additional increase of shoot and root Na+ content in all varieties. It is noteworthy that under 500 mM NaCl, Q2 and Q4 showed the lowest Na+ content in shoot and root, suggesting that these two varieties were able to control Na+ accumulation, even at seawater salinity level (A, A). In addition, this mechanism to control sodium toxicity was more obvious with Q4 variety which showed constant shoot Na+ content, under different NaCl concentrations.
Under moderate salinity (100 mM NaCl), Q4 variety showed a decrease of K+, Mg2+ and Ca2+ content, about 45%, 47% and 57%, respectively (B–D). While, this decrease was just about 15%, 11% and 26% as compared to control, for Q3 variety. High salt treatment (500 mM NaCl) had no additional decrease in shoot K+ content in Q4 variety which showed the highest value compared to other varieties (B). Moreover, Q4 variety, maintained the same K+ value under high salt level (500 mM NaCl), as obtained under control condition. Under 100 and 300 mM NaCl treatments, Q2 variety clearly, maintained constant its root K+ content same as detected in control (B). It should be noted that high salinity (500 mM NaCl) induced a significant decrease of Mg2+ content in root and shoot of all varieties. This effect was less pronounced in shoot and root of Q4 variety (C, C).
Figure 3. Effect of different NaCl concentrations (0, 100, 300 and 500 mM) on root Na+ (A), K+ (B), Mg2+ (C) and Ca2+ (D) content of four quinoa genotypes after 2 weeks of treatment. Means of six replicates ± SE. Bars with similar letters are not different at P < 0.05 according to Duncan’s multiple range test at 95%.
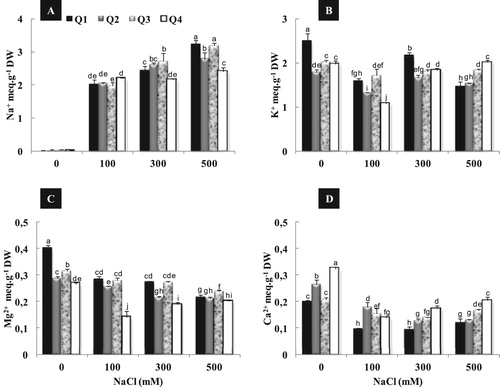
Figure 4. Effect of different NaCl concentrations (0, 100, 300 and 500 mM) on leaves Na+ (A), K+ (B), Mg2+ (C) and Ca2+ (D) content of quinoa genotypes after 2 weeks of treatment. Means of six replicates ± SE. Bars with similar letters are not different at P < 0.05 according to Duncan’s multiple range test at 95%.
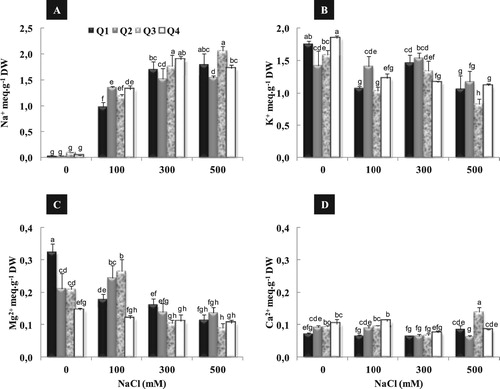
In the same way of K+ accumulation, Q4 showed the highest value of shoot Ca2+ content under 500 mM NaCl (D). Root Ca2+ content remained almost constant in all varieties under moderate salinity (100 mM NaCl) compared to the control (D). Under high salinity (500 mM), a stimulation of root Ca2+ content was observed in Q1 and Q3. This increase was about 20% and 47% as compared to control, for Q1 and Q3 respectively.
3.3. Photosynthesis
3.3.1. Chlorophyll content
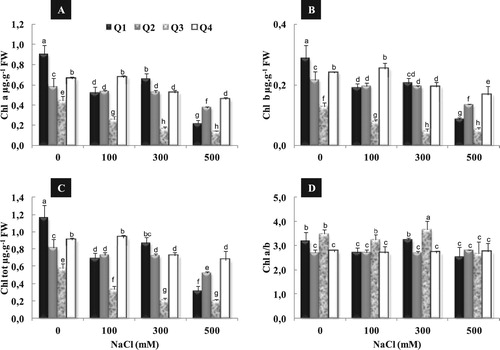
Under control condition (0 mM NaCl), Q1 variety exhibited the highest level of Chl a, Chl b and Chl tot (A, B, D). Under moderate salinity (100 mM NaCl), Chl a, Chl b and Chl tot content decreased, significantly, in Q1 and Q3 as compared to control, whereas remained almost constant for Q2 and Q4. Application of high salinity (300 mM NaCl) had no additional decrease of Chl a, Chl b and Chl tot content of Q1 and Q2, while the decrease of Chl content becomes more pronounced under (500 mM NaCl) treatment, in all varieties. In addition, Q4 presented the least decrease in Chl content with 31%, 30% and 26% as compared to control, respectively for Chl a, Chl b and Chl tot. In contrast, salt treatment had no considerable effect on the Chl a/b ratio in all varieties, except a slight decrease observed only in Q1 and Q3 treated by 500 mM NaCl (D).
Figure 5. Variation in chla (A), Chlb (B), total chl content (C) and Chl a/b ratio (D) in four quinoa genotypes cultivated under different NaCl concentrations (0, 100, 300 and 500 mM) during 15 days of treatment. Data are means of 6 replicates ± SE. Means with similar letters are not different at P < 0.05 according to Duncan’s multiple range test at 95%.
3.3.2. Gas exchange
Intercellular CO2 concentration (Ci), net CO2 assimilation (An) and stomatal conductance (gs) gradually decreased with increasing NaCl concentrations, in all varieties (). Salt-induced photosynthesis inhibition was accompanied with a decrease of water use efficiency (WUE) as shown by A/E ratio. Application of moderate salinity (100 mM NaCl) increased the transpiration rate (E) by 52% and 28% as compared to control, respectively for Q1 and Q3. However, under high salinity (300 and 500 mM NaCl) the transpiration rate remained almost constant for Q2 and Q4 varieties. This latter showed the highest value of intercellular CO2 concentration (Ci), net CO2 assimilation (An) and stomatal conductance (gs) under high NaCm treatment (500 mM).
Table 1. Effect of NaCl on substomatal CO2 concentration (Ci), transpiration rate (E), stomatal conductance (gs), net CO2 assimilation (An) and water use efficiency (A/E) of quinoa genotypes. Means (n = 6 per treatment ± SE.) values with different letters are significantly different (P < 0.05).
3.4. Proline content
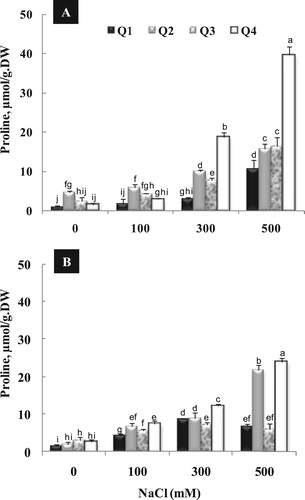
Proline content, significantly, increased with increasing NaCl concentration in growth medium. In fact, the highest proline content in both leaves and roots was detected under high salinity (300 and 500 mM NaCl) in all varieties. It should be noted that, a considerable increase of proline content was observed under 300 and 500 mM in leaves of Q4 (). In the same way, the root showed the highest amount of proline in Q2 and Q4, especially under high salinity (500 mM NaCl).
Figure 6. Changes in leaf (A) and root (B) proline content (µmol/g.DW) in quinoa genotypes following exposure to different NaCl concentrations (0, 100, 300 and 500 mM). Each bar represents the mean (±S.E.) of 6 replicates.
3.5. Lipid peroxidation and H2O2 accumulation
Salt treatment, gradually, increased the accumulation of malondialdehyde (MDA) and H2O2 with respect to variety and NaCl concentrations (A, B). Under moderate salinity (100 mM NaCl), Q2 and Q4 were qualified as the most resistant varieties showing the lowest accumulation of MDA and H2O2 as compared to Q1 and Q3. Moreover, under high NaCl treatment (300 and 500 mM), Q4 exhibited the least increase of MDA content as compared to other varieties (Q1, Q2 and Q3) which showed roughly same values (A).
Figure 7. Varietal difference in shoot MDA (A) and H2O2 content (B), CAT (C) and APX (D) activity of quinoa genotypes cultivated under different NaCl concentrations (0, 100, 300 and 500 mM) during 15 days of treatment. Data are means of 6 replicates ± SE. Means with similar letters are not different at P < 0.05 according to Duncan’s multiple range test at 95%.
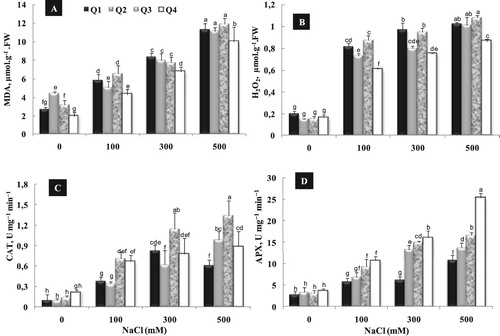
In the same way of MDA, H2O2 accumulation gradually, increased with increasing NaCl concentration in all varieties (B). Indeed, Q4 exhibited the lowest leaf content of H2O2 at all NaCl levels, demonstrating a low membrane lipid peroxidation caused by oxygen radicals in this variety.
3.6. CAT and APX activity
Addition of NaCl in the culture medium induced a significant increase in the antioxidant enzyme activities of CAT and APX, depending on NaCl concentration and variety (C, D). Under moderate salinity (100 mM NaCl), salt-induced antioxidant activities were more obvious, especially, in Q3 and Q4 varieties. While, no significant difference was observed in CAT activity under high salinity between varieties, except Q1 which showed the lowest CAT activity under 500 mM NaCl (C). It should be noted that, APX activity was much higher in Q4 at all salinity levels than others varieties (D).
4. Discussion
In the present study, a screening for salinity resistance of four quinoa varieties (Tumeko, Red Faro, Kcoito and UDEC-5) was investigated at an early seedling stage, in order to identify suited physiological and biochemical markers. In fact, plant growth and biomass yield parameters are generally used to assess plant salt tolerance, as previously described in several investigations (Flowers and Colmer Citation2015; Waqas et al. Citation2017; Hussain et al. Citation2018). Our results showed that salt stress induced a significant individual effect of NaCl on plant growth parameters of each variety (, ). Salt treatment decreased significantly plant growth parameters of all varieties, proportionally to NaCl concentration (). Moreover, all tested varieties in the present study were able to survive under high salt level (500 mM NaCl) more than seawater salinity (with electrical conductivity 35 dS/m as 400 mM NaCl). Therefore, this quinoa species was qualified as facultative halophytic plant, as previously demonstrated (Jacobsen et al. Citation2001, Citation2003; Koyro and Eisa Citation2008; Hariadi et al. Citation2011; Adolf et al. Citation2012). Here we qualified, Red Faro (Q2) and UDEC5 (Q4) as the most resistant varieties due to their ability to produce more biomass than two other varieties, even at seawater salinity level (500 mM NaCl) (A). These varieties also showed a developed root system under moderate salinity (100 mM NaCl), especially for Q4 (D). In order to better understand the plant growth response to NaCl treatment, a two-way analysis of variance was performed and indicated that genotype (V) X treatment (T) interaction factor was highly significant, especially in root (F = 3.69; P < 0.001, ). The decrease of shoot growth paralleled with root growth stimulation and increased shoot/root ratio has been also considered as physiological adaptations to salt stress in several halophytes such as Suaeda maritima (Dajié et al. Citation1997), Plantago coronopus (Koyro Citation2006) Crithmum maritimum (Ben Amor et al. Citation2005) and Suaeda fruticosa (Khan et al. Citation2000).
Table 2. Significance of the variation source for plant growth and water content (two-way analysis of variance) of different quinoa genotypes under NaCl treatment (0, 100, 300 and 500 mM) conditions.
A high interaction (F = 9.41; P < 0.0001, ) between NaCl treatment (T) and variety (V) was detected in shoot DW, suggesting that quinoa salt resistance is widely correlated to the ability of plant to adjust and preserve the water status. Once more, we found that Q4 variety maintained shoot and root hydration under moderate salinity (), this is certainly due to the control of transpiration rate (E) which remained almost constant, even at high salinity (300 and 500 mM NaCl) (). Regarding the high ‘NaCl treatment (T) X variety (V) interaction’ as for shoot WC, the succulence in plant organ may serve as a good salt tolerant marker of halophyte because the increase of WC in shoot can induce a dilution of accumulated salt, as previously demonstrated (Arndt et al. Citation2004; Debez et al. Citation2004).
Screening for genotype resistance to salinity requires other appropriate physiological traits such as: Na+ accumulation and its relationship with the distribution of the others essential ions (K+, Mg2+ and Ca2+) (Cuartero et al. Citation2002; Koyro and Eisa Citation2008). In our study, Na+ accumulation was recorded under salt treatment depending on NaCl concentrations, varieties and organs considered ( and ). No significant variety effect on leaf Na+ content was detected with moderate salinity, which indicated that the regulation of Na+ uptake and accumulation is one of the most important salt resistance mechanisms of quinoa (Shabala et al. Citation2013). In addition, the high ability to maintain shoot WC and biomass production under moderate salinity (100 mM NaCl) together with Na+ accumulation offers to quinoa a new character as ‘salt includer halophyte’. As previously demonstrated, this mechanism includes vacuoles sequestration or compartimentation of toxic ion (especially Na+) responsible for osmotic adjustment (Flowers and Colmer Citation2008; Shabala Citation2013). This character is the case of Q1 and Q3 varieties which continue to accumulate more Na+, even at high salinity (500 mM NaCl). However, under this condition, an apparent differential effect was observed showing that Q2 and Q4 varieties exhibited constant root Na+ content (D) and low shoot Na+ accumulation (D). These data suggested that both varieties (Q2 and Q4) possess a high capacity to limit the sodium accumulation in shoot via the control of Na+ uptake from the medium. Generally, excessive accumulation of Na+ leads to a nutritional imbalance, usually associated with the restriction of nutrients (K+, Mg2+ and Ca2+) uptake. Such mechanism was previously demonstrated for several halophyte species: Limonium delicatulum (Souid et al. Citation2018), Cakile. maritima (Debez et al. Citation2004), Atriplex lentiformis (Flowers et al., Citation2015) and Crithmum maritimum (Ben Amor et al. Citation2005). This is also the same case of quinoa which showed a significant decrease in leaf K+, Mg2+ and Ca2+ under salt treatment, depending on both NaCl level and variety ( and ). Our data also demonstrated that these two most resistant varieties (Q2 and Q4) showed a high K+ and Mg2+ efficiency under high salinity (300 and 500 mM NaCl). Consequently, we suggested that these varieties remain selective for K+ as a sign of osmotic adjustment, especially for Q4 (Yeo Citation1998; Ben Amor et al. Citation2005). Previous study conducted on quinoa demonstrates that in both young and old leaves the full osmotic adjustment can be achieved only through the inorganic osmolyte accumulation (Na+ and K+) (Hariadi et al. Citation2011). The decrease in K+ content, in other varieties (Q1 and Q3) under high salinity, may be related to its replacement by the Na+ for a function in osmoregulation. Such observation was considered as a good marker of ‘Halophytism’ to escape from Na+ toxic effect (Harrouni et al. Citation2003). Particularly, variety Q4 exhibited the high selectivity for potassium as expressed by K+/Na+ ratio of shoot and root, especially under 500 mM NaCl (). In this regards, our data are in agreement with previous studies carried on Crithmum maritimum (Ben Amor et al. Citation2005), showing a strong correlation between potassium and sodium uptake under high salinity. Besides, our findings demonstrated a high capacity of quinoa to conserve K+ supply under high external NaCl concentrations and suggested the K+/Na+ selectivity as a suitable marker for quinoa salt tolerance.
Table 3. Shoot and root K+/Na+ ratio of different quinoa genotypes under NaCl treatment (100, 300 and 500 mM) conditions. Values in each line with the same letters are not significantly different at P < 0.05 according to Duncan test.
Photosynthesis together with cell growth are among the primary process affected by ionic and osmotic stress (Sudhir and Murthy Citation2004; Oukarroum et al. Citation2015; Goussi et al. Citation2018). Our results demonstrated that photosynthesis-related parameters ( and ) showed a high significant NaCl and/or genotype effect (P < 0.0001). We also demonstrated that under high salt treatment (500 mM NaCl), the most resistant variety (Q4) achieved a high stomatal conductance (gs) leading thus to high levels of both intercellular CO2 concentration (Ci) and net photosynthesis (A) (). The salt stimulation of net photosynthesis (A) was previously reported in an extreme halophyte Arthrocnemum macrostachyum cultivated under high salinity (Redondo-Gómez et al. Citation2010), and also observed in Sarcocornia fruticosa and Atriplex portulacoides cultivated under low salinity (Redondo-Gómez et al. Citation2006, Citation2007). In our study, no significant (V) x (T) interaction was detected on net CO2 assimilation (An) (F = 1.2 NS, ). This indicates that the modifications of photosynthesis processes under salt stress are highly complex and involve the interplay of limitations taking place at different sites of the cell/leaf (Ashraf and Harris Citation2013).
Table 4. Significance of the variation source for photosynthesis-related parameters (two-way analysis of variance) of different quinoa genotypes under NaCl treatment (0, 100, 300 and 500 mM) conditions.
Exposed to salt stress, plants have developed complex mechanisms for adaptation to osmotic stress. These mechanisms include osmotic adjustment by accumulation of organic solutes/osmolytes as proline (Gill and Tuteja Citation2010). The role of proline in screening of genotypes for salt tolerance, remains highly controversial in the literature as investigators have obtained contrasting results (Misra and Gupta Citation2005; Mittal et al. Citation2012; Mansour and Ali Citation2017). In the present study, salt treatment induced a significant accumulation of proline with respect to NaCl level, variety and organ tissue considered (). Indeed, a significant treatment (T), varietal (V) and an interaction (V X T) effect (F = 115.0; p < 0.001) was detected in quinoa shoot (). Under high salinity (300 and 500 mM NaCl), the most resistant genotype (Q4) showed the highest level of proline accumulation in leaves and root. This suggested the use of proline as an appropriate marker playing important role in ROS defense, protein protection and cytoplasmic osmotic adjustment (Bano et al. Citation2014).
Table 5. Significance of the variation source for biochemical-related parameters (two-way analysis of variance) of different quinoa genotypes under NaCl treatment (0, 100, 300 and 500 mM) conditions.
In disagreement with our results, a negative correlation between proline accumulation and salt tolerance has been reported in rice genotypes (Lutts et al. Citation1996). Earlier study showed that two rice cultivars identified to have contrasting in salt tolerance levels contain similar proline contents in their leaves (Zhao et al. Citation2014). Many reports on halophyte plant demonstrated that proline accumulation under high salinity contributed to less than 0.2% to solute potential in Suaeda physophora (Song et al. Citation2006) and to less than 0.5% in Suaeda salsa (Zhang and Zhao Citation1998). This was certainly due to the role of major contributors of inorganic osmolyte accumulation (Na+ and K+) to osmotic adjustment. The latter has been well demonstrated in the halophyte Limonium latifolium (Gagneul et al. Citation2007) and Atriplex halimus (Bendaly et al. Citation2016).
On the other hand, proline contributes to stabilizing sub-cellular structures (e.g. membranes and proteins), scavenging free radicals, and buffering cellular redox potential under stress conditions (Ashraf and Foolad Citation2007). This is the case of the most resistant varieties UDEC5 (Q4) which showed the highest proline accumulation paralleled by the lowest MDA content and H2O2 accumulation, as a sign of low oxidative stress. Our data are in agreement with previous study conducted on quinoa showing that salinity stress induced the oxidative damage by increasing lipid peroxidation level in roots and more specifically in leaf tissues (Waqas et al. Citation2017).
Earlier reports revealed that lipid peroxidation, known as the sign of membrane damage, should be regarded as a sign of oxidative stress and could be used to discriminate between salt-tolerant and salt-sensitive genotypes (Demiral and Türkan Citation2005). Our result showed that the increase in MDA content was concomitant to an increase in H2O2 accumulation under salt treatment, with respect to NaCl level and variety. The two-way ANOVA analysis of variance of H2O2, as shown on , confirmed the significant effect of salt treatment (T) (P < 0.0001), variety (V) (P < 0.0001) and their interaction (V X T) (P < 0.01).
Under high salinity (300 or 500 mM NaCl), the performance of Q4 was strongly associated to the low level of both lipid peroxidation and oxidative stress. In addition, this genotype exhibited low photorespiration (low H2O2 accumulation) and high APX activity even under high salinity (C, D), suggesting less cellular damage caused by oxygen radicals, as previously demonstrated by Waqas et al. (Citation2019).
Plants could regulate the ROS scavenging through the antioxidant enzymes (Apel and Hirt Citation2004; Gill and Tuteja Citation2010). The capacity to scavenge ROS and to reduce their deleterious effects on macromolecules appears to be a distinctive indicator of salt tolerance (Ashraf and Harris Citation2004). Herein, a strong correlation (P < 0.0001, ) was observed between salt treatment (T) and variety (V) effect on CAT accumulation in leaf. Interestingly, the low CAT activity, detected in the most resistant genotype Q4, was also accompanied by a low level of H2O2, detected during photorespiration under high salinity. This direct relationship between CAT activity and cellular peroxide level may be explained by the use of other H2O2 scavenging enzymes like ascorbate peroxidase (APX) and peroxidases (POX) as the major scavenger of the hydrogen peroxide under low CAT activity (Willekens et al. Citation1997).
Moreover, maintaining cytoplasmic Ca2+ concentrations in all varieties under moderate salinity (100 mM), and its stimulation in root under high salinity (500 mM) (D, (D), suggested that Ca2+ could be correlated with the increase of antioxidant enzyme activities and the decrease of cell membrane lipid peroxidation as previously demonstrated (Ben Amor et al. Citation2005; Manaa et al. Citation2014b).
5. Conclusion
In order to develop promising useful strategies for selecting salt resistant genotypes of quinoa, we focused on the relevance of G x E interaction effects. This study showed great difference in varietal responses to salt in respect to NaCl level. The physiological and biochemical markers of salt tolerance described here are highly correlated to the major constraints of salinity on plant growth, restriction of CO2 gas exchange, ion toxicity and the accumulation of ROS. In summary, we qualified Red Faro (Q2) and UDEC-5 (Q4) as the most tolerant genotypes according to: (i) high growth performance and biomass production even at all salinity levels. (ii) Maintaining convenient tissue water supply and control of the transpiration rate. (iii) Low level of sodium toxicity accompanied with high K+/Na+ selectivity, high K+ and Mg2+ efficiency under high salinity. (iv) High stomatal conductance associated with high intercellular CO2 concentration and high net photosynthesis, especially for variety UDEC-5 (Q4). (v) Limitation of membrane lipid peroxidation, oxidative stress and photorespiration. (vi) The important role of proline in ROS defense, protein protection and cytoplasmic osmotic adjustment. Further investigations needs to be done using the interactive response of Red Faro (Q2) and UDEC-5 (Q4) as a matrix for future work which integrates transcriptomic and proteomic approaches to define salt tolerance mechanism and to identify potential candidate genes responsible for quinoa salt-tolerance.
Acknowledgements
The authors acknowledge the Ministry of Higher Education and Scientific Research (grant No: DP-2017-BALT-742) of Tunisia for financial support. The authors acknowledge the United States Department of Agriculture (USDA) and seedbank of International Center for Biosaline Agriculture (ICBA).for providing quinoa seeds.
Disclosure statement
No potential conflict of interest was reported by the author(s).
ORCID
Chedly Abdelly http://orcid.org/0000-0003-2249-1130
Arafet Manaa http://orcid.org/0000-0001-5657-6007
Additional information
Notes on contributors
Walid Derbali
Walid Derbali is a Phd student in the Faculty of Sciences of Tunis at the University of Tunis El Manar, working on plant physiology.
Rahma Goussi
Rahma Goussi is posdodctoral researcher in the Centre of Biotechnology of Borj Cedria, working on resistance mechanisms of halophyte to abiotic stress.
Hans-Werner Koyro
Hans-Werner Koyro is a full professor of Ecology and Botany in the Institute for Plant Ecology, Justus-Liebig-University of Giessen (Germany).
Chedly Abdelly
Chedly Abdelly is a full professor of Plant Physiology and Biotechnology in the Centre of Biotechnology of Borj Cedria.
Arafet Manaa
Arafet Manaaa is a professor of plant molecular biology in the Centre of Biotechnology of Borj-Cedria.
References
- Abdelly C, Barhoumi Z, Ghnaya T, Debez A, Ben Hamed K, Ksouri R, Talbi O, Zribi F, Ouerghi Z, Smaoui A, et al. 2006. Potential utilisation of halophytes for the rehabilitation and valorisation of salt-affected areas in Tunisia. Biosaline Agric Salinity Tolerance in Plants. Birkhäuser Basel, Basel. 163–172. doi:10.1007/3-7643-7610-4_18.
- Abdelly C, Debez A, Smaoui A, Grignon C. 2011. Halophyte-fodder species association may improve nutrient availability and biomass production of the Sabkha ecosystem. In: Öztürk M., Böer B., Barth H.-J., Clüsener-Godt M., Khan M.A., Breckle S.-W., editor. Sabkha ecosystems: volume III: Africa and Southern Europe. Dordrecht: Springer Netherlands; p. 85–94. doi: 10.1007/978-90-481-9673-9_10
- Adolf VI, Shabala S, Andersen MN, Razzaghi F, Jacobsen S-E. 2012. Varietal differences of quinoa’s tolerance to saline conditions. Plant Soil. 357:117–129. doi:10.1007/s11104-012-1133-7.
- Aebi H. 1984. [13] Catalase in vitro. Methods in Enzymology. 105:121–126. doi:10.1016/S0076-6879(84)05016-3.
- Apel K, Hirt H. 2004. Reactive oxygen species: metabolism, oxidative stress, and signal transduction. Annu Rev Plant Biol. 55:373–399. doi:10.1146/annurev.arplant.55.031903.141701.
- Arndt SK, Arampatsis C, Foetzki A, Li X, Zeng F, Zhang X. 2004. Contrasting patterns of leaf solute accumulation and salt adaptation in four phreatophytic desert plants in a hyperarid desert with saline groundwater. J Arid Environ. 59:259–270. doi:10.1016/j.jaridenv.2004.01.017.
- Ashraf M, Foolad MR. 2007. Roles of glycine betaine and proline in improving plant abiotic stress resistance. Environ Exp Bot. 59:206–216. doi:10.1016/j.envexpbot.2005.12.006.
- Ashraf M, Harris PJC. 2004. Potential biochemical indicators of salinity tolerance in plants. Plant Sci. 166:3–16. doi:10.1016/j.plantsci.2003.10.024.
- Ashraf M, Harris PJC. 2013. Photosynthesis under stressful environments: An overview. Photosynthetica. 51:163–190. doi:10.1007/s11099-013-0021-6.
- Banerjee K, Gatti RC, Mitra A. 2017. Climate change-induced salinity variation impacts on a stenoecious mangrove species in the Indian Sundarbans. Ambio. 46:492–499. doi:10.1007/s13280-016-0839-9.
- Bano S, Ashraf M, Akram NA. 2014. Salt stress regulates enzymatic and nonenzymatic antioxidative defense system in the edible part of carrot (Daucus carota L.). J Plant Interact. 9:324–329. doi:10.1080/17429145.2013.832426.
- Bates LS, Waldren RP, Teare ID. 1973. Rapid determination of free proline for water-stress studies. Plant Soil. 39:205–207. doi:10.1007/BF00018060.
- Ben Amor N, Ben Hamed K, Debez A, Grignon C, Abdelly C. 2005. Physiological and antioxidant responses of the perennial halophyte Crithmum maritimum to salinity. Plant Sci. 168:889–899. doi:10.1016/j.plantsci.2004.11.002.
- Bendaly A, Messedi D, Smaoui A, Ksouri R, Bouchereau A, Abdelly C. 2016. Physiological and leaf metabolome changes in the xerohalophyte species Atriplex halimus induced by salinity. Plant Physiol Biochem. 103:208–218. doi:10.1016/j.plaphy.2016.02.037.
- Bertero HD, de la Vega AJ, Correa G, Jacobsen SE, Mujica A. 2004. Genotype and genotype-by-environment interaction effects for grain yield and grain size of quinoa (Chenopodium quinoa Willd.) as revealed by pattern analysis of international multi-environment trials. Field Crops Res. 89:299–318. doi:10.1016/j.fcr.2004.02.006.
- Bradford MM. 1976. A rapid and sensitive method for the quantitation of microgram quantities of protein utilizing the principle of protein-dye binding. Anal Biochem. 72:248–254. doi:10.1016/0003-2697(76)90527-3.
- Cuartero J, Romero-Aranda R, Yeo AR, Flowers TJ. 2002. Variability for some physiological characters affecting salt tolerance in tomato. Acta Hortic. 573:435–441. doi:10.17660/ActaHortic.2002.573.52.
- Dajié Z, Stajkovié M, Jakovljevié M. 1997. An ecophysiological study of Suaeda maritima (Chenopodiaceae) in Serbia. Bocconea. 5:511–516.
- Debez A, Ben Hamed K, Grignon C, Abdelly C. 2004. Salinity effects on germination, growth, and seed production of the halophyte Cakile maritima. Plant Soil. 262:179–189. doi:10.1023/B:PLSO.0000037034.47247.67.
- Demiral T, Türkan İ. 2005. Comparative lipid peroxidation, antioxidant defense systems and proline content in roots of two rice cultivars differing in salt tolerance. Environ Exp Bot. 53:247–257. doi:10.1016/j.envexpbot.2004.03.017.
- Eisa S, Hussin S, Geissler N, Koyro H. 2012. Effect of NaCl salinity on water relations, photosynthesis and chemical composition of Quinoa (Chenopodium quinoa Willd.) as a potential cash crop halophyte. Aust J Crop Sci. 6:357–368.
- Farhat N, Rabhi M, Falleh H, Lengliz K, Smaoui A, Abdelly C, Lachaâl M, Karray-Bouraoui N. 2013. Interactive effects of excessive potassium and Mg deficiency on safflower. Acta Physiol Plant. 35:2737–2745. doi:10.1007/s11738-013-1306-x.
- Flowers TJ, Colmer TD. 2008. Salinity tolerance in halophytes. New Phytol. 179:945–963. doi:10.1111/j.1469-8137.2008.02531.x.
- Flowers TJ, Colmer TD. 2015. Plant salt tolerance: adaptations in halophytes. Ann Bot. 115:327–331. doi:10.1093/aob/mcu267.
- Flowers TJ, Munns R, Colmer TD. 2015. Sodium chloride toxicity and the cellular basis of salt tolerance in halophytes. Ann Bot. 115:419–431. doi:10.1093/aob/mcu217.
- Foyer CH, Noctor G. 2005. Oxidant and antioxidant signalling in plants: a re-evaluation of the concept of oxidative stress in a physiological context. Plant Cell Environ. 28:1056–1071. doi:10.1111/j.1365-3040.2005.01327.x.
- Gagneul D, Aïnouche A, Duhazé C, Lugan R, Larher FR, Bouchereau A. 2007. A reassessment of the function of the so-called compatible solutes in the halophytic Plumbaginaceae Limonium latifolium. Plant Physiol. 144:1598–1611. doi:10.1104/pp.107.099820.
- Gill SS, Tuteja N. 2010. Reactive oxygen species and antioxidant machinery in abiotic stress tolerance in crop plants. Plant Physiol Biochem. 48:909–930. doi:10.1016/j.plaphy.2010.08.016.
- Goussi R, Manaa A, Derbali W, Cantamessa S, Abdelly C, Barbato R. 2018. Comparative analysis of salt stress, duration and intensity, on the chloroplast ultrastructure and photosynthetic apparatus in Thellungiella salsuginea. J Photochem Photobiol, B. 183:275–287. doi:10.1016/j.jphotobiol.2018.04.047.
- Hariadi Y, Marandon K, Tian Y, Jacobsen S-E, Shabala S. 2011. Ionic and osmotic relations in quinoa (Chenopodium quinoa Willd.) plants grown at various salinity levels. J Exp Bot. 62:185–193. doi:10.1093/jxb/erq257.
- Harrouni MC, Daoud S, Koyro H-W. 2003. Effect of seawater irrigation on biomass production and ion composition of seven halophytic species in Morocco. In: Lieth H., Mochtchenko M, editor. Cash crop halophytes: recent studies. Tasks for vegetation science, vol 38. Dordrecht: Springer; p. 59–70. doi: 10.1007/978-94-017-0211-9_6
- Hewitt EJ. 1966. Sand and water culture methods used in the study of plant nutrition. Tech. Commun., 22, Commonwealth Agric. Bureau, Farnham Royal, 2nd edn, 547 pp.
- Hussain MI, Al- Dakheel AJ, Reigosa MJ. 2018. Genotypic differences in agro-physiological, biochemical and isotopic responses to salinity stress in quinoa (Chenopodium quinoa Willd.) plants: Prospects for salinity tolerance and yield stability. Plant Physiol Biochem. 129:411–420. doi:10.1016/j.plaphy.2018.06.023.
- Iqbal H, Yaning C, Waqas M, Shareef M, Raza ST. 2018. Differential response of quinoa genotypes to drought and foliage-applied H2O2 in relation to oxidative damage, osmotic adjustment and antioxidant capacity. Ecotoxicol Environ Saf. 164:344–354. doi:10.1016/j.ecoenv.2018.08.004.
- Jacobsen S-E. 2014. New climate-proof cropping systems in dry areas of the Mediterranean region. J Agron Crop Sci. 200:399–401. doi:10.1111/jac.12080.
- Jacobsen S-E, Mujica A, Jensen CR. 2003. The resistance of quinoa (Chenopodium quinoa Willd.) to adverse abiotic factors. Food Rev Int. 19:99–109. doi:10.1081/FRI-120018872.
- Jacobsen S-E, Quispe H, Mujica A. 2001. Quinoa: an alternative crop for saline soils in the Andes, Scientists and Farmer-Partners in Research for the 21st Century. CIP Program Report 1999–2000, pp. 403–408.
- Jacobsen S-E, Sørensen M, Pedersen SM, Weiner J. 2013. Feeding the world: genetically modified crops versus agricultural biodiversity. Agron Sustainable Dev. 33:651–662. doi:10.1007/s13593-013-0138-9.
- James RA, Rivelli AR, Munns R, Caemmerer Sv. 2002. Factors affecting CO2 assimilation, leaf injury and growth in salt-stressed durum wheat. Funct Plant Biol. 29:1393–1403. doi:10.1071/FP02069.
- Jamil A, Riaz S, Ashraf M, Foolad MR. 2011. Gene expression profiling of plants under salt stress. Crit Rev Plant Sci. 30:435–458. doi:10.1080/07352689.2011.605739.
- Karyotis T, Iliadis C, Noulas C, Mitsibonas T. 2003. Preliminary research on seed production and nutrient content for certain quinoa varieties in a saline–sodic soil. J Agron Crop Sci. 189:402–408. doi:10.1046/j.0931-2250.2003.00063.x.
- Khan AM, Ungar IA, Showalter AM. 2000. The effect of salinity on the growth, water status, and ion content of a leaf succulent perennial halophyte, Suaeda fruticosa (L.) Forssk. J Arid Environ. 45:73–84. doi:10.1006/jare.1999.0617.
- Koyro H-W. 2003. Study of potential cash crop halophytes by a quick check system: determination of the threshold of salinity tolerance and the ecophysiological demands. In: Lieth H., Mochtchenko M., editor. Cash crop halophytes: recent studies. Tasks for vegetation science, vol 38. Dordrecht: Springer; p. 5–17. doi: 10.1007/978-94-017-0211-9_1
- Koyro HW. 2006. Effect of salinity on growth, photosynthesis, water relations and solute composition of the potential cash crop halophyte Plantago coronopus (L.). Environ Exp Bot. 56:136–146. doi:10.1016/j.envexpbot.2005.02.001.
- Koyro H-W, Eisa SS. 2008. Effect of salinity on composition, viability and germination of seeds of Chenopodium quinoa Willd. Plant Soil. 302:79–90. doi:10.1007/s11104-007-9457-4.
- Koyro H-W, Geissler N, Hussin S, Huchzermeyer B. 2006. Mechanisms of cash crop halophytes to maintain yields and reclaim saline soils in arid areas. In: Khan M.A., Weber D.J, editor. Ecophysiology of high salinity tolerant plants. Tasks for vegetation science, vol 40. Dordrecht: Springer; p. 345–366. doi: 10.1007/1-4020-4018-0_22
- Lichtenthaler HK. 1987. [34] Chlorophylls and carotenoids: pigments of photosynthetic biomembranes. Methods Enzymol. 148:350–382. doi:10.1016/0076-6879(87)48036-1.
- Loreto F, Velikova V. 2001. Isoprene produced by leaves protects the photosynthetic apparatus against ozone damage, quenches ozone products, and reduces lipid peroxidation of cellular membranes. Plant Physiol. 127:1781–1787. doi:10.1104/pp.010497.
- Lutts S, Kinet JM, Bouharmont J. 1996. Effects of salt stress on growth, mineral nutrition and proline accumulation in relation to osmotic adjustment in rice (Oryza sativa L.) cultivars differing in salinity resistance. Plant Growth Regul. 19:207–218. doi:10.1007/BF00037793.
- Manaa A, Ben Ahmed H, Valot B, Bouchet J-P, Aschi-Smiti S, Causse M, Faurobert M. 2011. Salt and genotype impact on plant physiology and root proteome variations in tomato. J Exp Bot. 62:2797–2813. doi:10.1093/jxb/erq460.
- Manaa A, Gharbi E, Mimouni H, Wasti S, Aschi-Smiti S, Lutts S, Ben Ahmed H. 2014a. Simultaneous application of salicylic acid and calcium improves salt tolerance in two contrasting tomato (Solanum lycopersicum) cultivars. S Afr J Bot. 95:32–39. doi:10.1016/j.sajb.2014.07.015.
- Manaa A, Goussi R, Derbali W, Cantamessa S, Abdelly C, Barbato R. 2019. Salinity tolerance of quinoa (Chenopodium quinoa Willd.) as assessed by chloroplast ultrastructure and photosynthetic performance. Environmental and Experimental Botany. 162:103–114. doi:10.1016/j.envexpbot.2019.02.012.
- Manaa A, Mimouni H, Terras A, Chebil F, Wasti S, Gharbi E, Ben Ahmed H. 2014b. Superoxide dismutase isozyme activity and antioxidant responses of hydroponically cultured Lepidium sativum L. to NaCl stress. J Plant Interact. 9:440–449. doi:10.1080/17429145.2013.850596.
- Mansour MMF, Ali EF. 2017. Evaluation of proline functions in saline conditions. Phytochem. 140:52–68. doi:10.1016/j.phytochem.2017.04.016.
- Misra N, Gupta AK. 2005. Effect of salt stress on proline metabolism in two high yielding genotypes of green gram. Plant Sci. 169:331–339. doi:10.1016/j.plantsci.2005.02.013.
- Mittal S, Kumari N, Sharma V. 2012. Differential response of salt stress on Brassica juncea: photosynthetic performance, pigment, proline, D1 and antioxidant enzymes. Plant Physiol Biochem. 54:17–26. doi:10.1016/j.plaphy.2012.02.003.
- Mittler R. 2002. Oxidative stress, antioxidants and stress tolerance. Trends Plant Sci. 7:405–410. doi:10.1016/S1360-1385(02)02312-9.
- Munns R, Termaat A. 1986. Whole-plant responses to salinity. Aust J Plant Physiol. 13:143–160. doi:10.1071/PP9860143.
- Munns R, Tester M. 2008. Mechanisms of salinity tolerance. Annu Rev Plant Biol. 59:651–681. doi:10.1146/annurev.arplant.59.032607.092911.
- Nakano Y, Asada K. 1981. Hydrogen peroxide is scavenged by ascorbate specific peroxidase in spinach chloroplasts. Plant & Cell Physiol. 22:867–888. doi:10.1093/oxfordjournals.pcp.a076232.
- Negrão S, Schmöckel SM, Tester M. 2017. Evaluating physiological responses of plants to salinity stress. Ann Bot. 119:1–11. doi:10.1093/aob/mcw191.
- Nikalje CG, Nikam TD, Suprasanna P. 2017. Looking at halophytic adaptation to high salinity through genomics Landscape. Curr Genomics. 18:542–552. doi:10.2174/1389202918666170228143007.
- Oukarroum A, Bussotti F, Goltsev V, Kalaji HM. 2015. Correlation between reactive oxygen species production and photochemistry of photosystems I and II in Lemna gibba L. plants under salt stress. Environ Exp Bot. 109:80–88. doi:10.1016/j.envexpbot.2014.08.005.
- Rao MKV, Sresty TVS. 2000. Antioxidative parameters in the seedlings of pigeonpea (Cajanus cajan (L.) Millspaugh) in response to Zn and Ni stresses. Plant Sci. 157:113–128. doi:10.1016/S0168-9452(00)00273-9.
- Redondo-Gómez S, Mateos-Naranjo E, Davy AJ, Fernandez-Munoz F, Castellanos EM, Luque T, Figueroa ME. 2007. Growth and photosynthetic responses to salinity of the salt-marsh shrub Atriplex portulacoides. Ann Bot. 100:555–563. doi:10.1093/aob/mcm119.
- Redondo-Gómez S, Mateos-Naranjo E, Figueroa ME, Davy AJ. 2010. Salt stimulation of growth and photosynthesis in an extreme halophyte, Arthrocnemum macrostachyum. Plant Biol. 12:79–87. doi:10.1111/j.1438-8677.2009.00207.x.
- Redondo-Gómez S, Wharmby C, Castillo JM, Mateos-Naranjo E, Luque CJ, de Cires A, Luque T, Davy AJ, Figueroa ME. 2006. Growth and photosynthetic responses to salinity in an extreme halophyte, Sarcocornia fruticosa. Physiol Plant. 128:116–124. doi:10.1111/j.1399-3054.2006.00719.x.
- Rozema J, Flowers T. 2008. Crops for a salinized world. Science. 322:1478–1480. doi:10.1126/science.1168572.
- Ruiz KB, Biondi S, Oses R, Acuña-Rodríguez IS, Antognoni F, Martinez-Mosqueira EA, Coulibaly A, Canahua-Murillo A, Pinto M, Zurita-Silva A, et al. 2014. Quinoa biodiversity and sustainability for food security under climate change. A review. Agron Sustainable Dev. 34:349–359. doi:10.1007/s13593-013-0195-0.
- Shabala S. 2013. Learning from halophytes: physiological basis and strategies to improve abiotic stress tolerance in crops. Ann Bot. 112:1209–1221. doi:10.1093/aob/mct205.
- Shabala S, Hariadi Y, Jacobsen S-E. 2013. Genotypic difference in salinity tolerance in quinoa is determined by differential control of xylem Na+ loading and stomatal density. J Plant Physiol. 170:906–914. doi:10.1016/j.jplph.2013.01.014.
- Song J, Feng G, Tian C-Y, Zhang F-S. 2006. Osmotic adjustment traits of Suaeda physophora, Haloxylon ammodendron and Haloxylon persicum in field or controlled conditions. Plant Sci. 170:113–119. doi:10.1016/j.plantsci.2005.08.004.
- Sosa-Zuniga V, Brito V, Fuentes F, Steinfort U. 2017. Phenological growth stages of quinoa (Chenopodium quinoa) based on the BBCH scale. Ann Appl Biol. 171:117–124. doi:10.1111/aab.12358.
- Souid A, Bellani L, Magné C, Zorrig W, Smaoui A, Abdelly C, Longo V, Ben Hamed K. 2018. Physiological and antioxidant responses of the sabkha biotope halophyte Limonium delicatulum to seasonal changes in environmental conditions. Plant Physiol Biochem. 123:180–191. doi:10.1016/j.plaphy.2017.12.008.
- Sudhir P, Murthy SDS. 2004. Effects of salt stress on basic processes of photosynthesis. Photosynthetica. 42:481–486. doi:10.1007/S11099-005-0001-6.
- Vineis P, Chan Q, Khan A. 2011. Climate change impacts on water salinity and health. J Epidemiol Glob Health. 1:5–10. doi:10.1016/j.jegh.2011.09.001.
- Vineis P, Khan A. 2012. Climate change-induced salinity threatens health. Science. 338:1028–1029. doi:10.1126/science.338.6110.1028-b.
- Waqas M, Yaning C, Iqbal H, Shareef M, Rehman H, Yang Y. 2017. Paclobutrazol improves salt tolerance in quinoa: Beyond the stomatal and biochemical interventions. J Agron Crop Sci. 203:315–322. doi:10.1111/jac.12217.
- Waqas M, Yaning C, Iqbal H, Shareef M, ur Rehman H, Iqbal S, Mahmood S. 2019. Soil drenching of paclobutrazol: An efficient way to improve quinoa performance under salinity. Physiol Plant. 165:219–231. doi:10.1111/ppl.12820.
- Willekens H, Chamnongpol S, Davey M, Schraudner M, Langebartels C, Van Montagu M, Van Camp W. 1997. Catalase is a sink for H2O2 and is indispensable for stress defence in C3 plants. EMBO J. 16:4806–4816. doi:10.1093/emboj/16.16.4806.
- Wolf B. 1982. A comprehensive system of leaf analyses and its use for diagnosing crop nutrient status. Commun Soil Sci Plant Anal. 13:1035–1059. doi:10.1080/00103628209367332.
- Yeo A. 1998. Molecular biology of salt tolerance in the context of whole-plant physiology. J Exp Bot. 49:915–929. doi:10.1093/jxb/49.323.915.
- Zhang H, Zhao K. 1998. Effects of salt and water stresses on osmotic adjustment of Suaeda salsa seedlings. Acta Bot Sin. 40:56–61.
- Zhao X, Wang W, Zhang F, Deng J, Li Z, Fu B. 2014. Comparative metabolite profiling of two rice genotypes with contrasting salt stress tolerance at the seedling stage. PLoS One. 9:e108020. doi:10.1371/journal.pone.0108020.
- Zurita-Silva A, Fuentes F, Zamora P, Jacobsen S-E, Schwember AR. 2014. Breeding quinoa (Chenopodium quinoa Willd.): potential and perspectives. Mol Breed. 34:13–30. doi:10.1007/s11032-014-0023-5.